
A correction was expected to continue.
A small real body for mostly sideways movement fits the expectation.
Summary: The correction is still incomplete. It looks like it may most likely continue sideways as a triangle which may end in three more trading days. It is still possible that it could end tomorrow as a quicker zigzag but this looks much less likely. The trend is up, so the breakout should be up.
New updates to this analysis are in bold.
Last published weekly chart is here.
DAILY ELLIOTT WAVE COUNT
Click chart to enlarge.
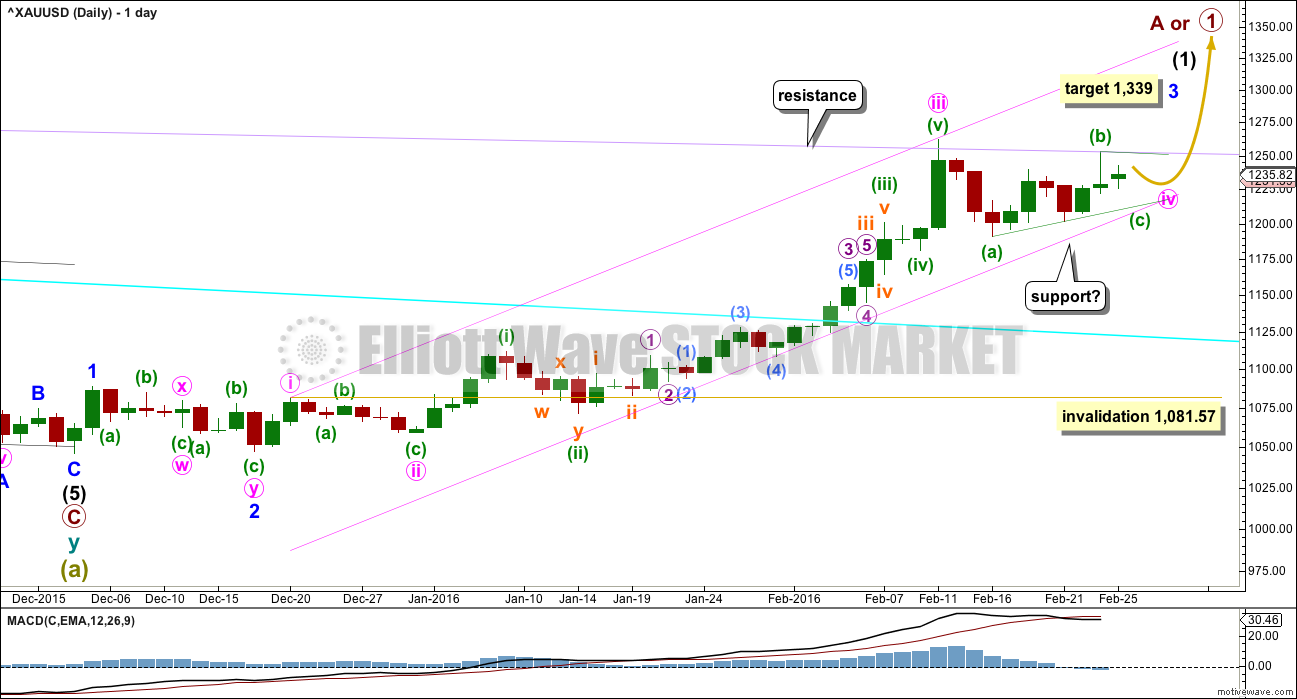
Gold has very likely changed from bear to bull.
So far, within the first five up, the middle of the third wave is now most likely complete. The strongest move may still be ahead. Gold typically exhibits swift strong fifth waves to end its third wave impulses. Look out for surprises to the upside for minute wave v and minor wave 5.
At 1,339 minor wave 3 would reach 6.854 the length of minor wave 1. When minute wave iv is confirmed as over, then this target may be calculated at a second degree. At that stage, it may widen to a zone, it may change, or a second target may be added.
Minute waves i, ii and now iii are complete within minor wave 3.
The pink channel is a best fit. Draw the first trend line from the highs labeled minute waves i to iii then place a parallel copy lower to contain the whole upwards wave. Minute wave iv may find support at the lower pink line. If price touches that line, it should offer a low risk entry point to join the upwards trend.
The main hourly wave count now expects a triangle is most likely unfolding sideways. Upwards movement is finding resistance at the lilac line and downwards movement is finding support at the (a)-(c) triangle trend line. To see how to draw the lilac line see the weekly chart here.
If the alternate hourly wave count is correct, then the lower pink trend line may be breached. Sometimes fourth waves are not contained nicely within channels; sometimes they breach channels.
Minute wave iv may not move into minute wave i price territory below 1,081.57.
MAIN HOURLY WAVE COUNT
Click chart to enlarge.
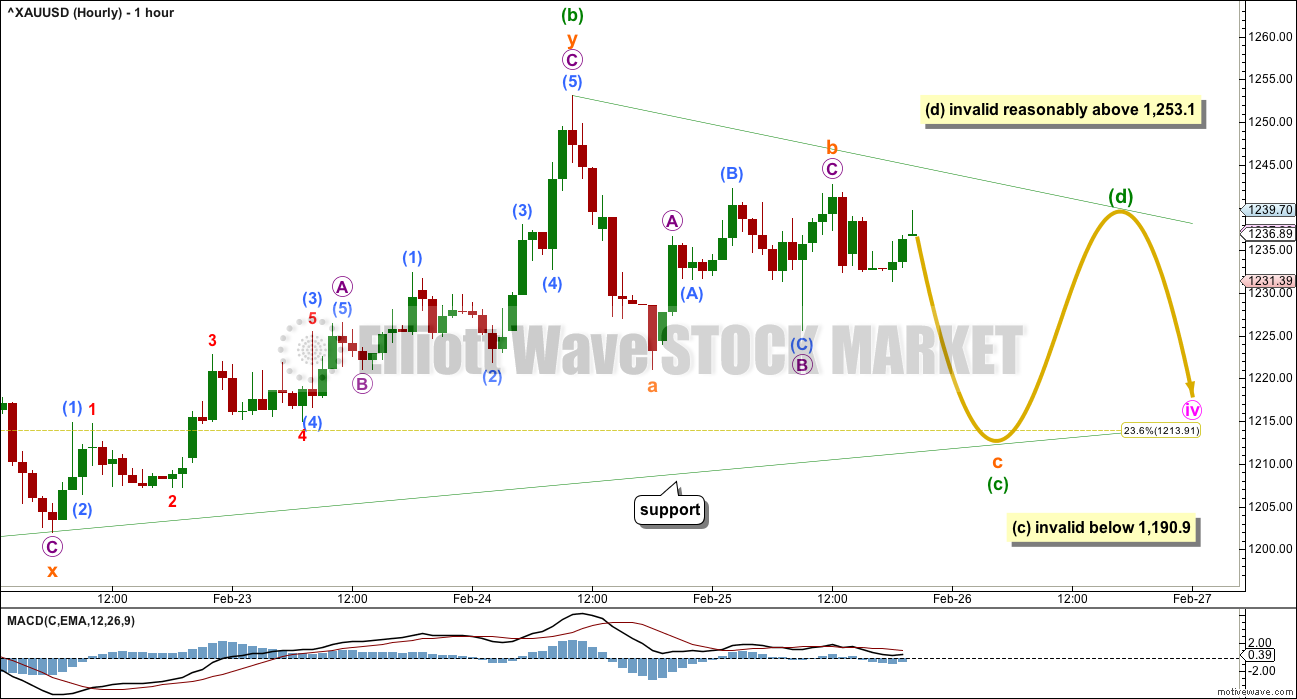
This main hourly wave count expects to see alternation in structure between the zigzag of minute wave ii and the triangle of minute wave iv. This is the main wave count for this reason only.
Minuette wave (b) subdivides as a double zigzag. Minuette wave (a) may be seen as a single zigzag. Minuette wave (b) is less than 0.9 the length of minuette wave (a), so a flat correction is not possible as the minimum requirement was not met. A triangle may still be unfolding sideways.
Within a possible regular contracting or barrier triangle, minuette wave (c) may not move below the end of minuette wave (a) at 1,190.9. Thereafter, minuette wave (d) may not move substantially above the end of minuette wave (b) at 1,253.1. The triangle will remain valid as long as the (b)-(d) trend line remains essentially flat.
This main wave count expects minute wave iv to find support at the pink trend line. It may end about the 0.236 Fibonacci ratio at 1,213.91. If it continues for a further three sessions, it may total a Fibonacci thirteen daily candlesticks.
Within minuette wave (c) downwards, subminuette wave b may not move beyond the start of subminuette wave a above 1,253.10.
Minuette wave (c) may end at the lower green trend line. This is drawn across the daily lows for 16th February and 22nd February (see the daily chart). Extend this line out and look for price to find support there.
Triangles take time and test our patience. That is their purpose. This one still has a few days of sideways movement to go.
ALTERNATE HOURLY WAVE COUNT
Click chart to enlarge.
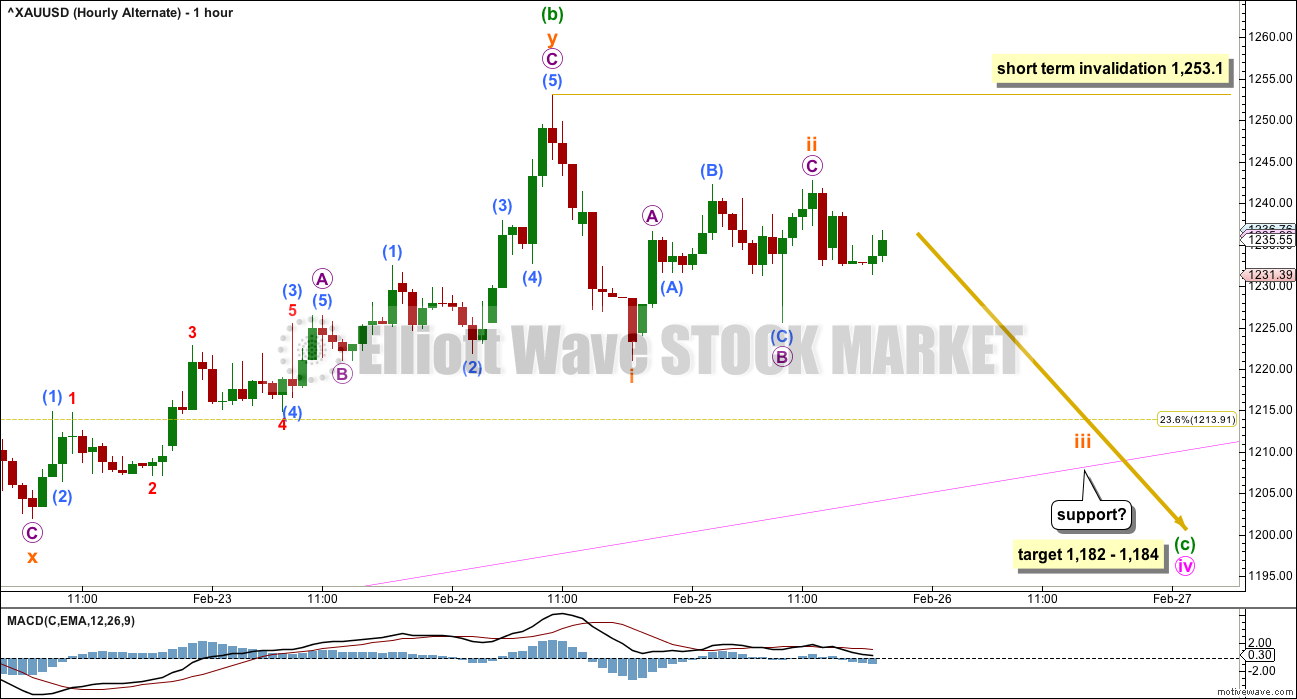
Minute wave iv may be continuing as a zigzag. This would offer no structural alternation with minute wave ii which was also a zigzag. For this reason, this must be an alternate wave count with a lower probability.
If any movement below 1,190.9 is seen, then the triangle would be invalidated leaving only this alternate wave count. At that stage, expect price to continue lower to the target and overshoot the pink trend line.
At 1,182 minuette wave (c) would reach equality in length with minuette wave (a). This is close to the 0.382 Fibonacci ratio at 1,184 giving a $2 target zone with a reasonable probability.
This alternate wave count could see minute wave iv end in just one more session. It would not exhibit a Fibonacci duration.
SECOND ALTERNATE HOURLY WAVE COUNT
Click chart to enlarge.
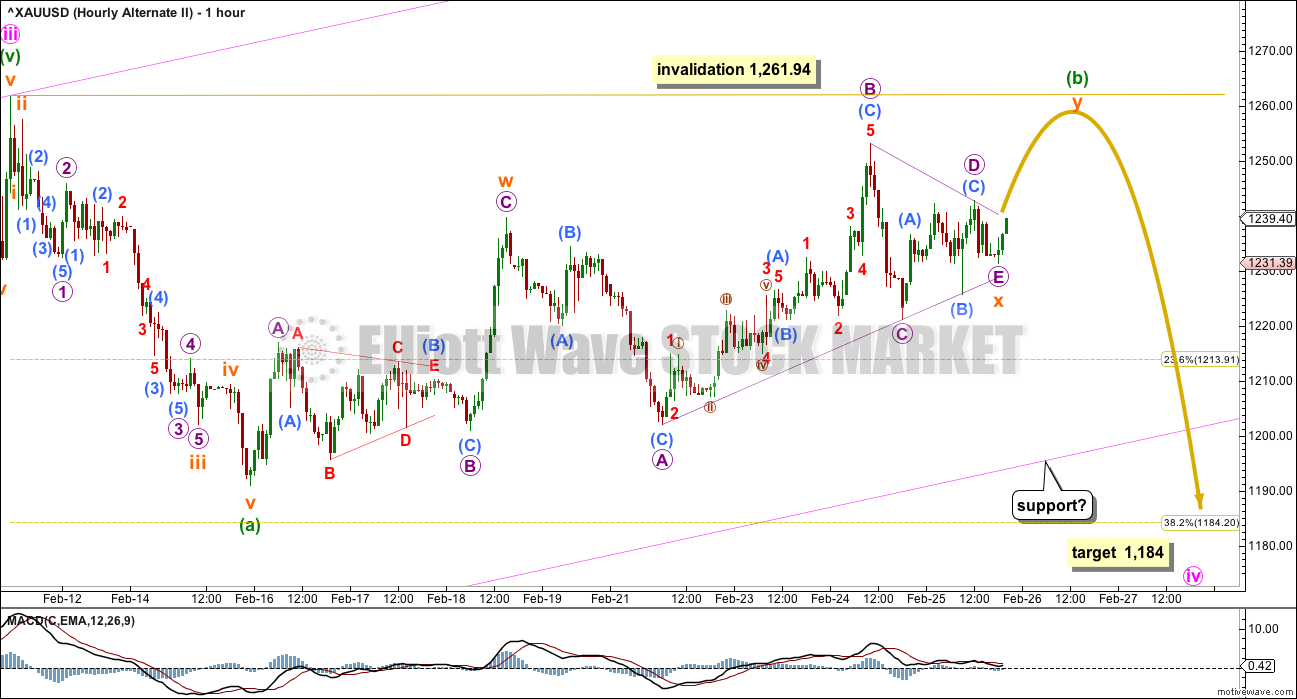
I have learned the hard way to always consider alternate ways of labelling a triangle when it looks like one may be unfolding. What if the triangle is an X wave within a B wave double zigzag?
Minute wave iv is still seen as a zigzag. Minuette wave (a) fits as a five wave impulse. Minuette wave (b) may not move beyond its start above 1,261.94.
This wave count expects the triangle is now complete and the breakout will be upwards. A new high above 1,253.10 would invalidate the first two hourly wave counts leaving only this one.
This wave count has a low probability. X waves within double zigzags are almost always brief shallow zigzags.
When minuette wave (b) is complete, then this wave count expects minuette wave (c) to make at least a slight new low below minuette wave (a) at 1,190.90 to avoid a truncation. It would most likely end about the 0.382 Fibonacci ratio at 1,184.
TECHNICAL ANALYSIS
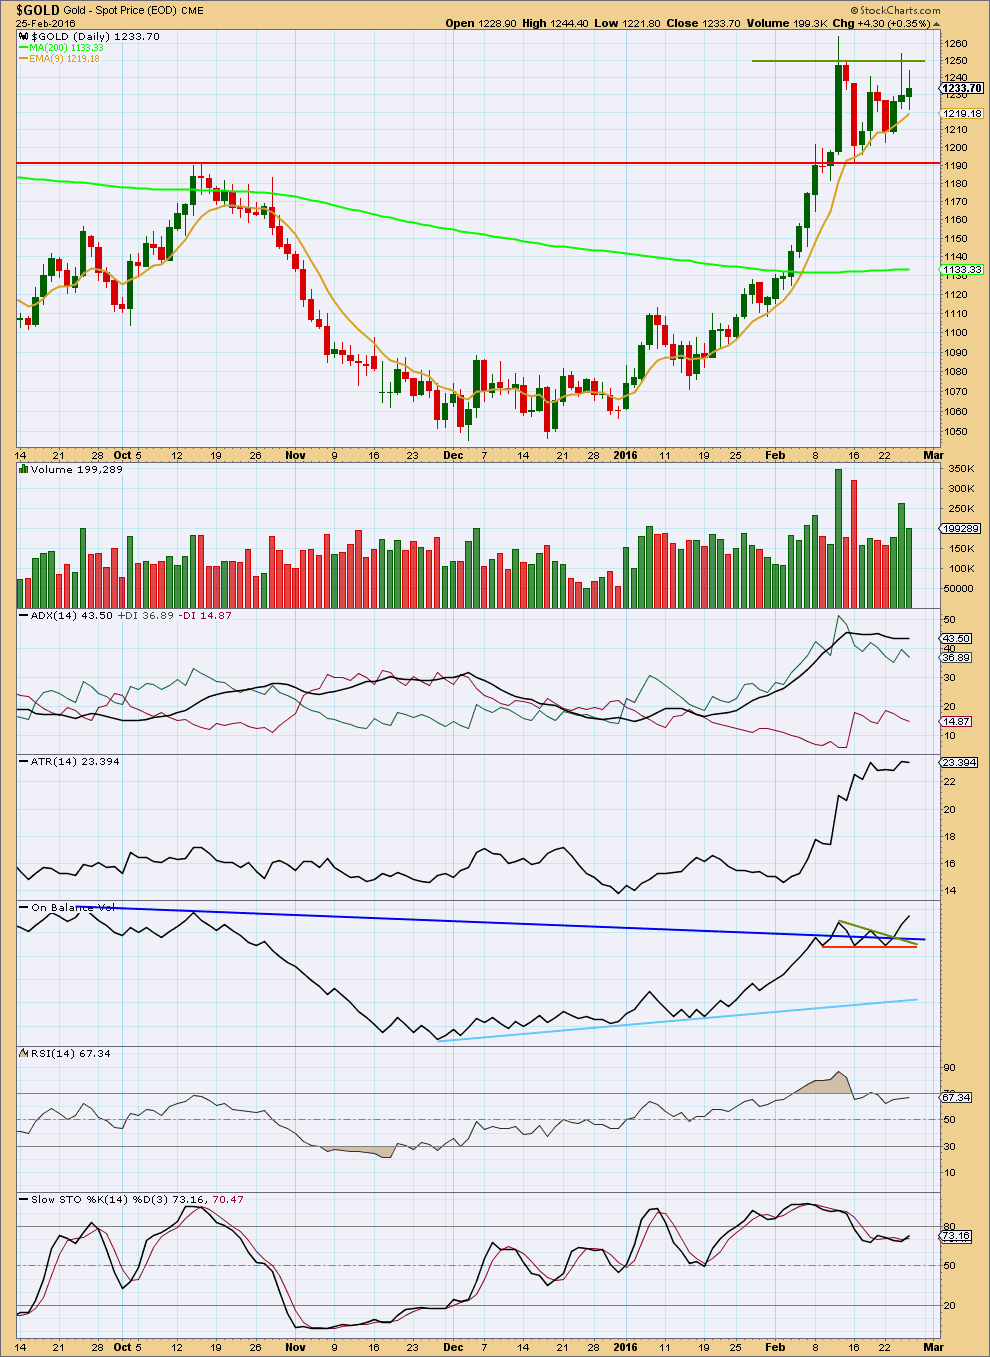
Click chart to enlarge. Chart courtesy of StockCharts.com.
Price remains constrained within the upper green line offering resistance and the lower red line offering support. A decline in volume today for a green candlestick indicates the market is still correcting.
ADX is flat to declining indicating the market is correcting. ATR is flat, so it agrees.
Apart from the outlier of 16th February, highest volume is for an upwards day. The 16th of February may include data for the holiday session of 15th February for which there is no daily candlestick in StockCharts data. If this candlestick for 16th February is ignored, then the breakout direction indicated by volume should be upwards.
If the volume for the daily candlestick of 16th February is taken into account. then the breakout direction indicated by volume should be downwards.
On Balance Volume may be providing an early indication. It has broken above all of its trend lines. OBV is often a reliable early indicator for price. This supports the Elliott wave count.
RSI is neutral. There is plenty of room for this market to rise or fall. Stochastics has returned from overbought.
This analysis is published @ 08:53 p.m. EST.
…. a pullback (short term decline) is expecting for Monday…. wonder how far down it will go and it the drop will be able to test 20dma at 1195…..
Lara u mentioned…”Gold may turn down for a bigger even longer lasting correction”.
What does this mean…??
I think Lara is referring to Minor (blue) wave 4 which would have an invalidation of top of Minor wave 1
Gold COT is bearish again!!!!
Large commercial shorts – 427016 +34071 Net shorts 86913 (11.8% of Open Interest)
Chart Later.
http://news.goldseek.com/COT/1456518756.php
If we have a fourth wave triangle then the fifth wave may be surprisingly short.
And then Gold may turn down for a bigger even longer lasting correction.
That may fit with a bearish COT report. They seem to precede the turn by a few days? Is that right?
Yes. I think this fits well EW count. It will take few days or less up day then the correction for 11 weeks (per MTLSD chart 10 weeks swaps net short).
Waiting for his chart this weekend.
The first two hourly charts remain valid. The third (which really was a “what if?”) is wrong.
So again, now down to two ideas.
So far this downwards movement looks very much like an incomplete five, currently just completed a small fourth wave correction and now to make a slight new low below 1,211.45 for the fifth wave. This would complete a zigzag for minuette (c) down for the triangle… or it’s subminuette iii of the alternate.
Either way, Gold is still consolidating. The breakout should now be next week. This consolidation really is taking its time, longer than originally expected. That does tend to annoy and exasperate traders I know. Patience is the key. Wait for the breakout, wait for confirmation of a trend resuming and then join the trend.
Some really basic tenets of trading: trade with the trend, wait for confirmation.
Richard
“US Dollar up and markets up and thought of interest hikes up = gold down”
Several times Lara has made the point that each equity has its own markets.
EW rules for USD, Gold and rates.
Time to time forex market may jerk gold around. Remember Swiss Frank when it was de-linked from Euro gold went up to 1308.
Ever since Frank has not any effect on gold price.
Gold is another currency like Yen. USD and Euro and so no. It has its own market.
Yes I know it is not always, however often in my opinion. Others naturally have their own beliefs that would vary. To each their own based on their experiences and perception.
I believe (c) of C on main hourly finished today.
Prices have touched the trend line, but orange c wave on the main hourly count not seems finished….. I cannot count it in five….
Possibly a 5 with an extended 5th wave? – very common for gold.
Hard to say for sure on my chart.
Going above approx. 1228.35 now (possible W1 of c low) would likely mean this move up is not W4 of orange c so at that point we possibly in wave d orange?
Survey Respondents Upbeat On Gold Despite Price Pullback
Friday February 26, 2016 12:10
http://www.kitco.com/news/2016-02-26/Survey-Respondents-Upbeat-On-Gold-Despite-Price-Pullback.html
Gold Bullion Holds 2016 Jump as Deutsche & CNBC Say ‘Buy’, Asian Traders ‘Mostly Sellers’ Friday, 2/26/2016 13:37
https://www.bullionvault.com/gold-news/gold-bullion-022620163
Gold stopped exactly at its lower trend line.
Yes it held, draw trend line 1 day and 1 hour across day bottoms of Feb 16th and 22nd and gold held today at 1,211.51 low at 11:08 am EST so far today.
Dollar surges vs. euro, yen as data quell recession fears – Feb 26, 2016 11:04 a.m. ET
Data calm fears about impending recession
http://www.marketwatch.com/story/dollar-slips-against-major-crosses-ahead-of-g-20-meeting-2016-02-26
US Dollar up and markets up and thought of interest hikes up = gold down
Interest rates were raised continually by Paul Volker in 1978 to 1979 to 1980 by the FED and gold climbed from $150 or so per ounce to $800 and sliver from $10 to $50 pertounce. So Mr Bessner rising dollar and rising interest rates do NOT always mean gold will drop! “Those who don’t remember their history etc.”
“This main wave count expects minute wave iv to find support at the pink trend line. It may end about the 0.236 Fibonacci ratio at 1,213.91. It may continues for a further three sessions. Minuette wave (c) may end at the lower green trend line. This is drawn across the daily lows for 16th February and 22nd February. Extend this line out and look for price to find support there.”
I extended the line and multi-day support is at 1214 so if that holds today I buy GDX.
GDX miner sentiment at overbought level. RSI is highest and sentiment is at 62.
What is next??
Looking at the RSI levels on the helpful chart RSI did go up higher and for longer twice in 2015 and 1 much bigger and longer beginning of 2014 into mid March. This is a multi confirmed new Bull and in that super cycle change the oversold indicators may stay oversold for longer as per 2 EW experts.
Seeing the europian markets i think today US markets will rock on the upside…giving gold a push down to complete its minutte 4 correction…these markets compliments each other… 🙂
Oil is behaving bullish…personally dont see it as a minor 4 move as its getting too long…
Any idea or comment..??
The analysis doesn’t change at this stage for Oil. All three wave counts remain the same and valid so far, but the main count is looking very unlikely and may be invalidated soon.
This is very exciting! It looks like the SPX 500 has finished its correction and possibly will soon begin to trend back down. Hopefully today’s Gold candle will finish lower than yesterday’s candle, and I shall listen out for the ‘All Aboard’ whistle! If it does finish lower (I am in the UK and it is dropping quite quickly as I write) would that be the end of minute iv?
For the triangle, no. More sideways probably for another couple of days yet.
For the zigzag it needs to keep going lower first.
The market looked like it had a little more giddy up today, maybe oil will help it punch through the 1950 level up to 1990 or so. That might keep the gold market at bay but it looks like it is getting restless in the starting gate. A quick punch lower would reload the spring and propel it upwards. Silver is almost oversold on stochastics and may be bottoming before gold. Commercials for Gold and especially silver getting very negative though…..lots to consider, glad I don’t have a blog.
Sounds good , anything for gold to drop and spring up when we have all bought in.
Lot to consider should also include gold seasonal .
2014 Gold rallied from Dec 31st low up to March 13th so this Bull could keep on .