
A little more upwards movement was expected.
Price has moved slightly higher.
Summary: Price is squeezed between the final bear market trend line and a short term support line (now coloured green on all charts for clarity). A break above the cyan line or below the green line is required. The bear wave count is favoured and better supported by volume analysis; this upwards movement is weak and should be expected to end here or very soon. The bull wave count still comes with the strong caveat that we have zero confirmation of a super cycle degree trend change from bear to bull for gold.
New updates to this analysis are in bold.
Last published weekly charts with the bigger picture are here.
MAIN BEAR ELLIOTT WAVE COUNT
Click chart to enlarge.
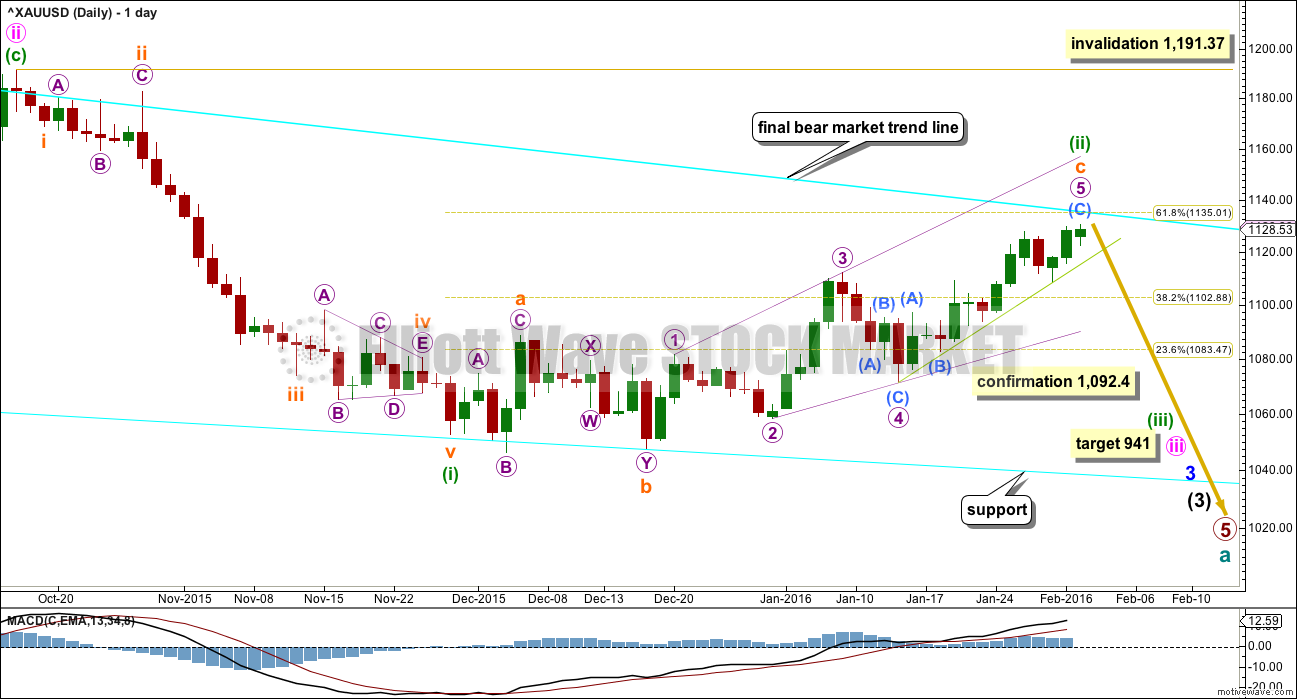
Gold has been in a bear market since September 2011. There has not yet been confirmation of a change from bear to bull, so at this stage any bull wave count would be trying to pick a low which is not advised. Price remains below the 200 day moving average and below the cyan trend line. The bear market should be expected to be intact until we have technical confirmation of a big trend change.
The final line of resistance (cyan line copied over from weekly charts) is only overshot and not so far properly breached. Simple is best, and the simplest method to confirm a trend change is a trend line.
Minute wave ii is a complete zigzag and deep at 0.73 the length of minute wave i.
At 941 minute wave iii would reach 1.618 the length of minute wave i.
Minuette wave (i) is complete.
Minuette wave (ii) looks like a fairly typical expanded flat correction which may end about the 0.618 Fibonacci ratio at 1,135.
Subminuette wave c may be a complete ending contracting *Edit: expanding diagonal.
Price should find resistance at the final bear market trend line. If that line is breached, it would indicate a trend change from bear to bull. If that happens, then this bear wave count would be relegated to an unlikely alternate.
I added an important trend line which is currently offering support to current upwards movement to this daily chart. The trend line is coloured green (to differentiate it from the cyan bear market trend line). It is vital that this green line is clearly breached by downwards movement before confidence may be had that minuette wave (ii) is over. While price continues to sit above this line, it is entirely possible that upwards movement may continue and may even overshoot the bear market trend line before turning down.
MAIN BEAR HOURLY CHART
Click chart to enlarge.
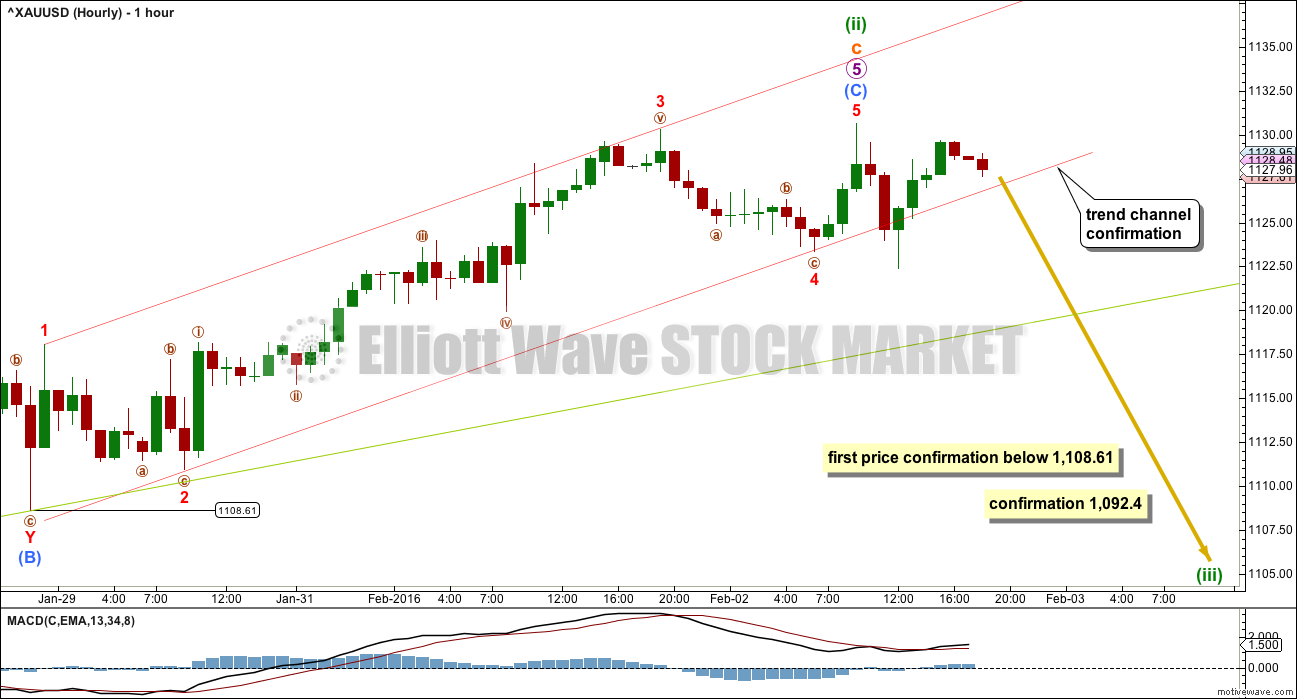
A slight new high may be the end of the fifth wave for submicro wave (C), which has unfolded as an impulse.
Submicro wave (C) sits neatly within its Elliott channel (drawn in red).
Submicro wave (C) is now just 0.39 longer than 0.382 the length of submicro wave (A).
Ratios within submicro wave (C) are: there is no Fibonacci ratio between minuscule waves 3 and 1, and minuscule wave 5 is now just 0.12 short of 0.382 the length of minuscule wave 3.
Initial indication of a possible trend change would come with a clear breach of the red channel containing submicro wave (C) on the hourly chart.
Thereafter, further indication of a trend change would come with a clear breach of the green trend line which is copied over here from the daily chart.
1,108.61 is the start of submicro wave (C). A new low below this point could not be a second wave correction within submicro wave (C), so at that stage submicro wave (C) would have to be over. This would provide confidence in a trend change.
A new low below 1,092.4 would invalidate the alternate wave count below and provide further confidence in this main wave count.
The invalidation point will remain at 1,191.37, as it is on the daily chart, while we have no confirmation that the upwards trend has ended. This is the risk posed at this stage from this wave count.
When there is some confirmation of a trend change, then the invalidation point for the hourly chart will be placed at the high of minuette wave (ii).
ALTERNATE BULL WAVE COUNT
Click chart to enlarge.
This was published here as a second alternate wave count. I will use it as the only regular alternate bull wave count because it is the only bull wave count to meet all Elliott wave rules.
I want to remind members that last time Gold saw a reasonable upwards movement from 24th July, 2015, to 15th October, 2015, there were many who expected that rise meant the bear market had ended and a new bull market had begun. It turned out that idea was premature: price turned around and made new lows. On 21st August I developed three bullish wave counts, partly in response to a demand from members, and one by one they have all been eliminated.
Now, again, price rises and there is a demand for bullish wave counts.
It is my strong view that this is premature. I will publish this wave count with that strong caveat.
Eventually the market will change from bear to bull, and when that change is confirmed that is the time to have confidence in a bull wave count. That time is not now.
Price remains below the 200 day moving average. Price has made a series of lower highs and lower lows down to the last recent low. There is not a clear five up on the daily chart. Price remains below the bear market trend line. While price remains below that line this wave count will be an alternate and comes with a strong warning that it is premature.
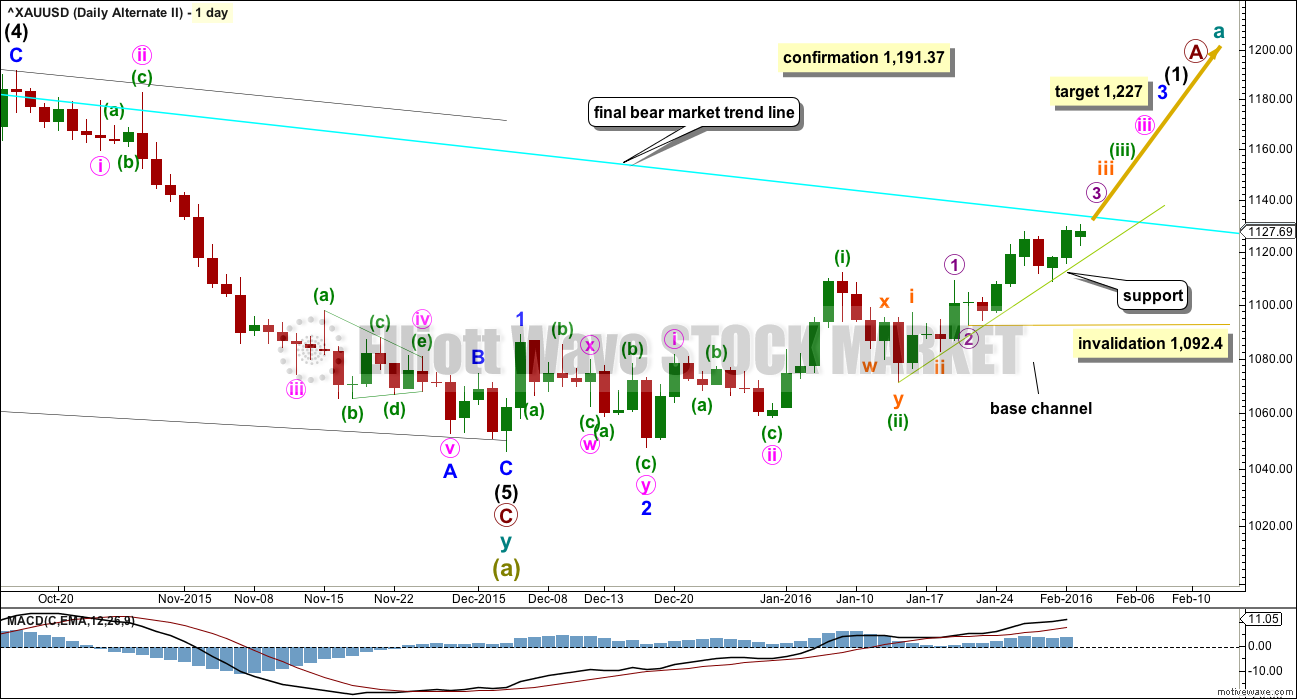
Downwards movement from the all time high for this bull wave count is seen as a big double zigzag which would most likely be complete at super cycle degree for an A wave.
When an A wave subdivides as a three, then the larger structure may be either a flat or triangle. The B wave may make a new price extreme beyond the start of the A wave within flats and triangles. Here, super cycle wave (b) may move above 1,920.18 as in an expanded flat or running triangle.
When the first move of a larger correction subdivides as a multiple (w-x-y), then a combination may be eliminated. Combinations may not have multiples within multiples, because that would increase the number of corrective structures within a multiple beyond three and violate the rule.
A new wave up at super cycle degree must begin with a clear five up on the daily chart (and probably the weekly as well). So far only minor waves 1 and 2 are complete. At 1,227 minor wave 3 would reach 4.236 the length of minor wave 1.
Minute waves i and ii are complete within minor wave 3. The acceleration channel is not working, so a more conservative base channel is drawn about these two waves. Copy it over to the hourly chart. A lower degree second wave correction for minuette wave (ii) should not breach a base channel drawn about a first and second wave one or more degrees higher.
The daily chart is on a semi-log scale and the hourly chart is on an arithmetic scale. This means channels sit slightly differently between these charts. The base channel has been breached now by upwards movement on both charts. The base channel on the hourly chart on an arithmetic scale is today perfectly showing where downwards movement is finding support. It may continue to do so.
Only submicro wave (1) may be complete within micro wave 3. This is shown on the hourly chart.
Gold often exhibits swift strong fifth waves, particularly the fifth waves to end its third wave impulses. Be aware of this tendency, because it could mean that any one of or more than one of micro wave 5, subminuette wave v, minuette wave (v) and minute wave v could be very strong upwards movements. If this is the case, then for this wave count it would take price comfortably above the final bear market trend line. If that happens, then this wave count would be the preferred wave count.
The hourly chart for this alternate today will show the same piece of movement as the main hourly chart.
Click chart to enlarge.
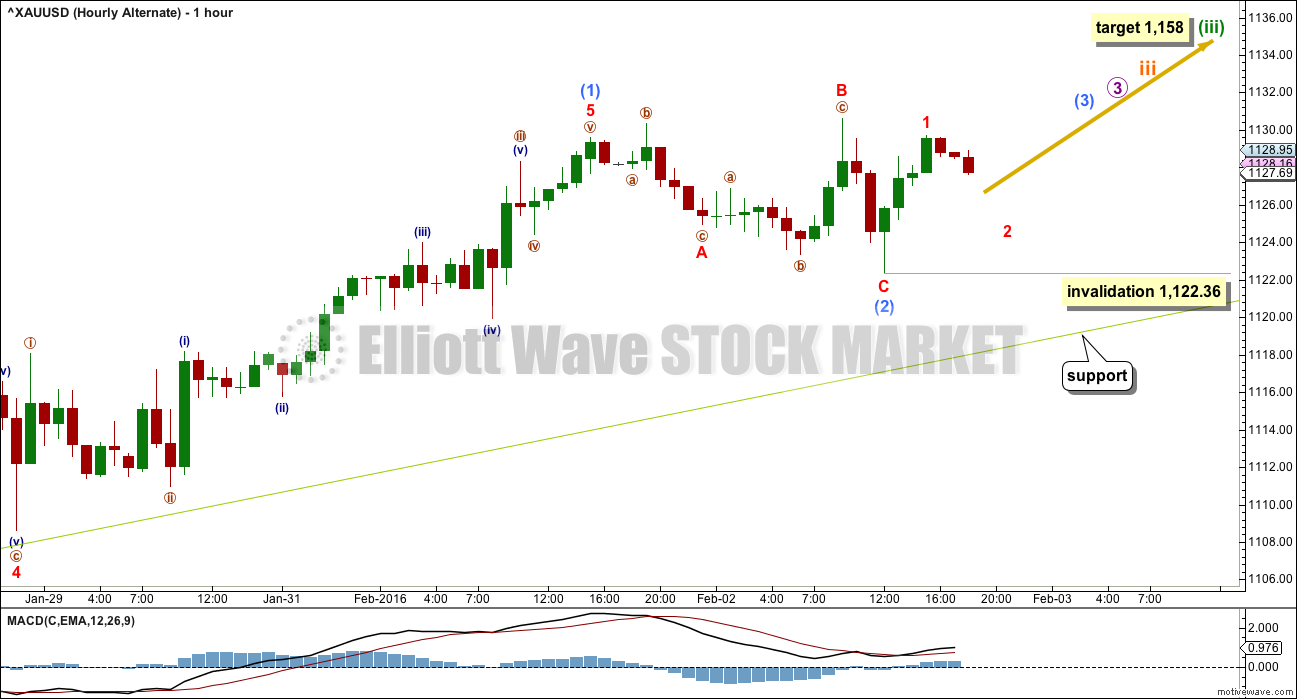
This bull wave count now expects that there are seven first and second waves complete within a big third wave up. This indicates a strong increase in upwards momentum ahead, if this wave count is correct.
While price continues to find support at the upwards sloping green line, which is the same on all daily and hourly charts today, the risk that this wave count is correct will remain.
However, we have no technical confirmation of a trend change for Gold from bear to bull. There is no confirmation that this wave count is correct.
At 1,158 minuette wave (iii) would reach 1.618 the length of minuette wave (i).
Minuscule wave 2 may not move beyond the start of minuscule wave 1 below 1,122.36.
If the green support line is breached, then the probability that price is entering the middle of a big third wave would be very low because the middle of third waves normally show an increasing slope, not decreasing.
TECHNICAL ANALYSIS
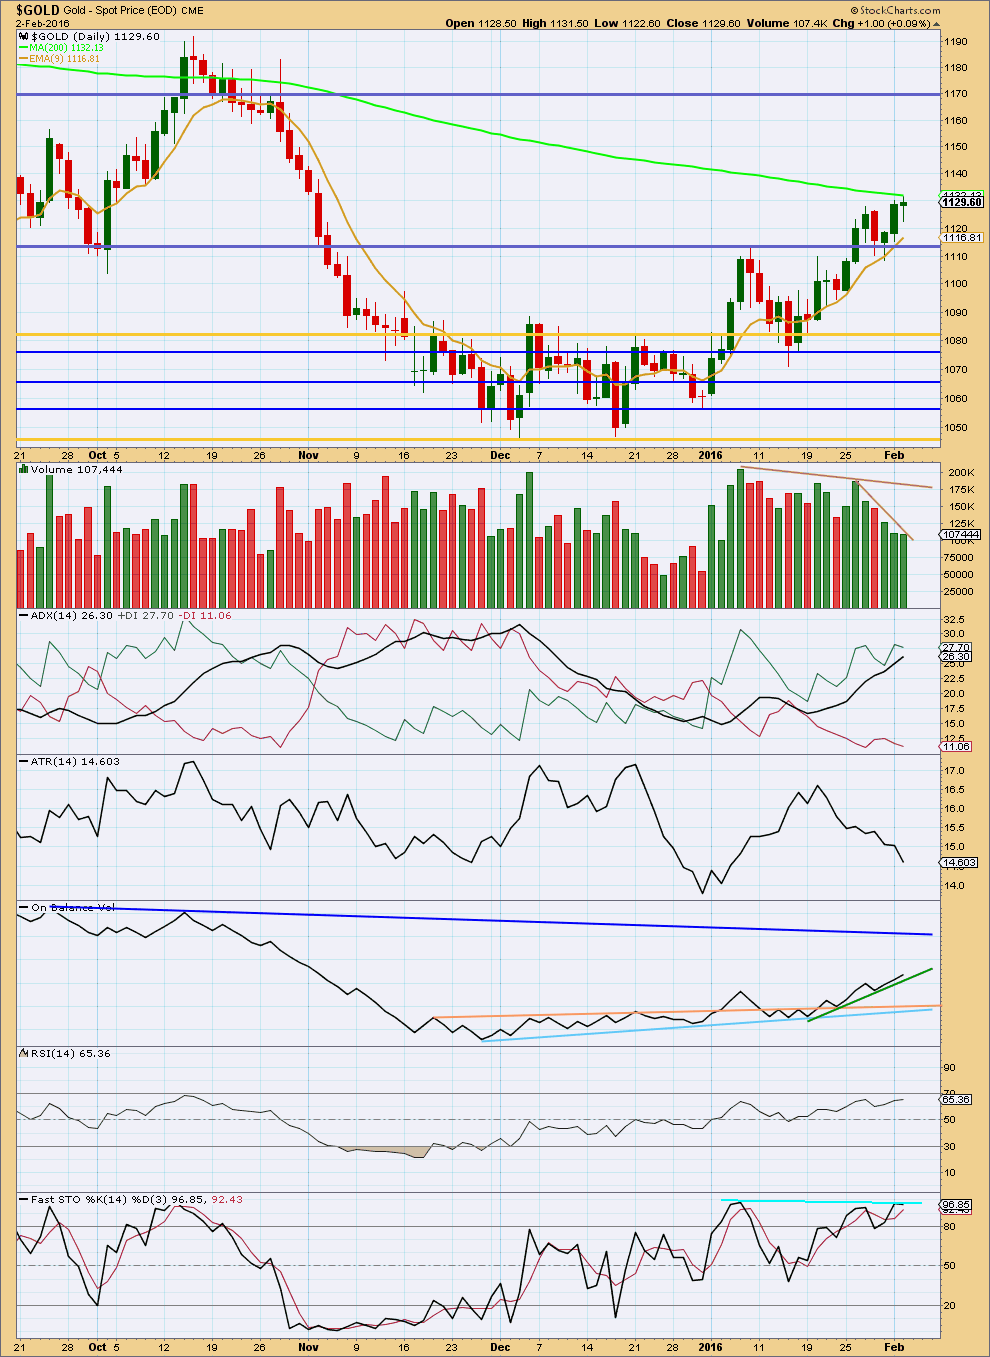
Click chart to enlarge. Chart courtesy of StockCharts.com.
Price has come up to touch the 200 day SMA today which should provide strong resistance.
The volume profile again strongly favours the main bear wave count. As price has made a new high, again it is not supported by volume as volume declined.
ADX and ATR continue to disagree. ADX indicates there is a trend and it is up, and price has been making higher highs and higher lows. But with ATR declining this is not a normal trend. This makes sense for the bear wave count; this upwards movement is the end of a correction.
On Balance Volume is still finding support at the green line. If that line is breached by OBV, it would support the main bear wave count. If OBV breaks above the dark blue line, that would support the alternate bull wave count. If OBV comes up to touch that dark blue line, it should first find resistance there.
RSI is not extreme and shows no divergence with price.
Stochastics still shows weak bearish divergence with price.
This analysis is published @ 07:48 p.m. EST.
Have not bought DUST yet…
Looking for a signal tomorrow at around 2:30pm.EST.
Bought a little DUST at the close at $10.31 a penny off the day low, couldn’t resist.
Dust dropped 21.22% today and XAU up 8.16%.
MACD for GDX was very high at 39, 78, and 195 minutes and day, week, and month all looking overbought.
2:14pm Dollar eyes largest daily drop vs. euro in 2 months
Dollar drop likely pushed gold up.
Lara might gold go up to 1158 now that gold went above 1135 and Cyan trend line up to 1145.63 today even though Cyan line not breached?
I’m thinking gold is due for a correction now even if gold might go to 1158?
Yes, that could happen. The alternate bull wave count is still entirely valid.
But the cyan trend line is overshot, not breached. And so the bull wave count is still not confirmed.
The bear wave count will remain the main wave count. We still do not have confirmation of a big trend change for Gold and the end of the bear market it has been in since September 2011.
Volume today will be really important. Gold often exhibits volume spikes at the end of its movements. If we have a sharp increase for today that may be it, at least for the short term.
For the bear we absolutely must see a red candlestick tomorrow.
The Midas Touch Consulting Report 02/01/2016
Feb. 3, 2016 10:16 AM ET
http://seekingalpha.com/article/3860286-midas-touch-consulting-report-02-01-2016
This is a strong overshoot of the final bear market trend line.
This has happened before, see the high labelled minute ii and then subminuette ii at the top left hand side of the main daily chart. Back in October 2015 that line was overshot by just over $8 and yet price turned down there to find new lows.
So it could be happening again.
For the bear this has to be it. Tomorrow must turn down back below that cyan trend line.
Draw a parallel copy of the final bear market trend line and place it on the high of minute ii at the top left of the main daily chart. That parallel copy is providing some resistance… so far. It too is now very slightly overshot.
The next few days will be crucial. Both wave counts remain valid.
The bear needs to see price turn down now. It needs a breach of the green support line for confidence that the trend has changed.
The bull needs to see today close with high volume . Momentum is increasing. So far so good. A full daily candlestick above the final bear market trend line would see the bull wave count increase in probability and then become the main wave count. If that happens then a third wave up would be very likely underway.
I guess if your own technical analysis strongly favours the bear wave count then you could argue there is a good risk / reward set up here.
But any entry at this point for any short positions is trying to pick a high.
If members want to do that it is your prerogative, but please manage risk accordingly. Don’t risk more than 3 – 5% of your equity on any one trade. Understand that the risk today is that the bull wave count could be correct.
Generally speaking picking highs and lows is not advised. It is safer to wait for a trend change to be confirmed before entering a position. It means you don’t get in right at the start of the trend, but it does reduce risk. And risk management is the key to successful long term trading.
Risk management is the most important thing.
GLD volume is 2.5 million above the 10 day average with 2 hours to go. $USD down big today. Not looking good for the Bears…
A blowoff top in the making! Beware bulls – gold has dropped every time it has flirted with the 200 day moving average. An RSI near/at 70 is no time to be long.
Agree with you. With price above the upper band and daily RSI close to tagging 70, time to take money off the table although Gold price appears to be basing off 1135… Look like more is in store for a test of 1147+, letting my Buy ride with stop at 1140 lol…….//// Just raised my stop!
If I draw a trend line on the weekly from 1796 to 1309, I see the last two weekly candles up the trend. I use chart from forex.com.
How is it possible ? Can you check on your chart? Thanks!!
GDX …XAU…and HUI have all exceeded Jan 7 high…
cannot be a retracement anymore.
Shorting here in my opinion is a great risk reward set up.
Not too sure if shorting here is a good idea. Expecting another drive through 1139-1141 for more… lets see lol… This is horrible for the bears!
Agree with MTLSD.
And to clarify for everyone, stops above are very close by so risk is easily managed, that is what I meant.
Almost a 5 down here from the top Matt?
If so, the 5th wave was truncated. At best, a deep 2nd wave is complete. However, it’s too early to tell if that’s what this is.
Yeah, I was on mobile and couldn’t quite see if we made that lower low for 5.
Thanks,
I bought dust today. Average around 11.60.
Bear wave count may be discarded now. Bullish COT came thru. Now wait for top ???
As Lara recommends wait for a full one day above the cyan line and not toughing daily bar.
True papudi…lara always shows right direction…
My sl for short got triggered at 1135..it was a bad chance… 🙁
Anyways waiting for a full daily candle nd than a throw back as said by laraa
waiting for confirmation – at a reasonable level
the trick is to stop yourself from feeling you’ve missed out, there will always be another opportunity
don’t aim to get an entire movement, aim to get the middle
you get in after a trend change has been confirmed, so you get in not at the price extreme
and you get out after it has been confirmed the trend is over, so you don’t get out at the other price extreme
much safer, less risk, so over time better profits
No.
the final bear market trend line is overshot, not breached.
this has happened before and price turned down to make new lows.
it can happen again.
Thanks Lara. So I should plan to take profit from my long gold stocks here???
James Flanagan update on Gold Gann cycle with promo. Skip to minute 3 marker.
http://www.gannglobal.com/webinar/2016/January/GGF-Promo/16-01-Video2-GGF.php
Today gold moved down this morning to a low of 1124.42 at 2:59 am then way up to 1133.14 at 8:25 am then even faster to multi month high of 1139.18 at 10:31 am.
This clearly shows increased strength and increased probability of the bull count. Now gold is right at the final bear cyan trend line and touching the 200 day moving average.
Which side of the Cyan Fence will gold get off on today?
Richard, 200dma at 1132 has been left behind. That has been a psychological barrier for quite some time now and it is not the first time Gold price has got above there only to fall hard….. Currently Gold price is flirting with the upper band pushing it up….I would expect a correction down but just wondering if Gold price will now drop to or below 1125…Lets wait for an update from Lara. Thanks
Gold now at 1,135.67 at 10:18 am and US markets switched from up to down since the open. Gold is showing increased momentum.
Gold is now at the final bear market cyan trend line.
A breakout is required as price is squeezed between the final bear market cyan trend line and a green short term support line on all charts.
A break and sustain above 1139 will likely open up 1146-47+….Good luck!
Gold just made another new high this minute.
Only took 1 1/2 hours for that to happen.
Bull Wave Count: if correct now indicates a strong increase in upwards momentum ahead. While price finds support at the green line the bull count may be correct but has no confirmation.
Hi. Richard. This looks to be setting itself up for Lara’s target of 1158+
IMHO Gold price has adequately tested 61.8% of H 1183-84 / L 1047-46 and appears to be currently basing off 1125, with 1122 and/or just below there holding, upside continuation of a further break above 1133 can be expected with no signs of topping seen just yet…. Time & Price will tell I guess. Good luck all, personally staying long on this….
Possible hourly update
The small channel on the hourly chart is breached.
If this next daily candlestick closes well into the body of the candlestick 2 days ago of 1st Feb we shall have an evening doji star candlestick reversal pattern.
I am still waiting.
When / if that green trend line is breached then it is fairly likely price will throw back to that line. If it does that I shall enter short there.
Until then I will exercise patience.
Thank u LARA.. 🙂
Agree with the volume profile
There is divergence between crude and oil from last few months…if crude is going down gold is moving upwardss…
For gold to confirm its alternate bull counts needs crude to keep falling from the levels…
Personally feels that for OIL somewhere 10% to 20% down from here some kind of global news will support crude prices for sure..
So GOLD to be in a middle of a strong wave 3 upwards seems lil doubtfull..
I will go short..
Risk reward ratio is very gudd.. 🙂
The risk is technically up to 1,191.37.
But in reality it is lower.
You must allow that it is possible for price to overshoot that bear market line. It has done that before by just over $8 and then turned down to make new lows.
That could happen again.
If you’re going to try and pick the high then good luck to you, but please make sure you manage risk to your account carefully.
Sure lara..
Thanks
Lara, it would seem ,from my reading of your analysis (with which I generally agree), that ,even if we get to 1135 or close to it , that the odds favor a turn back down toward new lows in gold. Let us say that the odds are 75% of a turn down ,.versus 25% of a break through 1135 and on up to new highs. If these are the odds (and that is what I give them) then one would favor a short position in here (with a mental stop above 1135 or so. My question How do you see the odds. ??
I would put the odds on turning down higher. Maybe 85%?
And it could overshoot the bear market trend line and move higher than 1,135 and still turn down.
And that is exactly why I’m stepping aside today and waiting. Only when I have some confirmation that the trend has changed am I willing to enter short. Because it could move higher for a bit here, because that bear trend line has been overshot before by over $8. That could happen again.
Thank you Lara, decided to sit this out for the evening . Nothing done.
Great clarity and strategy thanks.