
A break below a short term trend line on the hourly chart indicates a correction has begun.
Summary: The trend is still up, but a multi day correction looks like it has arrived. Choppy overlapping sideways movement may last a few days and end either within 1,174 – 1,164 or at 1,151.
New updates to this analysis are in bold.
Last published weekly charts with the bigger picture are here, with video here.
DAILY ELLIOTT WAVE COUNT
Click chart to enlarge.
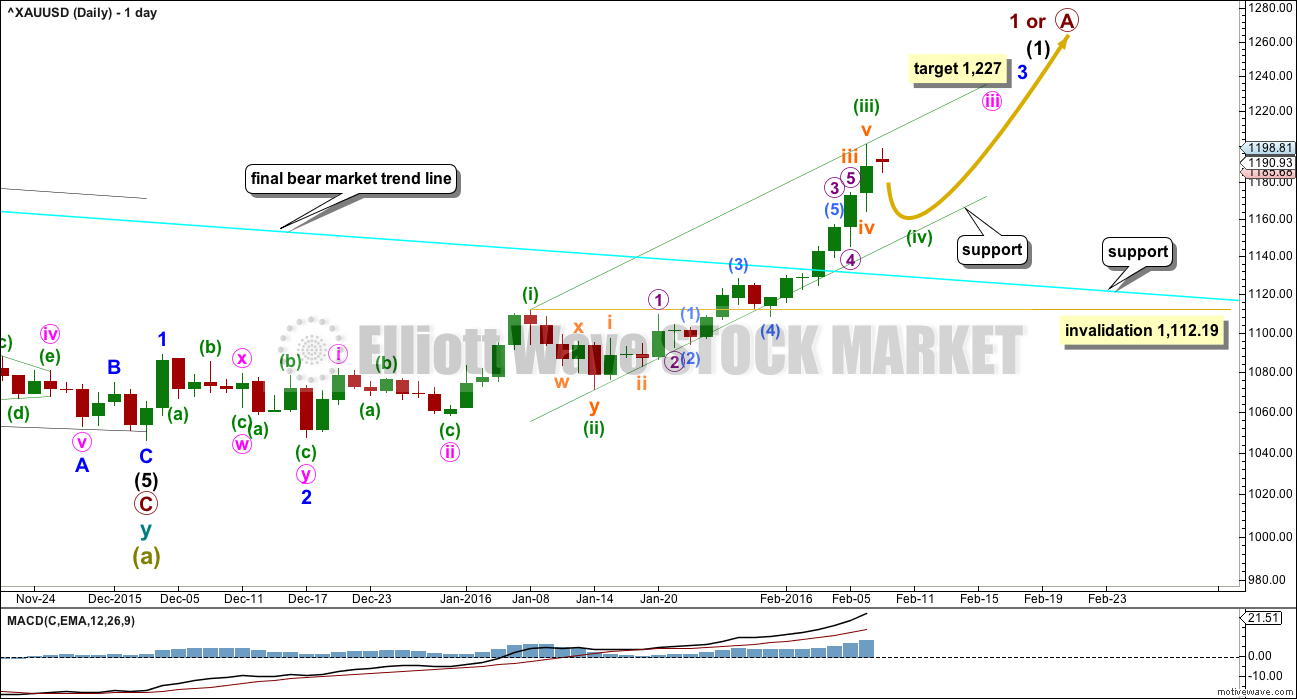
A new high above 1,191.37 has invalidated the bear wave count and confirmed that Gold is now in a bull market.
Super Cycle wave (b) may be any one of 23 possible corrective structures. First, a move of this size should have a clear five up on the daily and weekly charts. That is still to complete.
So far, within the first five up, the middle of the third wave is now most likely complete. The strongest move may yet be ahead. Gold typically exhibits swift strong fifth waves to end its third wave impulses. Look out for surprises to the upside for one or more of subminuette wave v, minuette wave (v), minute wave v, and minor wave 5.
At 1,227 minor wave 3 would reach 4.236 the length of minor wave 1. If this target is wrong, it may not be high enough. Minor wave 3 may not exhibit a Fibonacci ratio to minor wave 1.
Within minor wave 3, minute waves i and ii are complete. Minute wave iii is incomplete.
Within minute wave iii, minuette waves (i), (ii) and now (iii) are complete.
Minuette wave (ii) was a time consuming and deep double zigzag which lasted 4 sessions. Minuette wave (iv) should also be a multi day correction showing up clearly on the daily chart.
Subminuette wave iv was over within one session, lasting just 12 hours and very shallow. This is a typical tendency of Gold when fifth waves are swift and strong. When this happens fourth wave corrections are forced to be more brief and shallow, giving an impulse a slightly three wave look and ending with a sharp spike. Look out for this tendency again as minor wave 3 comes to an end in the next couple of weeks or so.
Draw a channel about the impulse of minute wave iii. Draw the first trend line from the highs labelled minuette waves (i) to (iii), then place a parallel copy on the low labelled minuette wave (ii). Minuette wave (iv) should find support at the lower edge of the channel. Copy it over to the hourly chart.
HOURLY WAVE COUNT
Click chart to enlarge.
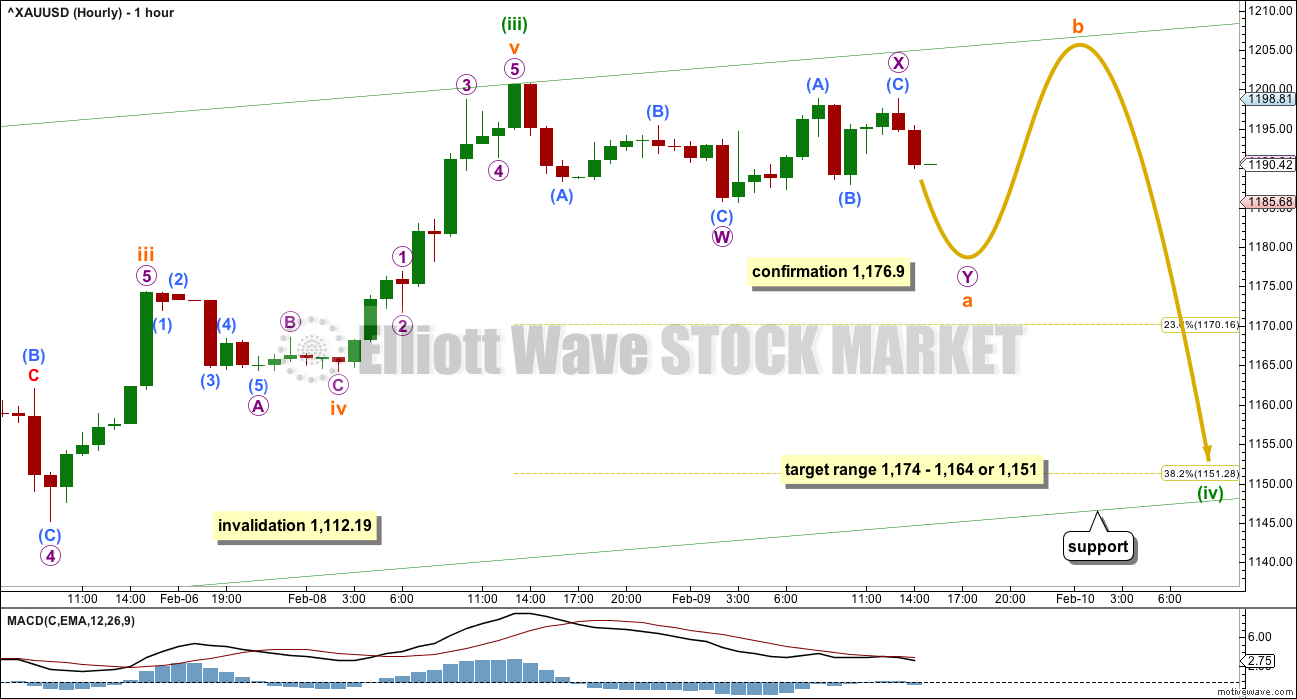
It is most likely today that minuette wave (iii) is over. The small red daily candlestick for Tuesdays session makes sense if minuette wave (iv) has arrived.
Minuette wave (iv) should exhibit alternation with minuette wave (ii). Minuette wave (ii) was a deep 0.76 double zigzag lasting four sessions. Minuette wave (iv) should be shallow. It is most likely to be a flat, combination or triangle. These structures tend to be more time consuming than zigzags.
There are two competing tendencies regarding the duration of minuette wave (iv). It may be forced to be more brief and shallow than otherwise, if the following fifth wave of minuette wave (v) is to be a typically swift strong fifth wave. But it may be longer lasting than minuette wave (ii) because sideways corrections tend to be quicker than zigzags.
At this stage, it is impossible to say how long it would last. It is extremely unlikely to be over today as upwards movement is subdividing as a three. It may be expected to most likely last a Fibonacci three or five sessions.
Minuette wvae (iv) may end within the price territory of the fourth wave of one lesser degree. Subminuette wave iv has its price territory from 1,174 to 1,164.
If minuette wave (iv) is a little deeper, it may end about the 0.382 Fibonacci ratio at 1,151.
Minuette wave (iv) may not move into minuette wave (i) price territory below 1,112.19.
At this early stage, there are 23 possible structures that this fourth wave may unfold as, so it is impossible to tell which it will be only that it is unlikely to be a zigzag or zigzag multiple. That leaves a likely 20 structures. The labelling within it will change as this correction unfolds, as the structure becomes clearer. The focus cannot be on what pathway price may take during the correction; the focus must be on identifying when it is complete.
If minuette wave (iv) is an expanded flat, running triangle or combination, then it may include a new high above its start at 1,200.67. A new high does not mean this correction is over. There is no upper invalidation point for this correction.
Corrections are not good trading opportunities. They present an opportunity to join the trend when they are complete.
TECHNICAL ANALYSIS
Click chart to enlarge. Chart courtesy of StockCharts.com.
This section of the analysis is updated at 12:19 a.m. EST on 10th February, 2016.
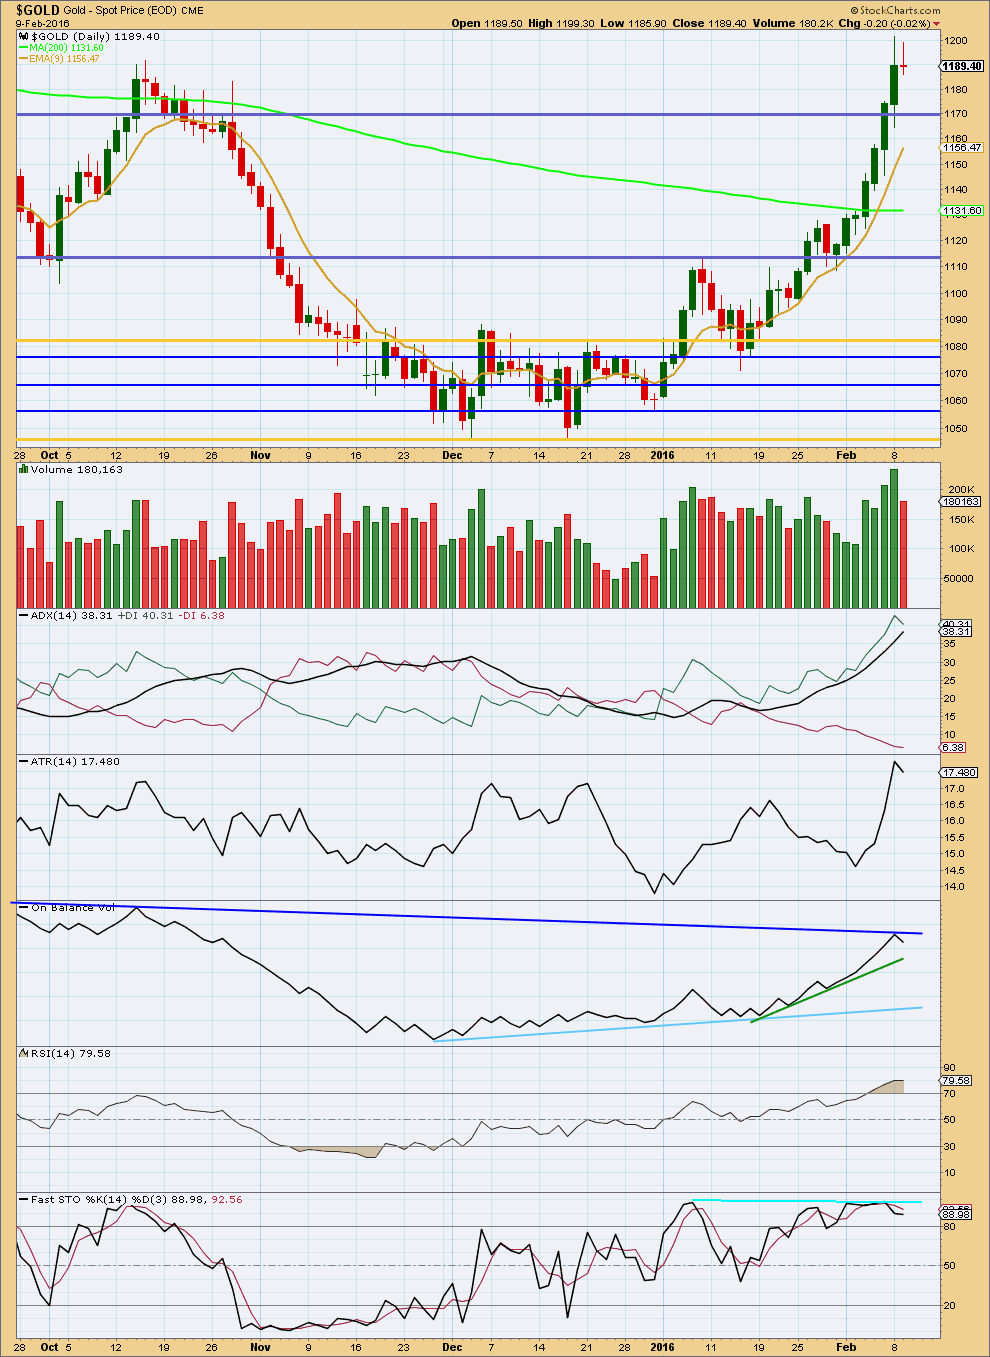
A red doji on lighter volume strongly supports the Elliott wave count in expecting a period of consolidation.
Price has made a major new high above the prior major high of 15th October. Price is above the 200 day moving average. The final bear market trend line has been substantially breached. It is reasonable to expect now that Gold has had a major trend change and is in a bull market.
Volume increased as price moved higher. Now as the first red candlestick appears in several days it comes with lighter volume. This supports the idea that the trend is up.
ADX is still increasing and indicates there is an upwards trend. Overall ATR is also increasing and is in agreement.
On Balance Volume has found resistance at the upper dark blue line initiating a turn down from price today. OBV may find support initially at the green trend line.
This consolidation may return Stochastics and RSI from oversold, so it should take a few days to manage that.
This analysis is published @ 04:01 p.m. EST.
SOMEBODY CORRECT ME IF I AM WRONG. Since we dropped this morning down to 1181 and are now in 1196 to 1197 area , I assume this is the b wave of this 4th wave correction down and that we will now (tonight and tomorrow enter a c wave down to maybe 1173 to complete this 4th wave correction . Then we should start a fifth wave up to the 1127 area target . Therefore ,I am now short April gold looking for maybe 1170’s . What say you Lara or anyone else.? Thank you.
It does look like the B wave. But because A subdivides as a three B needs to be 90% minimum of A. That is at 1,198.77 so a little more upwards movement yet. It could make a new high.
And yes, then C down is still needed.
will c subdivide as a 3?
Don’t know your strategy if you think gold will go down to 1170 in April for gold or just looking to sell it within the next week?
Lara’s weekly chart shows gold at $1,600 not sure if timing is right at around May 2016?
Lara, do you still think the target range is still the same?
“Subminuette wave iv has its price territory from 1,174 to 1,164.
If minuette wave (iv) is a little deeper, it may end about the 0.382 Fibonacci ratio at 1,151.”
Gold turned up so fast at 10:33 am that I didn’t buy in yet.
That may have something to do with the US Fed Chair Janet Yellen live talks started at 10:00 am EST as gold dropped fast from 9:51 to 10:33 am. She talks again Thursday.
Yes, the range will still be the same.
At this stage I can’t calculate a target for the correction to end using the ratio of A and C within it, because B isn’t done so I don’t know where C starts.
I may be able to do that tomorrow.
Richard:
Excluding TA portion this EW analysis report must be the shorted report???
But cycle wave b is more difficult to analyse going forward.
Hi Lara,
The day’s question….
Do you think that now we are in b wave developping in zigzag or wave 4 could be finished?
Unlikely to be a Zizzag.
“At this early stage, there are 23 possible structures that this fourth wave may unfold as, so it is impossible to tell which it will be only that it is unlikely to be a zigzag or zigzag multiple.”
Minuette wave (iv) should also be a multi day correction showing up clearly on the daily chart… It may be expected to most likely last a Fibonacci three or five sessions.
It was the wave b of the wave 4 i was refering to
The up from the min at 1181 is it a b wave ( zigzag) of 4 or is the beginning of minuette wave 5?
Wave a looks like it was a double zigzag.
So this fourth wave looks most likely at this stage to be unfolding as a flat or triangle.
Wave b should move price higher. Then if its a flat wave c should move price lower, if its a triangle then sideways movement in an ever decreasing range for a few days.
And that may change, this structure may yet morph into something else.
But at this stage a zigzag looks most unlikely.
Has The Gold Bull Market Finally Returned?
Elliott Wave – Avi Gilburt February 9, 2016
http://www.gold-eagle.com/article/has-bull-market-finally-returned
Cup and handle or inverted H&S may form before a move higher
Cup and handle already made before…
The low from 1100 to 1060 is handle and can clearly be seen..
Breakout was huge we already saw it..
Post on $HUI index
http://www.gunner24.com/newsletter-archive/february-2016/07022016/
Hi, I’m new and just orienting myself to the charts on display here.
On the hourly wave count chart it says ‘confirmation 1,176.9’ close to the “Y”. What does ‘confirmation 1,176.9’ mean/what will that price confirm?
Secondly, (directly above the hourly chart) there are instructions on how to draw a channel which must then be copied over to the hourly chart. What time frame should be used to draw the channel before copying it over to the hourly chart? Can this be done in MotiveWave by simply changing the period to hourly after drawing the channel?
Thanks.
The confirmation point was from the prior main hourly wave count. I really should remove it now as I’ve discarded that other wave count.
The confirmation point was the invalidation point for the other wave count, that one expected the upwards trend to continue. It would have been invalidated by price below 1,176.9. But I’ve discarded it on the basis of yesterdays red candlestick.
Draw the channels on the daily chart always on a semi log scale. If you’re using Motive Wave then when your daily chart is correct create a new analysis based on it, change the time frame to hourly and the scale to arithmetic.
If when you open a chart you cannot see the anchor points of a line or channel you will need to compress the view (bottom left hand corner on chart, click the compression arrows several times) so that it can see the anchor points, then expand the view back out. This will ensure the lines sit correctly.
Lara thank u..
Please let us know when you are getting long after the correction.. :)..
Will do
The regular technical analysis is now updated. Thank you all for your patience.
Nothing changes. But it does strongly support the Elliott wave count and so we may all have more confidence today in it.
… Gold price is showing weakness below pivot with the upper band and daily RSI tagging 80 to contend with; lucky to see a break through and above 1196-98; probably better off waiting for a downturn break below 1188 for 1184-83/78…. Tempted to take a scalp sell lol….
NUGT is outperforming JNUG so far in the move up from the bottom. Normally you would expect JNUG to outperform. I think the reason that NUGT is moving up faster is because many of the large miners in NUGT were beat down dramatically during the bear, in part due to their high debt levels, that they are experiencing a sharper rebound. We may see this reverse in the future as this move up continues with JNUG starting to outperform NUGT. Both are likely going much higher over the coming months.
Only 2 wave count charts, it’s a miracle! LOL