
Last week again expected downwards movement from Oil.
Oil made a new low, and so far has made a lower high.
Summary: There is only one wave count today which expects a fifth wave is extending. The first target is 14.02. The second target is 11.98. Corrections are finding resistance at one of two trend lines which provides a good guide for entry points to join the trend. Risk with the wave count is limited to 33.60.
New updates to this analysis are in bold.
MONTHLY ELLIOTT WAVE COUNT
Click chart to enlarge.
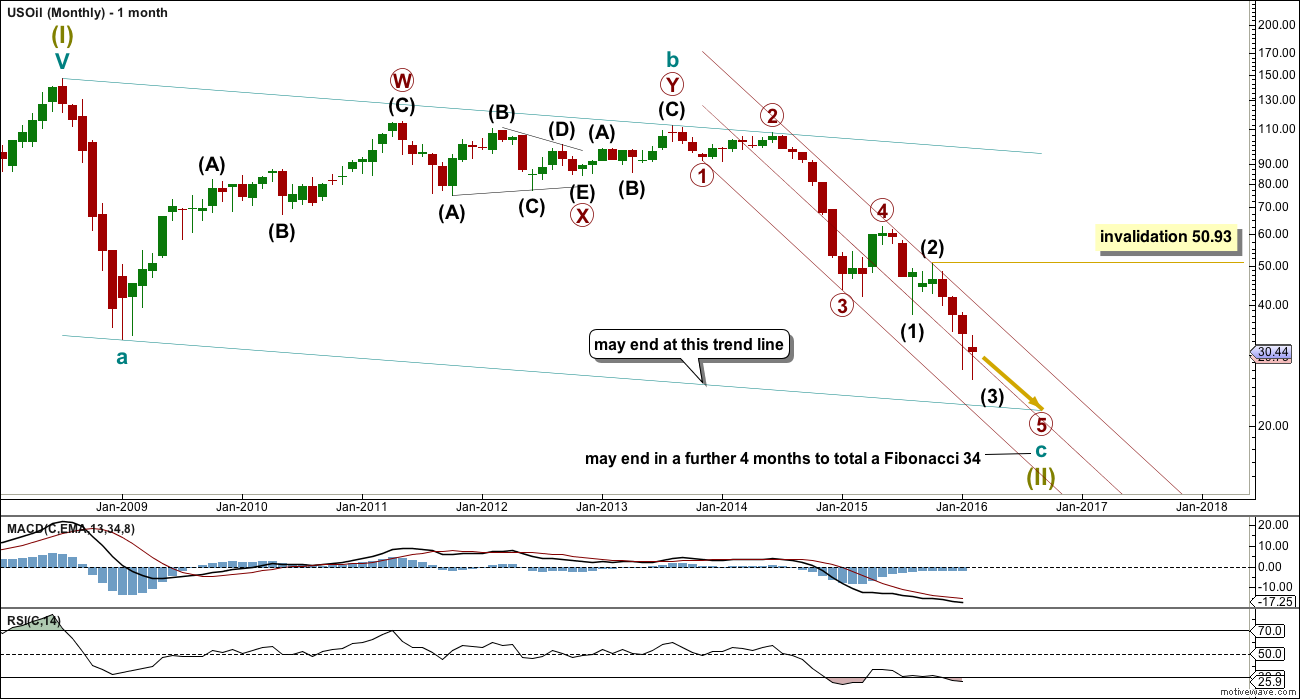
US Oil has been in a bear market since August 2013. While price remains below the upper edge of the maroon channel drawn here and below the 200 day simple moving average it must be accepted that the bear market most likely remains intact.
The structure of cycle wave c is incomplete.
This wave count sees US Oil as within a big super cycle wave (II) zigzag. Cycle wave c has moved below cycle wave a at 32.70 avoiding a truncation. At this stage, as soon as the structure for cycle c could be seen as complete an alternate wave count expecting an end to the Oil bear market would be published. That cannot be done yet because the structure is incomplete. Primary wave 5 has to unfold lower.
When the structure is complete and an alternate bull wave count is published, then it would come with the strong caveat that it is an alternate until there is technical confirmation of a trend change. That confirmation would be a breach of the maroon channel or a break above the 200 day moving average, or both.
Within cycle wave c, primary wave 5 is expected to be extended which is common for commodities.
No second wave correction may move beyond the start of its first wave above 50.93 within intermediate wave (3).
Draw a channel about this unfolding impulse downwards. Draw the first trend line from the lows labelled primary waves 1 to 3, then place a parallel copy up not the high labelled intermediate wave (2), so that all movement is contained. Add a mid line. Copy the channel over to the daily chart.
The wider teal green channel is drawn about this whole correction. Cycle wave c may end when price finds support at the lower edge of this channel. But sometimes these channels are breached by C waves, particularly if the C wave has a swift strong extended fifth wave to end it. How price behaves when it gets to the lower teal trend line, and how complete the structure is at that stage, will indicate if price may stop there or if it would continue.
MAIN DAILY ELLIOTT WAVE COUNT
Click chart to enlarge.
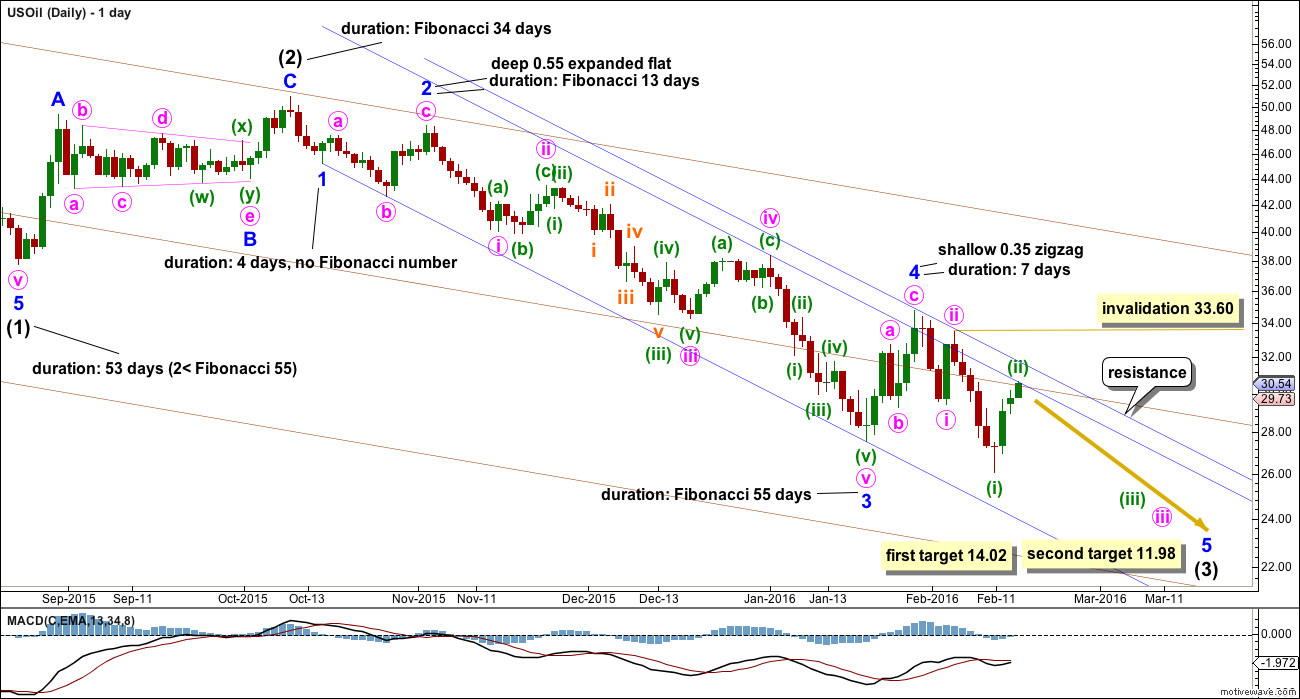
The two daily alternate wave counts from last week no longer make sense. Minor wave 4 is extremely likely to be over and does not look like it is continuing as a triangle. This main wave count is now the only wave count at the daily chart level for Oil.
Within intermediate wave (3), minor wave 3 shows an increase in downwards momentum beyond that seen for minor wave 1. But intermediate wave (3) has not yet seen an increase in momentum beyond that seen for intermediate wave (1). A further increase in downwards momentum should be expected.
Minor wave 2 was a deep expanded flat which lasted a Fibonacci 13 days. Alternation between minor waves 2 and 4 should be expected. If minor wave 4 is over now, then it would be a shallow zigzag lasting 7 days, one short of a Fibonacci 8. This gives the wave count the right look and provides perfect alternation in both structure and depth.
Within minor wave 4, minute wave c is just 0.38 longer than equality in length with minute wave a.
Minor wave 4 has slightly overshot the channel which is drawn using Elliott’s first technique. This is another indicator that it is likely to be over.
Create a parallel copy of the upper edge of the dark blue Elliott channel and place it on the high of minor wave 4. This trend line is providing resistance.
Typical of commodities, US Oil often will exhibit very swift strong fifth waves. That means that the strongest part of downwards movement may be ahead, and this tendency is particularly strong for fifth waves to end third waves.
At 14.02 minor wave 5 would reach equality in length with minor wave 3. At 11.98 intermediate wave (3) would reach 1.618 the length of intermediate wave (1). The next target is now at 14.02. If that target is met and passed, then the next target would be 11.98.
Minor wave 1 lasted 4 days (not a Fibonacci number). Minor wave 3 lasted exactly a Fibonacci 55 days. Minor wave 5 may last a total Fibonacci 55 days. (Note: I am counting only trading days and not calendar days).
When waves extend in price they also necessarily extend in time. When waves extend they show their smaller subdivisions clearly at higher time frames. Within minor wave 5, minute wave ii is clear, again finding resistance at the upper parallel copy of the Elliott channel.
Now, within minute wave iii, another deep correction for minuette wave (ii) shows up clearly. This indicates that minute wave iii is extending. Minuette wave (ii) may find resistance here at the first dark blue line, or it may yet move a little higher to find resistance at the next dark blue line. It may not move beyond the start of minuette wave (i) above 33.60.
When fifth waves of commodities extend, then within them the middle, the third wave, is most often the longest and strongest movement. So far this wave count follows the most typical tendencies for a commodity. It has a good probability.
TECHNICAL ANALYSIS
DAILY CHART
Click chart to enlarge. Chart courtesy of StockCharts.com.
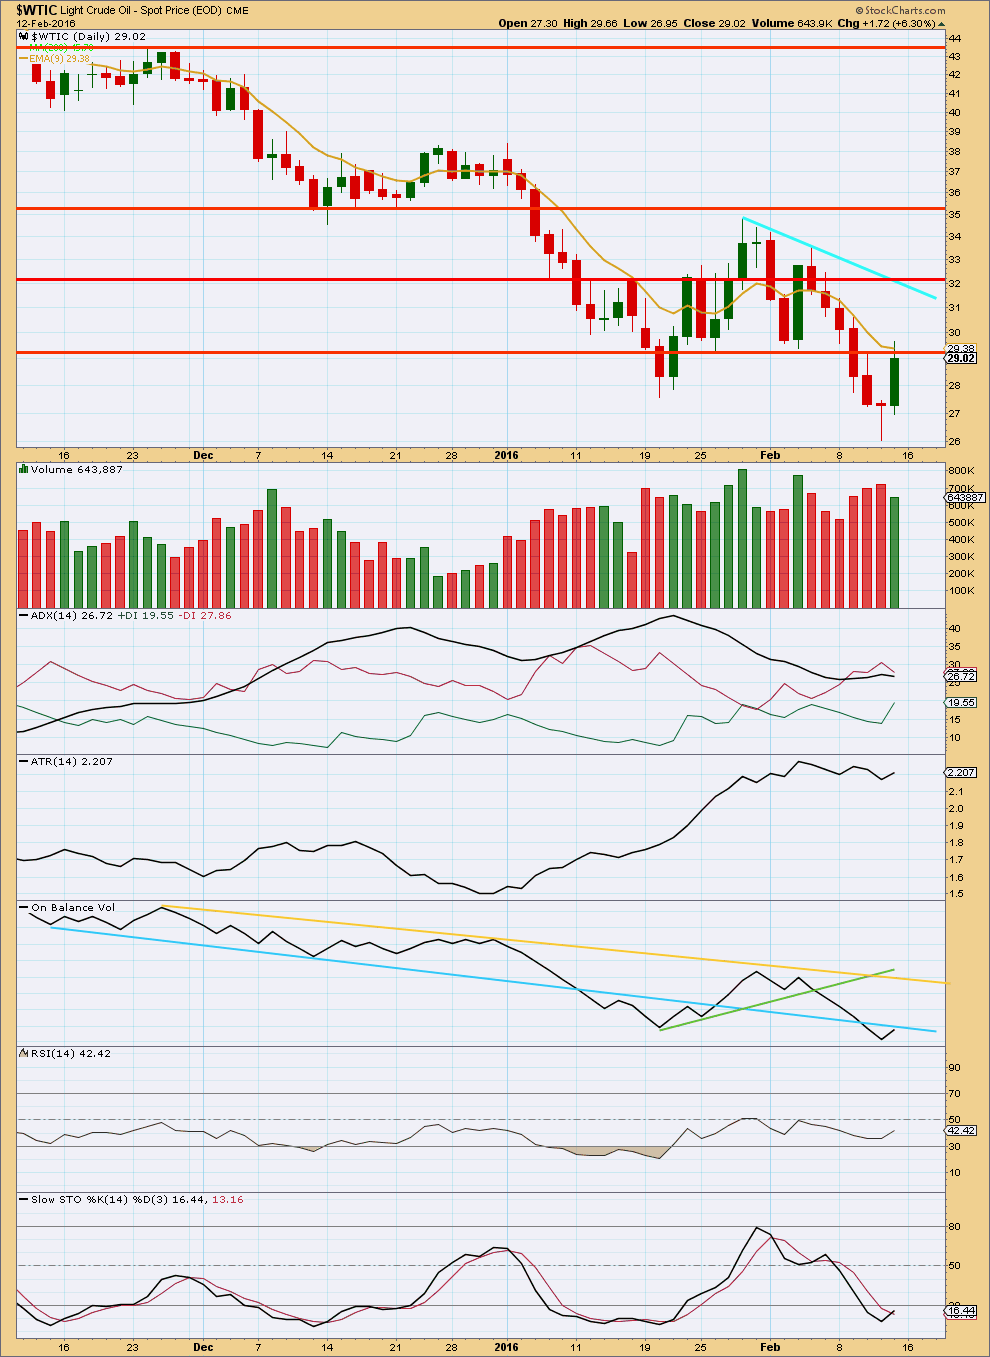
Upwards movement comes with declining volume. The rise in price is not supported by volume. This upwards movement should be considered as very likely to be a correction against the trend. FXCM data for volume for the 12th and 15th of February (not available on StockCharts) shows two more upwards days on strongly declining volume.
The prior fall in price came on clearly increasing volume. The volume profile is clearly bearish. This supports the Elliott wave count.
This upwards movement should be expected to end here or very soon.
ADX is no longer indicating a downwards trend. The last two corrections which have been deep have caused the ADX line to turn downwards. It is now flat. ADX is a lagging indicator.
ATR is also flat indicating no trend.
On Balance Volume broke below the light blue line and came up to test it. When data for 15th February is included, then this line is probably breached. The next line to offer resistance for OBV may be the yellow line.
RSI exhibits some divergence with price at the last low and the low of 20th January. This indicates some weakness in price and is bullish. However, in my experience this divergence sometimes does not precede a trend change but sometimes disappears and the trend continues.
Overall, the volume profile is a stronger bearish indicator than other technical indicators. Overall, this analysis is more bearish than bullish, but there is enough bullishness in it to warrant caution. Any short positions here should be carefully managed to limit risk.
This analysis is published @ 07:19 p.m. EST.
Yes. The wave count is invalidated.
Minor wave 4 must be continuing.
I had not charted that idea because I had judged it to have a very low probability.
Sometimes low probability outcomes occur. When they do, they’re necessarily not what was expected. Because they were low probability.
Oil will be updated today. Minor 4 may be either a running triangle or an expanded flat.
The third idea would see minor 4 complete as a zigzag as labelled and minor 5 an ending diagonal. That too had a low probability because this is a fifth wave to end a third wave within a commodity. They’re much more commonly long, swift and strong.
No i dont think this is invalidated…it is futures trading above 33.6…but its 2$ premium we got at expiry…i think if thers spot char available..we are still at 32$
Wave count got invalidated/
Dreamer
Thanks. To trade these commodities etf smart way is to know when the rollover happen and then make the trades.
We will see if price of DWTI/SCO will get affected today????
Last three days it did not.
Do you know when the rollover from current month is schedule????
Now the question is same as yours to Lara:how does this affect the wave counts???
From what I can see, the prospectus doesn’t say exactly when. I do however, remember looking at the Velocity shares link shown below a couple of weeks ago and at the bottom where the orange circle is, it will show when they start to rollover to the next months futures. They don’t do it in one day. I think it will be in about 2 weeks. I plan to track it this month so I will know for sure.
What is the price effect on leveraged etf when US oil future contract expires to next contract month?
I can speak some for DWTI as I have been trading and studying . The prospectus is 190 pages. You can find it here: http://www.velocitysharesetns.com/dwti
In brief, DWTI is not based on spot price. It is based on futures; however, there is a correlation between spot and futures. DWTI is already 100% in April futures, so no affect with current expiration. DWTI will be affected in the next couple of weeks when they start the rollover to May contract. Contango will negatively affect DWTI at that time during rollover. I think they slowly roll to the next month’s contract over a few days.
US Oil gap up?????
Oil traders may like this short video of the last 100 years of oil boom and bust cycles
https://shar.es/14S4nc
Nice clip!!!
Just a chart update
I have a short term trend line I’m watching for Oil. When this line is breached by a full daily candlestick then I’ll be watching and waiting to see a throwback. If price does that I’ll enter short with a stop just above the last swing high.
If it all works out like this then it should be a good low risk entry for a short.
Patience. This may take a few days to set up.
Lara, thank you for the update and congrats on your new credentials! It’s great that you invest in yourself for the benefit of your members.
P.S. I was just reading through the FAQ’s as I do occasionally and noticed that the answer for this “Q. Why don’t you provide entry and exit points?” may need an update to reflect the improved guidance that you can now choose to provide.
I may have jumped the gun here but on my hourly chart (linear) I’m showing your trend line as already breached with a partial re-test. I’m short but with a reasonably tight stop.
Lara, I would like to add my congrats for your new FA qualification. I hope you don’t feel under pressure to always provide trading recommendations. The Elliott analysis is the most important thing and, as you rightly point out, people should already be experienced traders to make best use of it.
I hope some of your subscribers don’t see it as a ‘magic bullet’ and passport to riches. As we both know, there ain’t no such thing. Inevitably, a portion of trades will go wrong but there should be no need for you to apologise or justify your decisions in any way. I hope people will understand that that’s just the way it is.
Lara, how does a $2.00 gap up due to futures rollover affect the EW count? Looks like the main count is invalidated with a trend line breach.
Here’s another look at the daily level. Stockcharts went from Mar to Apr contract from Feb 17 to Feb 18
Stockcharts has problem. You are correct the price may be because of change in near month contract.
But the chart label indicates it is spot price not near month contract. So there should be no difference.
I wrote them yet they have not corrected the chart.
Besides the short ETFs are behaving with spot price.
The daily chart by Stockchart says it is a spot price not the nearest contract.
I have fired an e-mail to stockchart to correct the chart data and the chart for wtic.
It explains now that this is roll over to next month contract.
I see it too. It should be the spot price / cash.
But my FXCM data doesn’t show that. And my CMC data doesn’t either.
Weird.
I think something is going on with StockCharts data there….
Lara, Many many congratulations to become Registered Financial Advisor.
Thank you!
Looks like the EW count is on track with a complete ABC for Minuette wave 2.
I am already short oil
But a new low risk position is when oil closes below 29.75.
Oil is still above the blue line.
Lara, any thoughts on Danerics count? Hard to tell as he doesn’t show detail, but looks like he expects more up for a 4th wave. These were his comments “Playing around with long term oil count for bow. Its hastily put together but it doesn’t change the medium term wave pattern. Lots of long term alts.”
It looks pretty much the same as my long term count on the monthly chart. I have my cycle b where he has his alt b.
I have primary 1-2-3-4 where he has 1-2-3-4.
And within primary 5 we both have intermediate (1)-(2)-(3)-(4) in pretty much the same place.
I think I’m labelling everything one degree higher… not sure. I’m not familiar with his labelling for the different degrees.
So it seems we both agree.
Oil price at 5:24 AM EST at FINVIZ is 33.58.
https://finviz.com/futures.ashx
But on PM bull oil price is 31.24.
Which one is correct???
I have never used fin viz, but it appears incorrect. Multiple sites I use agree with PM Bull.
Oil price on Trading View is 31.04, PM Bull is 31.04, but on plus500 (my trading platform) is 33.32. I am quite new to this and it makes it all rather confusing.
Depends on which contract. March or April
http://www.cmegroup.com/trading/energy/crude-oil/light-sweet-crude.html
Thanks Amr
Critical point.
Volume is declining for the last 3 up days, suggesting this may just be a corrective move.
Today’s surprising up swing has me wondering if we might already be well into minor wave 5, unfolding as an ending diagonal. Any thoughts on this?
Yes, that is possible and now I need to chart it.
For now the upper trend line is still holding. While that holds the main wave count should be expecting an extended fifth wave because that is the most common tendency for a commodity.
It is all an exercise in probability. We should expect the most likely scenario, and when that proves itself to be wrong then we move to the next less likely scenario.
Lara: At target 14 that is end of int wave II?
You mean Int wave 3? I think yes, that’s right.
johno
I meant cycle wave ( II) on monthly chart.
It’s the target for intermediate (3) within primary 5 of cycle c.
It’s not the final target for cycle c. I don’t have a target for that yet. I can’t calculate it until primary waves 4 and 5 are complete.
A calculation based on cycle a and c yields either a target which has been passed (41.77) and yet the structure is incomplete. A target for cycle c to reach equality with cycle a yields a negative target which is impossible. So the target must be calculated at primary degree.
US Oil bounced off important support. It needs to break below 25.
Long term weekly chart.
Watching the trend line
Lara, have you consider the posibility that we are still in minor wave 4, and that minor wave 4 is an expanded flat going a lot higher?
That makes a lot more sense considering the bullish tone of the overall market, plus the bullish weekley hammer candle we had on oil last week.
Not to mention the OPEC oil production agreement between Saudi Arabia, Venezuela, Rusia and Quatar.
Seems hard to see it colapsing hard to $14 dollars in the short term in a minute wave three kind of scnenario.
Just a thought.
Thanks
Yes I have considered it.
That would see no alternation between minor waves 2 and 4, both would be flats.
Even if minor 4 were to be a triangle the problem then would be the duration. It would be so much longer in duration than minor 2 they would be disproportionate. It is possible but I expect it has a low probability.
The weekly candlestick for last week is not a hammer.
For it to be a hammer the lower shadow would have to be at least twice the length of the real body. That shadow is only 1.56 times the real body.
“Japanese Candlestick Charting Techniques” second edition, by Nison, page 34.
The long lower shadow is bullish, but it is not a hammer so it is not a reversal pattern.
The “agreement” was a disappointment. The market was looking for a cut in production. Volume has declined for the last two day up move and today we have a gravestone doji. Seems to give an edge to the bears.
Thank you for update on OIL
Suppose if 33.6 is breachd than does that scenario means we are still in minor 4 correction..??..
Minor 5 is not at all complete…
At this stage that would be the only explanation I could see, that minor 4 would be continuing.
It would mean the minor 4 would breach the channel and would be much longer in duration than minor 2. Which is why I expect it has a low probability.
If we are experiencing another 2nd wave, Minuette 2, then I would expect that it ends at or before the trend line resistance. It is already longer than Minute 2. If we go higher, then I think other options need to be considered. We should know within the next few hours.
Lara, I’m somewhat dubious as to see that the last minor wave 4 took only 7 days -compared to the 13 days that minor wave 2 took to unfold. Aren´t waves 4 to last longer in time compared to waves 2 (at least on the same degree)? In addition, I guess if minuette wave 2 retraces beyond minuette wave 1, then we could be witnessing an expanded flat minor wave 4, still unfinished – do you see such as a possibility?
You’re right, I think we typically think of 2nd waves as zig-zags being the most common and 4th waves being flats or triangles. That said, when the second wave is a flat, I don’t think its unusual that the 4th wave is a quick zig-zag. These sharp rebounds are common after a sharp decline. Look at Minute 5 of Minor 3, it was an extended 5th wave. If we go above 32 though, I think we need to look at other options.
The most common situation is a second wave is a zigzag and a fourth wave is a sideways type of structure (flat, combination or triangle).
But in this case the second wave was a flat.
The fourth wave was a zigzag.
A zigzag is a quicker structure than a flat.
7 and 13 are reasonably in proportion. Overall on the daily chart the wave count has the right look with these two.
What would not have the right look is if 4 is continuing. So far it would have lasted 20 days and it would require many more… if it is to be a triangle.
Or it could be a flat. Then it would be much longer in duration than minor 2 and it would be the same structure. No alternation in structure. That is possible. But less likely.
I am entering another short here with my stop just above 33.60.
When I set my stop I take the price point I wish to set it at and add 3X my trading platform’s normal spread. So that I’m not stopped out in times of high volatility when the spread widens.
I’m only going to risk just less than 5% of my equity… and I’ve calculated that figure based upon all my trades open at this time having losses (if it all goes against me). So my current account minus potential losses of all open positions.
Thanks Lara. Sounds good plan to me. We have to wait for NYSE to open.
Lara, you wrote: “When I set my stop I take the price point I wish to set it at and add 3X my trading platform’s normal spread. So that I’m not stopped out in times of high volatility when the spread widens.”
I’m not sure I understand this. I think it’s the word “spread” that’s confusing me. Do you mean the spread between highs/lows for a given time frame? Spread between bid/ask? Something unique to your particular trading platform? Or something else?
I’d appreciate any more clarity you’re willing to give on this.
Thank you in advance!
I mean my brokers spread between bid / ask.
Got it. Thank you!