
Upwards movement was expected from yesterday’s analysis.
Summary: Upwards movement is most likely a B wave within an expanded flat. Downwards movement is expected to a target at 1,224. A new low below 1,266.69 would confirm that the correction is not over. Alternatively, upwards movement may be a third wave within an extended fifth wave, with a target at 1,350. This has a lower probability, but the probability would increase above 1,293.
New updates to this analysis are in bold.
Last published weekly chart is here.
MAIN ELLIOTT WAVE COUNT
Click chart to enlarge.
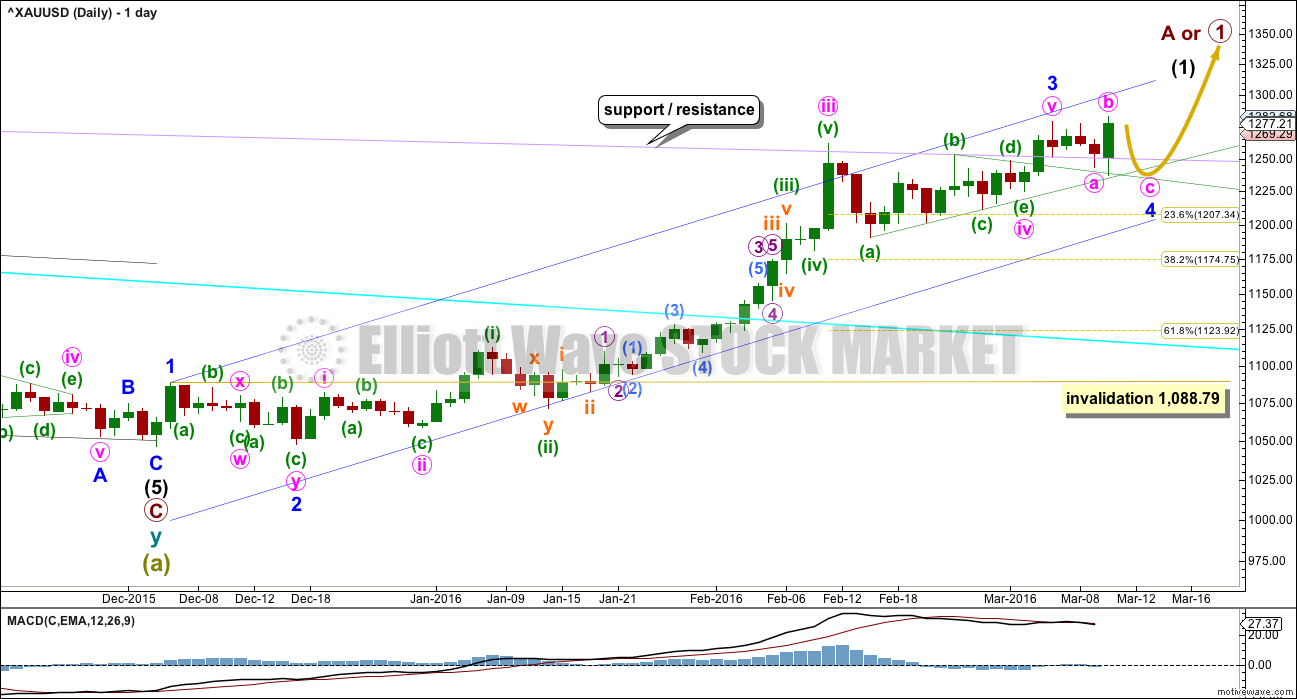
Gold has very likely changed from bear to bull.
So far, within the first five up, the middle of the third wave is now most likely complete. The strongest move may still be ahead. Gold typically exhibits swift strong fifth waves to end its third wave impulses. Look out for surprises to the upside for minute wave v and minor wave 5.
Friday’s upwards movement may have completed minor wave 3.
Ratios within minor wave 3 are: there is no Fibonacci ratio between minute waves iii and i, and minute wave v is just 0.07 short of 1.618 the length of minute wave i.
Minor wave 2 was a very deep 0.97 double zigzag lasting nine days (one more than a Fibonacci eight). Given the guideline of alternation, minor wave 4 may be expected to be a longer lasting sideways structure such as a flat, combination or triangle. It may last a Fibonacci thirteen days most likely. If it is a triangle, it may take longer, perhaps a Fibonacci twenty one days.
Minor wave 4 may end within the price territory of one lesser degree. Minute wave iv has its range from 1,261.94 to 1,190.9. The most likely target for minor wave 4 would be the 0.236 Fibonacci ratio at 1,207 as it lies within this range.
The triangle trend lines now cross over on 10th March. A trend change may be seen on this date. It does not have to be the end of minor wave 4. It may only be the end of minute wave b within it.
The last two daily candlesticks found support at the upper triangle trend line. This may continue to provide support.
Click chart to enlarge.
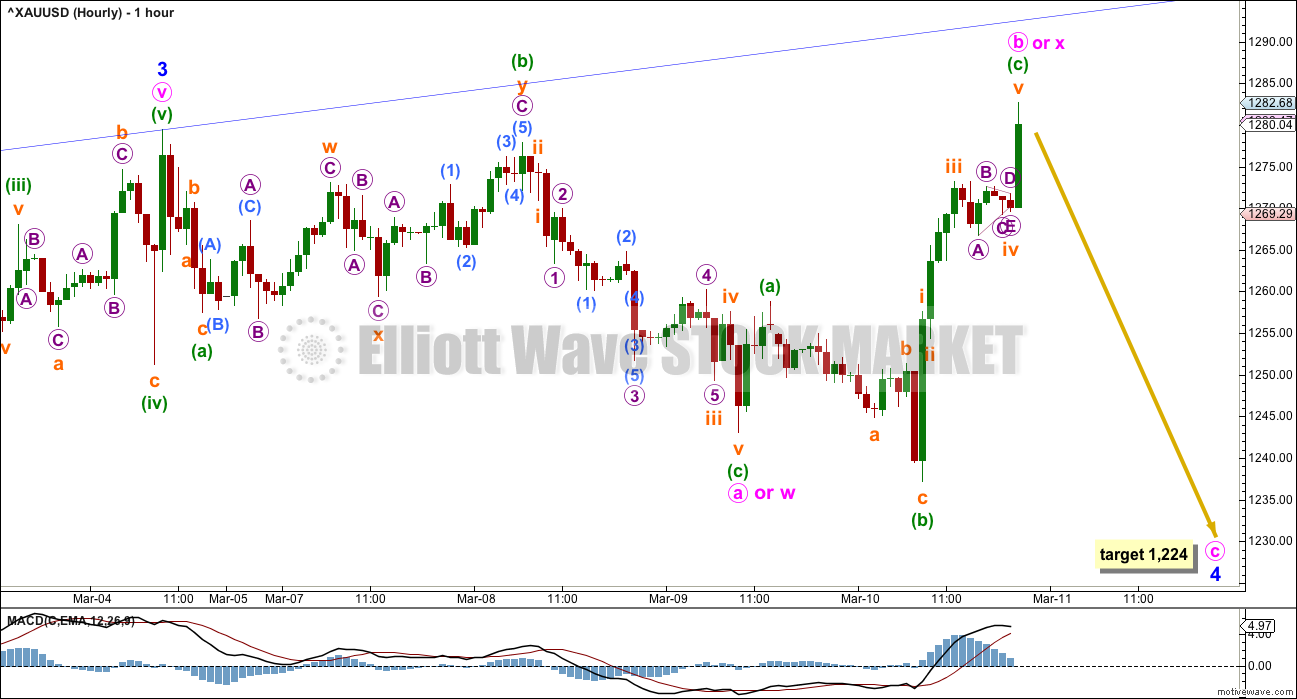
There is still more than one structural possibility for minor wave 4. It is most likely to be an expanded flat correction; minute wave b is now 1.08 the length of minute wave a. The normal range for a B wave within a flat is 1 to 1.38 the length of the A wave, so this B wave is still within normal range.
Minor wave 4 may also be unfolding as a double flat or double combination. The second structure in the double for minute wave y may be a flat, zigzag or triangle.
At 1,224 minute wave c would reach 1.618 the length of minute wave a. This is the most common ratio between A and C waves of expanded flats, and expanded flats are very common structures. This target would see minor wave 4 end within the price territory of the fourth wave of one lesser degree. It may end in one more day, if minor wave 4 is very brief and lasts only a total Fibonacci five daily candlesticks. Or more likely a further four days, so that minor wave 4 lasts a total Fibonacci eight daily candlesticks.
The maximum common range for this B wave, if it continues higher, is 1.38 times the length of the A wave at 1,293. Movement above this price point would reduce (but not invalidate) this main wave count and increase the probability of the alternate below.
ALTERNATE ELLIOTT WAVE COUNT
Click chart to enlarge.
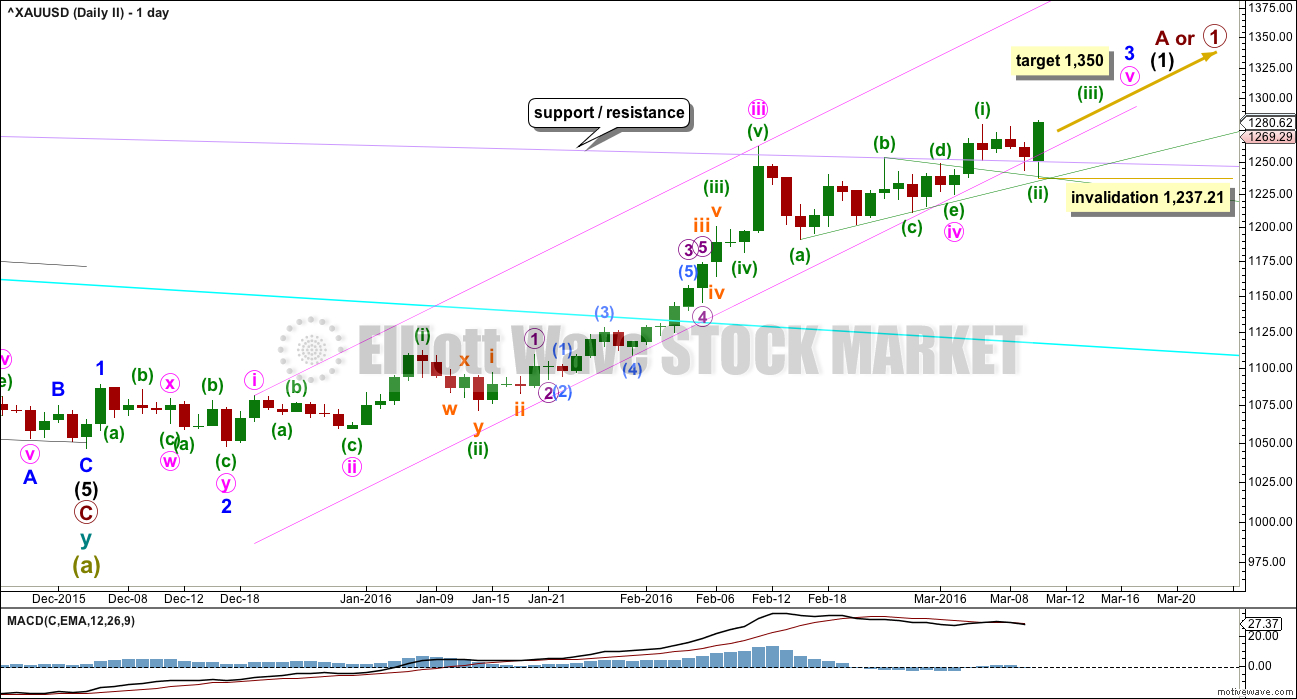
This alternate wave count has a low probability. It is published to consider all possibilities. This wave count is still viable but the probability is reduced.
By simply moving the degree of labelling within minute wave v down one degree, the upwards movement that ended on Friday may be only the first wave within minute wave v.
Minute wave v may be extending.
At 1,350 minute wave v would reach 0.618 the length of minute wave iii.

Click chart to enlarge.
Minuette wave (ii) will fit as a completed expanded flat correction, with subminuette wave c extending lower and ending with an ending expanding diagonal.
So far there is still some divergence with price and MACD which does not support this wave count. If upwards movement continues and MACD shows stronger momentum than that seen within minuette wave (i), if the divergence disappears, that would increase the probability of this wave count.
Subminuette wave i must now be over within minuette wave (iii). No second wave correction may move beyond its start below 1,266.69 within subminuette wave iii.
Declining volume as price moves higher for this last high also does not support this wave count. Very commonly a third wave shows an increase in volume, not a decrease.
TECHNICAL ANALYSIS
Click chart to enlarge. Chart courtesy of StockCharts.com.
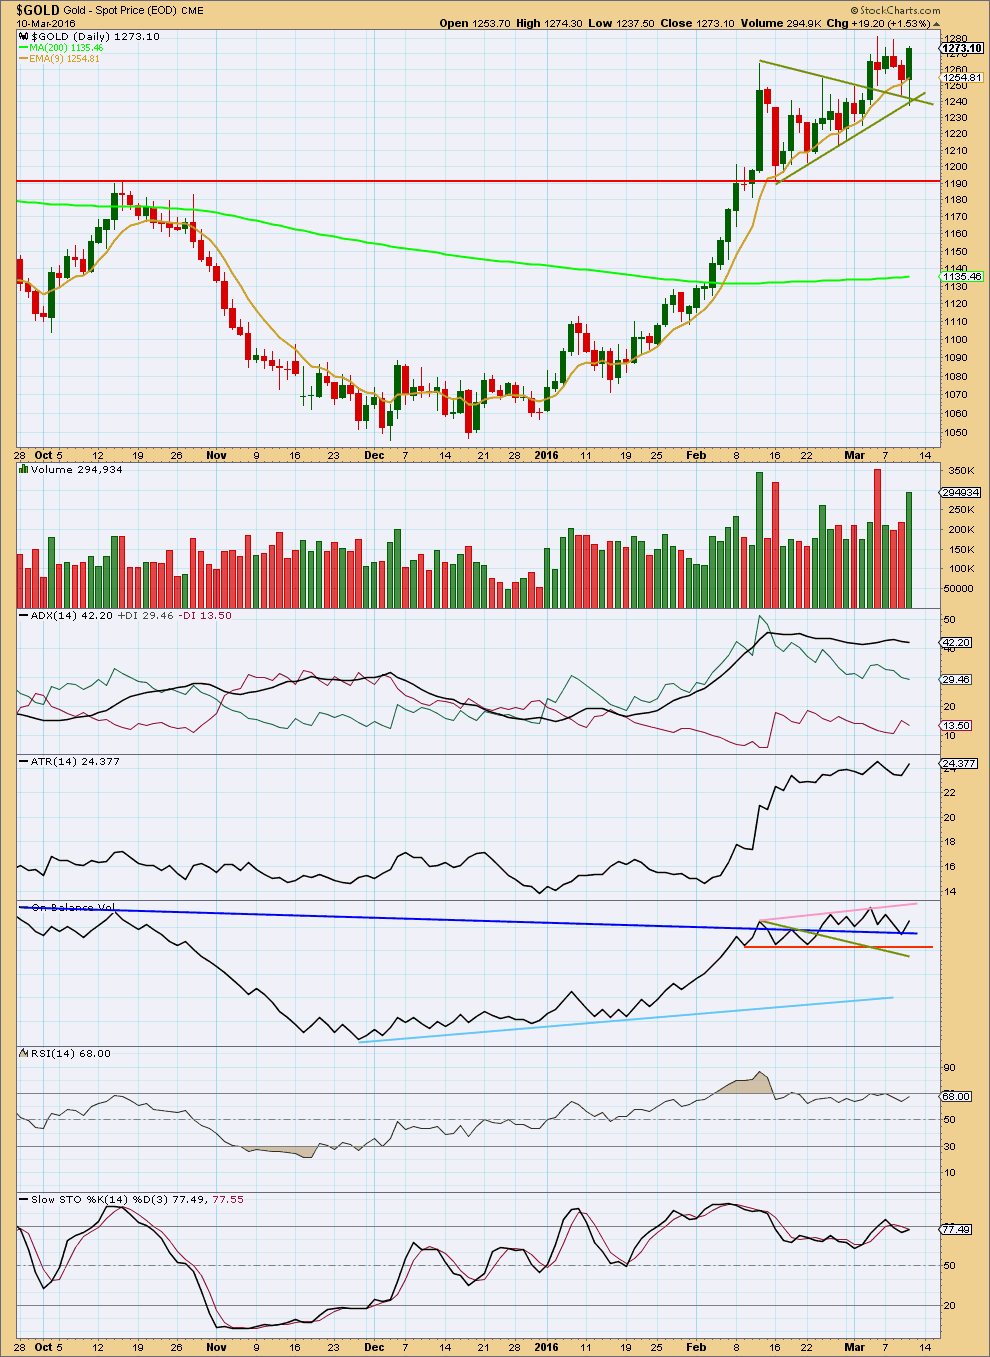
Strong volume for an upwards day of 10th March supports the upwards movement in price. This does not fit the main Elliott wave count. If the next daily candlestick is also green and shows an increase in volume then the main Elliott wave count would be discarded in favour of the alternate. However, data at the hourly chart level for volume indicates that this upwards movement has come with a decline in volume to the last high (not yet shown in StockCharts data) which does support the main Elliott wave count.
ADX remains flat indicating the market is still consolidating, but it is a lagging indicator. ATR is now increasing, so it disagrees, and it indicates the market is more likely trending.
On Balance Volume found support at the dark blue trend line. If upwards movement in price continues, it may be held down when OBV finds resistance at the pink trend line.
There is still divergence with RSI and Stochastics. This supports the main Elliott wave count; more corrective and downwards movement would be expected to resolve this divergence.
This analysis is published @ 09:45 p.m. EST.
Greetings folks, indeed Lara’s analysis has been awesome to say the least… Not trying to boast here, but I tell you what, I caught the drop to 1238 and back up to 1283 holding Sell expecting a pullback (short term decline) to occur on Monday from under 1260 (Gold price is toppy and a bearish key reversal is in play) for possible take out of 20dma for lower…. Good luck folks and happy trading. Lets wait for Lara’s update/analysis.
Just want to take the time to thank all the traders that have contributed this week. (It has been an exciting one) I was able to successfully trade the prior ‘B’ wave profitably – entered a day too early so only netted 12.49%, but still was successful.
Will now wait for ‘C’ to complete. And thanks to Richard and Dorian-Catalin’s discussion where Richard has shared with us some awesome trading indicators—I plan to try these out. Dorian-Catalin’s says “watchout”!
I found there is light in my tunnel! I’m feeling good about my decision to use my money in this manner (trading), am getting better at it and am grateful to all. More winners than losers and winners bigger than losers – thats my motto.
Thanks Lara for your commitment to excellence and this website! 🙂
dsprospering, You are most welcome. Great to hear you are doing well.
Any idea where we are in wave count right now in C wave on way down.
All questions will be answered in tonights analysis which is being written now 🙂
Papudi, I think your credit spread rollover indicatir could get triggered up reaching the 2044 GAP in the SPX 500. Let us know how it is looking and how it looks when we reach (and I think TOP, at 2044-2045, please. Thank you
LARA , gold has been flat-lining from 11:00 am to almost 3:00 pm at 1260 plus or minus, like someone pulled the plug on the respirator and it died. What does this portend?? If a breakout (up or down) any way of knowing which way? Thank you
I’m gonna guess the Breakout is down between now and the close.
With the run up last night to 1284.71 the MACD time frames all went in the overbought zone and they have all come back down into sold at times today but not yet the 195 minute time SMA 20 EMA 9 although the MACDTwoLines is in sell now for 195 minute time frame as it is faster than the SMA/EMA.
You got that right richard dropped down out of the Flatline at 1260 .! God made green apples!
Yes, Richard! Per my count and analysis: – wave 3 of 5 just finishing now at the close or will finish monday morning during asian session! That fizzle around 1pioint for 1hour that we saw together with some other up down was part of some complex structure with triangles making it wave iv of 3 of 5. So Monday-later will be a buy for gold lower i believe after 4up and 5down of 5! Watchout, it could all finish and make the low in asian session or europe before the US opens! Ty and have a great weekend everyone!!! 🙂
It looks like that was a fourth wave triangle.
Triangles have a purpose. To take up time, and test our patience.
They do the latter very well indeed.
Wow interesting action gold been sporting for past 1hour, I was away from computer. It’s been active in some very small range for 1 point or less, I wonder who makes this pips with tight spread. Has some good volume for such a range so I guess someone is. Amazing! I think price is caught now in wave 4 of iii of C down, yea? 😉
I’d like gold and GDX to crash to either the bottom of the 3rd or 5th wave by the close.
Dorian – Catalin
SMA 20 and EMA 9 we use on all time frames from 377 ticks to 1 minute to 1 week. Chosen and set up by a world trading pro I know.
Really? Nice, did not realise they hold such value, ty 🙂 I been using ema13+ ema34 cross usually…
The pro trader used to work for a hedge fund and was outperforming the rest and he quit to go solo and has made millions trading by himself and is friends with a few of the top traders in the world who write books and design new advanced leading edge indicators and provide training websites and products and they often all trade together from gold to Apple.
He makes money with his set up every day and the MACD and SMA/EMA I told you about below are two of his top ten indicators in the world now out of his many decades of trading either miners NUGT or GDX or GLD or other investments long term for weeks or down to 1 minute or 377 ticks.
The MACD and SMA/EMA as I described are Legendary together and will provide very accurate Buy and Sell times, however best to combine with other top indicators. I use them all the time myself as part of the pro-trading set up he designed and kindly gave me under an oath of confidentiality.
So far the wave count seems to be correct.
I’ll be expecting more downwards movement from Gold to move at least slightly below 1,243.09 so that C avoids a truncation.
The target will remain the same.
Analysis today will be pretty much the same.
And if downwards movement continues for three more days then minor 4 would total a Fibonacci eight.
It doesn’t have to do that, sometimes waves don’t have Fibonacci numbers. But fairly often they do for Gold.
I am lightly short (about 10 contracts of April comrx gold since last night at 1273. Was surprised by move up so far into 1280’s overnight, but held short and now am ahead at 1260, looking to exit at 1242 (not 1224) although we may see that or lower. Waiting to buy KGC,GSS,CDE AUY,EGO,NUGT,GDX and Julty and Sept Gold futures There is no doubt in my mind that the PPT (Plunge Protection Team) is propping up the stock market for a move to SPX 2044 GAP Fill. This is so JPMorgan ,Goldman Sachs,Bank of America etvc etc can initiate puts on the market for the inevitable crash in the SPX, (While Gol;d Rises) How does this fit the Ellioit wave ? PERFECTLY,because the thoght process and world conciousness is already built in for this to occur. And L:ara is focused correctly on it. Thank You Surfer Girl!
stephen, good point about the 1242 as a possible support area.
Lara did mention that as well in her analysis. I see it as the 1,240 area.
“The last two daily candlesticks found support at the upper triangle trend line. This may continue to provide support.”
I am not sure that we will NOT get to 1224 (or lower) but I am holding Futures short which have a limited time frame ,so will exit at 1242. But will then begin to scale in purchases of junior mining stocks(as listed) and if we get to 1224 (or lower) so much the better.
Short also since 1270ish, scalping trades even. My final target is 1232 or 1224, most likely tomorrow, doubt will happen today, or maybe overnight…. Stops at 1263,5 now if it takes it, 1more move up for (ii) and reload higher then continue. IF not, we are in 3 of iii already. If unexperienced, just wait to go long when it ends , it is risky to enter now… unless managing stops well etc, this target range for 1224-1232 is ideal but not guaranteed in my view as it could very well end up higher or even lower ofc.
Gold may hit Lara’s lower target today or lower than now 1,256 as TOS gold and GDX times from 1 to 195 minute are all in a MACD sell now.
Also Lara’s comment – A new low below 1,266.69 would confirm that the correction is not over. That already happened.
Lara, may I ask please according to Elliot wave rules, this C wave down now to end the expanded flat (if that is what will take shape) and minor 4 can it be only a 5 wave down straight or what other combination may it take? Can it also be a zizag 3-3-5 or something else even? Thx! 🙂
Dorian
I was having the same question before but got to knew that C wave is always an impulse.
It can be extended but it can never have a corrective pattern
Are you sure it can not be more complex like another flat 3-3-5 or a zizzag 5-3-5? Just a typical 5 wave decline ?
What knowledge i have from laras education videos suggested it..
Else lara will make u clear.. 🙂
C waves must always subdivide as fives (with the sole exception of C waves within triangles).
This C wave may only be an impulse or ending diagonal.
A zigzag subdivides 5-3-5. Wave C is a 5.
A flat subdivides 3-3-5. Wave C is a five.
Gonna copy/paste what I said on Lara’s index site for you guys here. The reason is this view trully supports the main elliot wave with gold now declining again for end minor end 4a nd then up again for end interm. or primary 1 or A. Also the bull elliot count on sp500 would support later the decline into interm. or primary 2 or wave B down. I am indeed concernd today and starting to question myself l. Here is: “Unfortunately, yes the alternate bear and the combination bull count are the only ones i see possible right now. Yesterday I thought also this is it, aparently all we had for past week was a zigzag wave 4. This crap market is fake, the banksters or whoever are controlling it are keeping it up artificially. Just like they did starting from 2011 till 2015 when QE and ZIRP started then NIRP… Does it all make sense? Yes when you think about it, but if this will happen and we go to new highs, don’t wory the potential decline will be bigger even then anyone expects. Don’t say oo no way that can’t happen, take all possibilities into consideration, myself I am starting to coz anything is possible even if it surpasses logic! But when an anomaly is created, it will be resolved in due time. And that’s what I think this market is right now…”
Thanks for sharing your post from Index. Whether it is ZIRP or NIRP one key indicator is credit spread, ratio of High yield junk bond to treasury ($MUT/TLT or JNK/TLT).
When the ratio declines credit spread is widening and when it rises the spread is narrowing means more credit is available.
Once the credit spread rolls over the market will follow.
Credit spread chart shows that market declined in 2008 after credit spread rolled over below 30 ema on weekly basis.
I am monitoring this indicator.
Thx, very interesting 🙂
Most interesting. Please keep us informed ! Thank you.
Lara: Main hourly minuette wave count expanded wave b at 1284 appears ended. it is at 2.70 of minuette wave a.
Is there a limit for wave b length?
If the main count plays out and gold goes down for the next 4 days, that would fit perfectly with the Fed meeting and statement next Wednesday. Showing a GDX chart by EagleSeagle that looks bearish also.
When it comes to Elliott Wave, Lara could write a rules book, when many so called Elliott Wave experts don’t even go by the Elliott Wave rules book to begin with.
LOL
I am writing a book actually.
I’ll have some new guidelines. I’ll not call them rules… I don’t have enough research to back up creating any new Elliott wave rules.
Lara, good for you to write your own book.
Being an Author really beefs up credentials and tends to make someone more known as an expert.
Amazing that gold went to 1284.71 Thursday night. At the close I checked many MACD time frames and could tell they still had bullish strength and didn’t want to be bearish over night. I’d rather wait for the the morning results. Then gold went from the close at 1270.77 gold moved up to 1284.71 at 8:17 pm up $15 in 19 minutes. Lets see how gold is at the open. I may go bearish then as Lara’s target is $1,224. I’ll check the MACD time frames before I put my money on the table. Thursday night I set up 2 of my 4 monitors set up with 4 MACD time frames each for gold and for GDX so I know what they are both doing before the market opens and all day long. Otherwise a tsunami could be coming up or down and you think the investing waters are calm.
Hi, Richard pls tell me what signals you use for MACD? Classical 12,26,9 or? I use that + RSI 5 + CCI 14 + STS 10,3,3 +Ema13,34, sma50 cross confirmations. Also some slope. What kind of strategy else or indicators you guys use for confirmation? Thank you 🙂
I use MACDTwoLines indicator at TOS Think or Swim platform.
It uses (3, 10, 16 Wilders) and it is awesome.
I set up two extra monitors last night with my platform set up so now have 3 monitors for the TOS set up only. The set up has 9 advanced indicators in a combination customed chosen by a pro trader I am friends with.
Now I can see at all times these times for all 9 indicators.
1, 5, 15, 39, 78, 195 minutes.
Some of these times are custom as TOS allows you to change the times.
It was finalized last week and I’m getting used to it.
Due to the trading platform last night I decided against buying and holding DUST overnight as GDX looked too bullish and then GDX spiked up last night
Dorian try Simple moving average 20 and Moving average exponential 9.
That will line up well in sync with the MACD Two Lines set up.
Sma20 and ema9 for scalping on 1-5min chart or 1-4h chart? Or for? For scalping on euro/usd i have 3 signals got them from a friend working on MT4 the problem is time, thinking make a robot, altho they have some failure rate too. Thx