
Downwards movement was expected for Friday’s session.
Summary: The target remains at 1,224. The target may be met in one or two more sessions.
New updates to this analysis are in bold.
Last published weekly chart is here.
DAILY ELLIOTT WAVE COUNT
Click chart to enlarge.
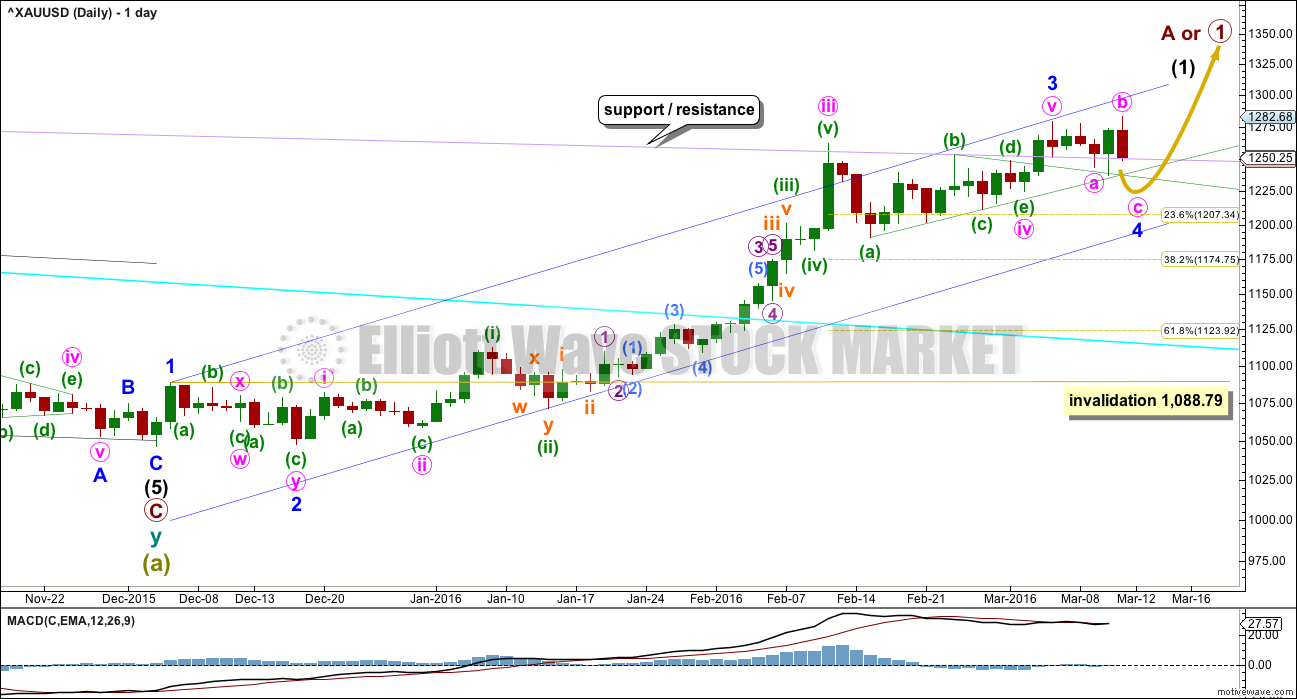
Gold has very likely changed from bear to bull.
So far, within the first five up, the middle of the third wave is now most likely complete. The strongest move may still be ahead. Gold often exhibits swift strong fifth waves typical of commodities. Minor wave 5 may be strong and may end with a sharp upwards day on a volume spike.
Ratios within minor wave 3 are: there is no Fibonacci ratio between minute waves iii and i, and minute wave v is just 0.07 short of 1.618 the length of minute wave i.
Minor wave 2 was a very deep 0.97 double zigzag lasting nine days (one more than a Fibonacci eight). Given the guideline of alternation, minor wave 4 may be expected to be a longer lasting sideways structure such as a flat, combination or triangle. At this stage, minor wave 4 may be unfolding as a flat correction which may end in a Fibonacci eight days. If it is a combination, it may continue for longer, perhaps to total a Fibonacci thirteen days.
Minor wave 4 may end within the price territory of one lesser degree. Minute wave iv has its range from 1,261.94 to 1,190.9.
Minor wave 4 may not move into minor wave 1 price territory below 1,088.79.
Although the alternate wave count was not invalidated by price, the strong downwards day of Friday has reduced the probability substantially. It is my judgement that the probability is now too low for publication.
HOURLY ELLIOTT WAVE COUNT
Click chart to enlarge.
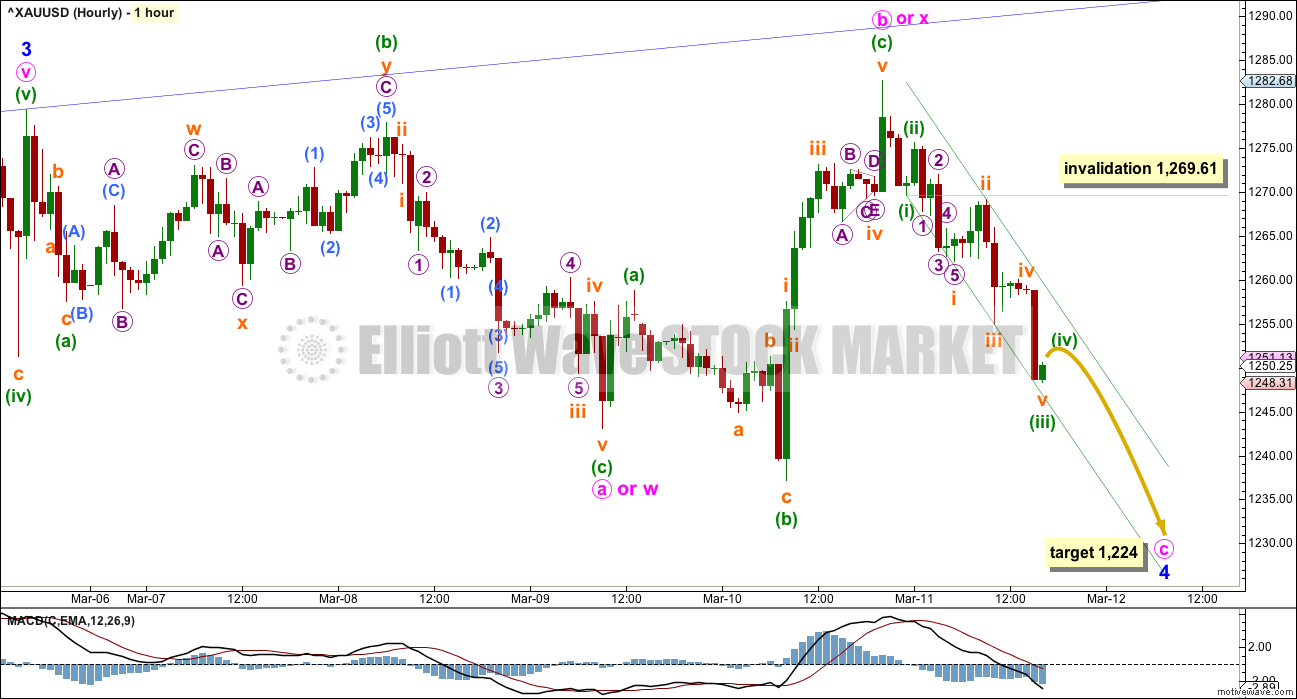
There are still at least two structural possibilities for minor wave 4. It looks at this stage to most likely be a regular flat correction. Within the flat, minute wave a subdivides as a three, minute wave b is a complete three, and minute wave c downwards must complete as a five. Minute wave b is a 1.09 length to minute wave a, so this would be an expanded flat. The most common ratio for minute wave c would be 1.618 the length of minute wave a which would be reached at 1,224.
Within minute wave c, minuette waves (i) to (iii) may be complete. This labelling expects minuette wave (v) to be extended which is typical of commodities.
There is no Fibonacci ratio between minuette waves (i) and (iii). This makes it more likely that minuette wave (v) would exhibit a Fibonacci ratio to minuette wave (i). The most likely ratios would be equality at 13 in length, or 1.618 at 21 in length.
Within minute wave c, the correction for minuette wave (iv) may find resistance at the upper edge of the best fit channel. It may not move into minuette wave (i) price territory above 1,269.61.
Minor wave 4 may also be unfolding as a double combination. The first structure in the double was an expanded flat labelled minute wave w. The double is joined by a three in the opposite direction, an expanded flat labelled minute wave x. The second structure would most likely be a zigzag labelled minute wave y. It may also be a triangle or a flat correction for a double flat. If minute wave y is a triangle or flat correction, then it may be a more time consuming sideways movement that could continue for a further eight days for minor wave 4 to total a Fibonacci thirteen daily candlesticks.
At this stage, it does not look like minor wave 4 is unfolding as a triangle. The downwards movement to the low labelled minuette wave (b) would have to be the end of the A wave of a triangle and this does not fit well as a double or single zigzag.
TECHNICAL ANALYSIS
Click chart to enlarge. Chart courtesy of StockCharts.com.
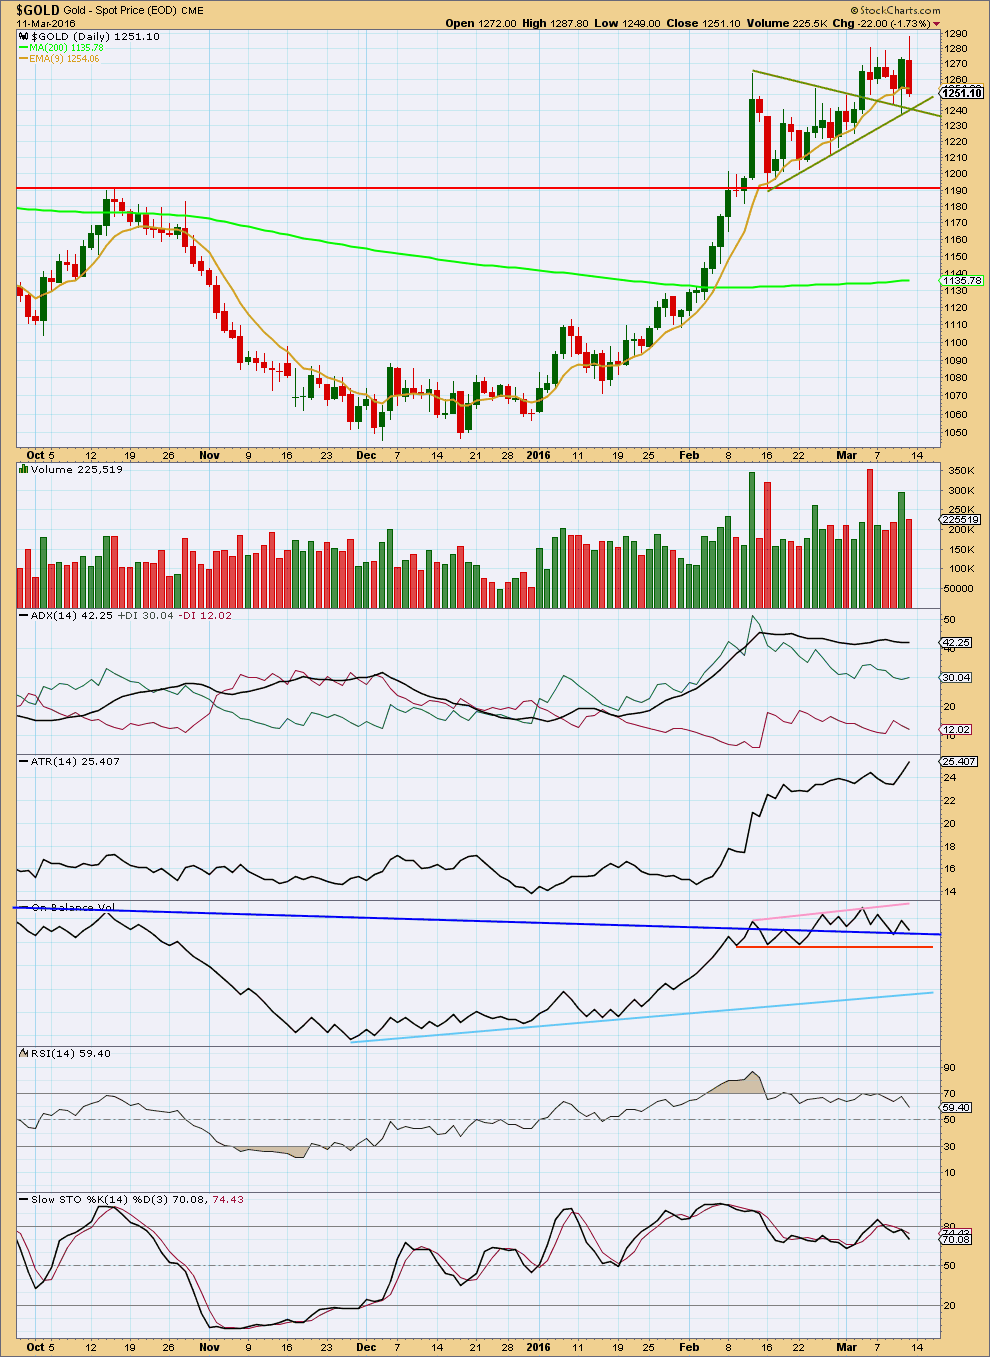
Since the beginning of this current consolidation from the first day on 7th March, it is an upwards day which has strongest volume. This indicates an upwards breakout is more likely than downwards.
The downwards day of 11th March comes with lighter volume than the prior day. The fall in price was not supported by volume.
Price may find support at the green trend lines which delineated the triangle structure.
ADX is slightly increasing, so the market may again be trending and the trend would be up. ATR also is increasing indicating the market is likely trending again.
On Balance Volume has come to find support at the dark blue trend line. This may assist to hold up price here. If OBV breaks below this line, the next line is the short term orange line, but this does not offer much technical significance.
RSI has returned from oversold as has Stochastics slightly.
This analysis is published @ 11:49 p.m. EST.
…. Gold price is weak below pivot and toppy; expecting a pullback (short term down move)…..
Here’s an option for GDX. It may be carving out a 4th wave triangle which will finish before the Fed announcement, then move sharply upwards.
Beautiful if that is the case, perhaps I can sell my GDX at a profit then buy it back asap.
I’m thinking that likely today is the end of minor 4. Already 5 daily candlesticks and below Lara thinks it may end in 6 daily candlesticks (including today).
I already bought some GDX and am ready for minor 5, the target is not 1,350 as that was minor 3. Lara will calculate the target for swift, strong, minor 5 once minor 4 is over.
“Lara March 14, 2016 at 3:18 pm
Looks like this correction for minor wave 4 is so very close to ending, and it looks like it may end totalling six daily candlesticks. Not a Fibonacci number.
Overall on the daily chart it has a good look. So far.”
Dear Lara,
For a non-pro in wave analysis, could you plz be so kind to sum up the first tp? Is it 1224? And if it breaks lower? Thank you!
It was 1,224. But it looks like it was too low, I don’t think it will be met now.
Minuette (iv) moved higher and remained below minuette (i) price territory. It also nicely ended within the fourth wave of one lesser degree.
Now minuette (v), the very last wave down, is underway.
Within todays downwards movement I can see subminuette waves i, ii, iii, iv and now v.
The last fifth wave of the last fifth wave… most likely of wave C.
Fifth waves for commodities are commonly extended. Doesn’t mean this one can’t be, this is a statement based on probability.
Minuette waves (i) and (iii) do not exhibit a Fibonacci ratio to each other. This makes it more likely that minuette wave (v) will exhibit a ratio to (i) or (iii). So now I can add to the target calculation at a second wave degree.
Within minute wave c so far minuette wave (i) was very short, not extended. Minuette (iii) was an extended wave.
So far minuette (v) is also extending. At 1,234 it would reach equality in length with minuette (iii). That target is reached, it could be over now.
What about a more common ratio with minuette (i)? It’s passed 1.618. So the next ratio is 2.618. At 1,227 minuette (v) would = 2.618 X minuette (i).
This gives a $3 target zone with a reasonable probability. 1,227 – 1,224.
I can add to the target calculation at a third wave degree.
Within minuette (v) there is no Fibonacci ratio between subminuette i and iii.
So subminuette v is likely to exhibit a ratio to either of subminuette i or iii.
And again, this looks like a smaller fractal, a copy, of minute c. Subminuette i was short, not extended. Subminuette iii is extended. Subminuette v so far looks to be extending also.
The most common ratio for a fifth wave is some ratio to the first. A ratio between a third and fifth wave is less common.
At 1,224 subminuette v will = 2.618 X subminuette i.
So the $3 target zone is now calculated at three degrees.
I will favour the lower edge of the target zone because it is calculated at the lowest degree. If that is where price ends up then all three degrees; minute, minuette and subminuette, will exhibit ratios.
Looks like this correction for minor wave 4 is so very close to ending, and it looks like it may end totalling six daily candlesticks. Not a Fibonacci number.
Overall on the daily chart it has a good look. So far.
Thank you Lara for your timely and fabulous analysis on this. Once again we almost cross-posted (good thing I refreshed first). By the way – what was the weird time stamp on some comments that ‘disappeared’? Top comments were dated 3/12 and I see Loi’s comment is now below in-line. weird.
sorry I’m new to Elliot wave. so have we bottom or are we still targeting 1224-1227?
Can someone let me know before I Long.
You’ll know in the analysis tonight. Lara will do the charts and clarify.
Gold did hit a low of 1229.34 at 3:49 pm EST today just after Lara said “minor 4 is so very close to ending, and it looks like it may end totaling six daily candlesticks.” Six candlesticks would include today.
So I wouldn’t expect gold to drop more. On big day like today where gold and the miners drop almost the whole day, I’d be buying my miners as no guarantee they’ll drop Tuesday. Also surprises are to the upside and I don’t want to miss that big minor wave 5 up as I missed buying in on some other dips.
I’m doing the Gold analysis now which will answer your question.
Hi Lara, I am confused abit right now on where the minuette (iv) ended? Is it at 1261 or at 1259? This is my chart but I admit I am not sure where to label the subminuetes. Maybe you can post your chart or correct mine? Again apologies for that huge wall of text and caps on index comment today, I realised later it was really too much … IF (iv) ended at 1261 what kind of structure did it take? Thanks alot! 🙂
The first point you have, 1,260.93. It looks like a zigzag.
WEDNESDAY, MARCH 16
2 pm EST FOMC announcement
2:30 pm Janet Yellen press conference
GDX MACD 1,3,5,15 minutes are all BUY now at 1:28 pm EST GDX at $19.46
I just bought GDX for $19.311 at 12:16 pm was the day low then. I may buy more once we get Lara comment. I bought 8 minutes before low at 12:24 pm and 8 cents above the GDX day low of 19.23 so far.
Ok, I am not sure atm about whether the last minitop today at around 1250 is end of a wave II of 5 or of wave IV of 5. But i would say if price gets above 1251, it would invalidate both so that is a buy there… If 1250 was w II then it could get “ugly” more today till down to 1224 or so… 🙂 Thoughts?
All times MACD and SMA/EMA GDX 1 to 195 minutes are Sell right now GDX now 19.36
1more wave down to 1235-1240 and I believe we are done at least for today 🙂
good
I do not think we will bottom in April gold futures until the SPX fills in its Gap left at 2043 to 2044 (Which should be the Top of this B wave correction in the S&P index. ) So I am waiting. However that is not to say some of the mining stocks are not good buys from here and down a bit further.
We are waiting for a 5 for minor 4…but we are in minutte 5 of minor 4 C…and sometimes these 5 waves are very strong and cannot be seen on hourly charts…15mins and 30mins charts sees 4th wave is dne and we are in 5th wave…a low around 40$ seems a good buy here…i will buy gold soon…taking a chance…anyhow the trend is up…so a safe risk…
A warning about that though: It’s essentially trying to pick a bottom.
The risk will be that the end of minor 4 isn’t here, it may continue lower.
Risk is reduced once we have price confirmation that minor 4 is over.
I’ll be providing price confirmation points in todays analysis.
Minor wave 4 may end within the price territory of one lesser degree. Minute wave iv has its range from 1,261.94 to 1,190.9.
There is no Fibonacci ratio between minuette waves (i) and (iii). This makes it more likely that minuette wave (v) would exhibit a Fibonacci ratio to minuette wave (i). The most likely ratios would be equality at 13 in length, or 1.618 at 21 in length.
Minor wave 5 may start today as gold is dropping hard now.
Monday high wave iv may be at 5:59 am of 1261.22 – $13 is 1248.22
1261.22 -$21 is 1240.22 for bottom of wave v, then minor (v) may begin?
Yes… watching 1239-1240 lvl closely now., but this has to be a 5 wave down, so far its a 3, lets wait for 4 -5 , otherwise can go much lower. Also i see minuete 2 of v made an expanded flat lol> This decline has to subdivide in a clear 5 wave down, otherwise can be part of wave IV activity still
It did look like a 3 down, so lower to go, thanks.
Ok watching 1239 – 1240 area to buy GDX.
Then buckle up for minor 5 launch, swift and strong.
Yea… and I gonna buy some silver too today, looking very strong I think. What does your technical picture, indicators, MAs etc say about silver, Richard ? ty 🙂
I don’t know the symbol for silver in TOS platform
Gold is /GC
/SI is silver in TOS
right now 15,39,78,195 minutes are all in a SELL MACD
Also a sell has been fired as well in another indicator.
So Silver now is very weak.
Not sure about shorter times than 15 minutes which is important.
Use MACD and SMA EMA at 5 minutes for good buy signal
OK nvm, if it can now go consolidate about 1244-1251 and do that for 1hour or so it would mark the last wave iv within the last v down to end C or A of Y lol. But up after … maybe 1240 holds, depends how they do next spike down, or maybe it takes the last low at 1237 abit just to wipe out stops. If u go long, put stops very very wide lol
Going forward in PM sector big money is to be made in Junior mining space. Get on the rocket ship!!!!!
I have posted few featured articles in past for 10 to 100 baggers.
Here is another one a must read for serious money maker.
http://goldtadise.com/?p=364922#comments
This is what I get when click this link…. No ideea why, can u copy/paste the essential pls?
Your access to this site has been limited
Your access to this service has been temporarily limited. Please try again in a few minutes. (HTTP response code 503)
Reason: Access from your area has been temporarily limited for security reasons
GoldtentTA is a free forum for all.
http://goldtadise.com/
look for this post by bobbyc tittle “the renaissance of Australian gold”.
Better yet the post has this link:
http://www.smh.com.au/business/mining-and-resources/gold-standard-the-renaissance-of-australian-gold-20160310-gng9ul.html
Once minor 5 is over in a week or so gold and miners may move down for weeks much lower.
How does one buy australian gold miners in the US? What is the symbol for Newcrest. What are the names for OCVG,NST,EVN Thank you.
Jack Chen March 12: “According to this week’s COT data, speculation in gold, silver, copper, and crude oil have all reached levels of previous tops, similar to May and Oct 2015. Therefore, unless this time is different, expect much lower prices in coming weeks in commodities.”
Gold COT data more bearish than before?????
Gold’s seasonal low in March-April in foresight after Feb high.
It will resolve itself once gold starts interm. 2 down which will prolly retrace alot 61,8% or more. Till then, I see gold bottoming today or tomorrow in a 1220-1250 range ( this minute wave (iv) of C start to look abit suspicious, maybe (v) truncates,… ) and the last minor 5 starting to target again 1350 +-30points. 🙂
Note gold wwas already down to 1248 in overnight trading doesnt this countg in lara,s Ewave projection??
Note gold was already down to 1248 in overnight trading doesnt this countg in lara,s Ewave projection??
Yes.
Gold after a long time is so clear…good relief to watch gold doing what lara is expecting…i have seen lara getting frustated by golds suspicious nature many times…but at last she knows how to handle the black horse..lolzz..
Thanks lara…last week was a good profitable week… :)..
Stocks and Oil is behaving odd…this strong rally was not expected..waiting for laras oil analysis…and also i just want to know that in oil…the maroon and the lillac line will get intersect soon at a point and date…does that makes any effect..???
Enjoy while it is clear. Gold is in cycle wave b. If cycle wave a was frustrating this one is going to be more challenging than wave a.
Lolzz..
Anyways i didint mean that papudi…frustation was never in that sense…trend was and will be always clearer from lara..
Silver looks bullish through March 29th! – GUNNER24
http://www.gunner24.com/newsletter/nl-031316/
GDX rolling over. Chart by Thirdeyeopentrades
GDX will make new highs soon lol. Well maybe tomorrow comes to that neckline so lower yea, but doubt the H&S will play out!
To the moon once I buy in Monday maybe Tuesday.
can the target be higher? since 1224 is below that wedge support line you drawn. I have the wedge bottom at 1238-1237. Is this a possibility?
Lara, now that the alternate wave count has been discarded. Does the $1,350 still remain as the target for the top of minor wave 5, intermediate wave (1) and might that be a fast process since it is a 5th wave?
The old target of $1,350 was for minor 3, not minor 5.
I cannot calculate a target for minor 5 until I know where it begins.
With minor 4 incomplete I don’t know where minor 5 begins. Which is why I’ve provided possible lengths. That’s the best I can do at this stage.
Lara, thank you for your great analysis as always! I just have 3 questions please: Question 1: You said: ” There is no Fibonacci ratio between minuette waves (i) and (iii). This makes it more likely that minuette wave (v) would exhibit a Fibonacci ratio to minuette wave (i). The most likely ratios would be equality at 13 in length, or 1.618 at 21 in length.” – does this imply there cannot be also a ratio of 0.618x(iii) for minuette (v) to end the C and minor 4 there? Or even (v)= 1.618x(i+iii)? Question 2: If in fact minor 4 turns out to be a combination, how would this unfold after (v) of C ends? Would it then require another 3wave up advance followed by another 5wave down decline to end wave Y and minor 4? Or another type of structure possible as a triangle in a wave Y? Or what else? I thought triangles only develop in waves B or X. So a wave Y is not regarded upon same rules as a wave C is? Question 3: After minor 4 ends what would be the most likely target for minor 5 and interm. 1 to end? Is it 0.618x minor 3? 🙂
Question 1:
No implication intended. The most common ratio for a fifth wave is to the first, not the third. I’ve supplied two possibilities based on the most common ratios seen. That does not mean that the fifth wave must have a ratio to the first, it may have a ratio to the third.
A ratio of 5 to 1.618 X (3 + 1) is not a ratio I’ve ever seen. Ratios are between individual waves AFAIK. Not between one wave and a multiple of the others.
Question 2:
If minor 4 is a combination then it would not see a five down for C, instead of C down it would be Y down as a three.
Y waves are threes not fives.
W would be complete as a flat correction.
X would be a three complete in the opposite direction.
Y would move sideways as a three; either a flat, zigzag or triangle.
Triangles develop in B waves, 4th waves, X waves or Y waves (or Z waves). They are the final movement prior to the actionary wave in the pattern of one larger degree, or the final pattern in a corrective combination. EWP page 51.
Question 3:
See my answer to Richard above.
Thx, Lara. Regarding the ratios for waves I have always used data from http://www.prognosis.nl/support/faq/principle/principle3.html#fibonacci. It says like this:
“Targets for wave 5
Wave 5 normally is equal to wave 1, or travels a distance of 61.8% of the length of wave 1. It could also have the same relationships to wave 3 or it could travel 61.8% of the net length of wave 1 and 3 together. If wave 5 is the extended wave it mostly will be 161.8% of wave 3 or 161.8% of the net length of wave 1 and 3 together. ” – maybe this data is outdated or dunno, but yea in this case its the min. iii that was extended so prolly won’t be the v… I have a hunch or feeling if u want to call it however this turns out to be a WXY after all and C turns into Y with another 3 up after it makes the low and another 5 down. No ideea about targets on that, remains to be seen. But my feeling is also based on some facts, or correlation between the sp500 or overall stock market and the gold action. I shall post a very complex chart on sp500 forum explaining my point of view tonight later, I am still working on it… 🙂
Usually, as Lara often says Simple is best (as opposed to complex).
Usually true, but on a manipulated market by “Skynet” and other “entities” and I am just referring to sp500 now, not always! :)))
Btw Lara, during my numerous trades past 5 years, I have come with conclusion alot of times wave v can be 0.618x (w1+w3) net length together yea… Even on gold on miniwaves. Alot of times this coincides in fact with 1,618x w1 length it is either abit short or longer, so both targets offer good value to be taken into consideration as a range. It was my mistake i said about 1,618x(w1+w3) i also found out that works in fact but only rarely when there is a w1 slightly bigger then w3 and then w5 extends to compensate. 🙂
I meant when there is w3 slightly bigger then w1 and then w5 extends to compensate lol, I was tired yesterday… 🙂
According to Professor Tim Duy “Fed will hold steady next week. Key FOMC participants are shifting in a dovish direction.”
http://economistsview.typepad.com/timduy/2016/03/state-of-play.html
This would agree with the forecast that gold will spike to $1300+ on Wednesday.
That said, COT this week is worrisomely bearish … it’s off the chart in terms of Bollinger Bands… next week will be interesting to see Commercial proven wrong after being right for so long. Crossing fingers and toes.
http://snalaska.com/cot/current/charts/GC.png
http://snalaska.com/cot/current/charts/SI.png
Sometimes the Commercials get ahead of the trend a little too much. The Commercials will likely stay strongly short until Intermediate wave 2 is underway. In other words, they may be too early to get so short, but will ultimately be correct.