
More downwards movement to a target at 1,224 was expected.
Price moved lower to reach 1,226.59 so far.
Summary: The correction may have now ended. Price confirmation is required before any confidence may be had that it is over. A new high above 1,260.93 by any amount at any time frame would provide confidence that Gold is most likely in a fifth wave up. Fifth waves for commodities can be swift and strong. The first target is at 1,295. If price keeps going up through the first target, the next target is at 1,338. If downwards movement continues, these targets must move correspondingly lower.
New updates to this analysis are in bold.
Last published weekly chart is here.
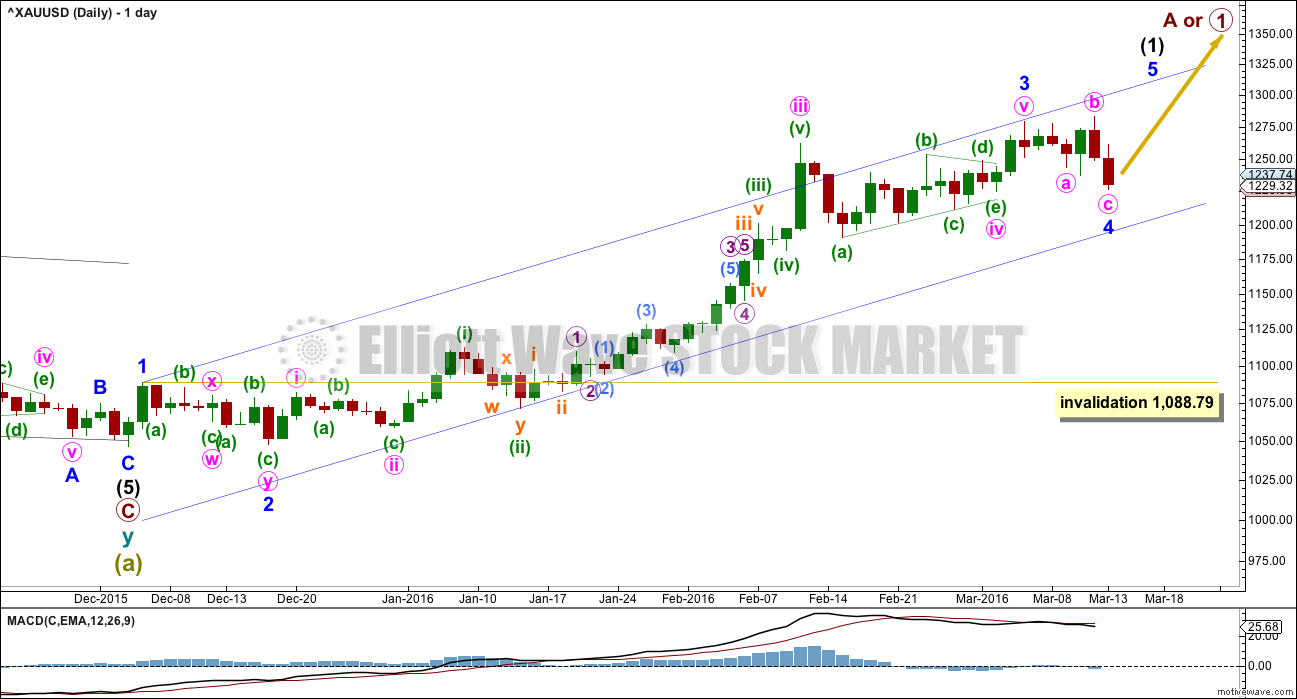
DAILY ELLIOTT WAVE COUNT
Click chart to enlarge.
Gold has very likely changed from bear to bull.
So far, within the first five up, the middle of the third wave is now most likely complete. The strongest move may still be ahead. Gold often exhibits swift strong fifth waves typical of commodities. Minor wave 5 may be strong and may end with a sharp upwards day on a volume spike.
Ratios within minor wave 3 are: there is no Fibonacci ratio between minute waves iii and i, and minute wave v is just 0.07 short of 1.618 the length of minute wave i.
Minor wave 2 was a very deep 0.97 double zigzag lasting nine days (one more than a Fibonacci eight). Minor wave 4 may be complete today as an expanded flat correction lasting six daily candlesticks (six is not a Fibonacci number). This gives the wave count a reasonable look in terms of proportions. There is perfect alternation between the deep double zigzag of minor wave 2 and the very shallow 0.23 expanded flat correction of minor wave 4.
Minor wave 4 is within the price territory of one lesser degree. Minute wave iv has its range from 1,261.94 to 1,190.9.
At this stage, it looks like minor wave 4 may be over but this is not confirmed by price. The invalidation point must remain at 1,088.79 while there is no confirmation. Prior to confirmation, this is the risk today with this wave count.
Minor wave 4 may not move into minor wave 1 price territory below 1,088.79.
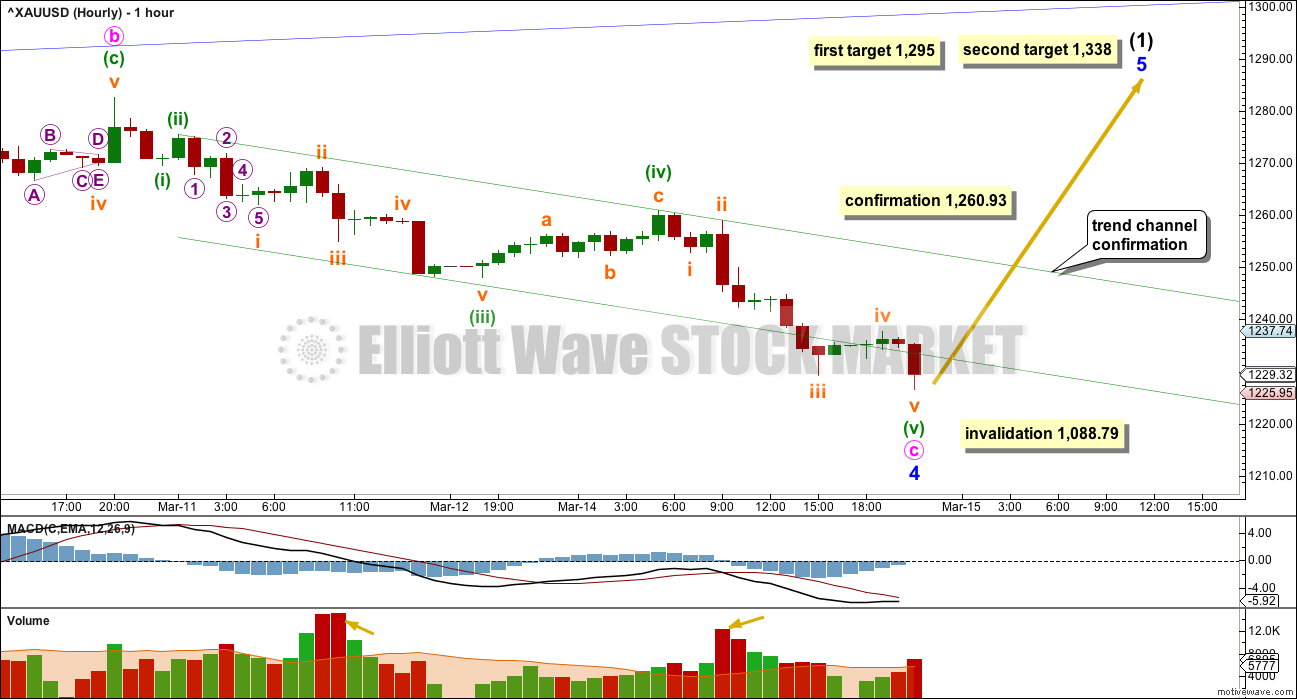
HOURLY ELLIOTT WAVE COUNT
Click chart to enlarge.
Minor wave 4 may now be complete as an expanded flat correction. Within minor wave 4, minute wave b was a 1.09 correction of minute wave a. There is no Fibonacci ratio between minute waves a and c.
Ratios within minute wave c are: there is no Fibonacci ratio between minuette waves (iii) and (i), and minuette wave (v) is just 0.12 longer than 2.618 the length of minuette wave (i).
Within minuette wave (iii), the third wave of subminuette wave iii shows strongest volume.
Within minuette wave (v), the third wave of subminuette wave iii shows strongest volume.
Minuette wave (iii) has stronger momentum than minuette wave (i) and minuette wave (v) has stronger momentum than minuette wave (iii).
This wave count fits with momentum and volume.
1,260.93 is the start of minuette wave (v). If minuette wave (v) is not over and extending further, then within it no second wave correction may move beyond the start of its first wave. A new high above 1,260.93 could not be a second wave correction within minuette wave (v), so at that stage minuette wave (v) would have to be over. This would provide some price confirmation of a trend change.
It is possible that the expanded flat structure is the first flat in a double flat for minor wave 4, or only wave A of a larger flat for minor wave 4. A five up at the hourly chart level would eliminate this possibility.
It is very likely that minor wave 4 is over today
because the wave count has the right look with good proportions at the daily chart level. If it were to continue further as a double flat, it may begin to be out of proportion.
If minor wave 4 has ended here, then at 1,295 minor wave 5 would reach 1.618 the length of minor wave 1. If price keeps going up through this first target, or when it gets there the structure of minor wave 5 is incomplete, then the next target is the next Fibonacci ratio in the sequence. At 1,338 minor wave 5 would reach 2.618 the length of minor wave 1.
TECHNICAL ANALYSIS
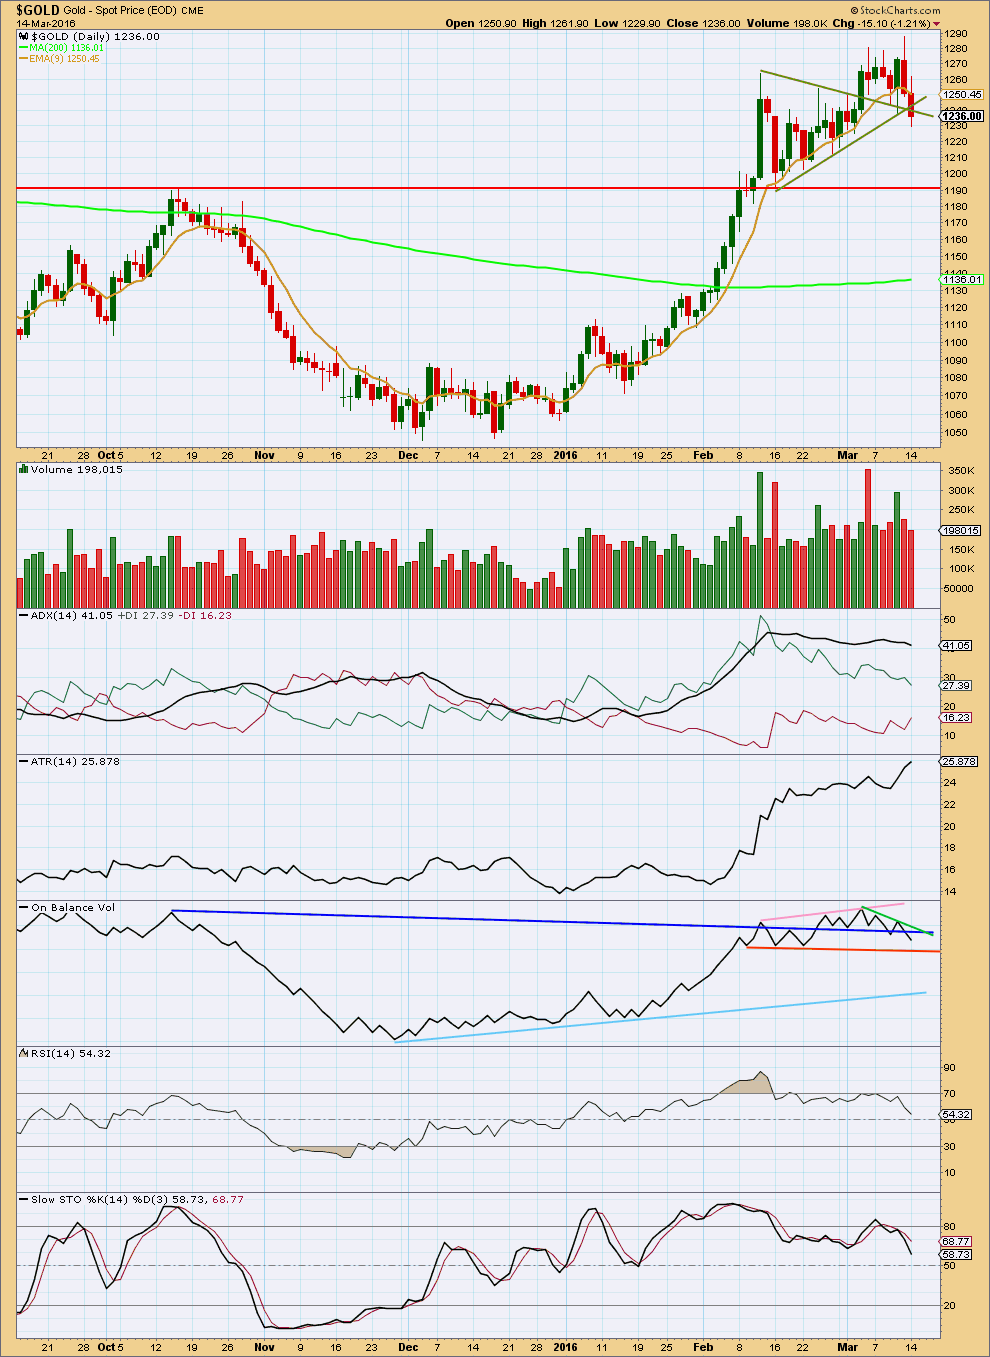
Click chart to enlarge. Chart courtesy of StockCharts.com.
Two days in a row of falling price on declining volume supports the Elliott wave count. The fall in price is not supported by volume.
During the consolidation which has the first daily candlestick on 7th March, it is an upwards day which has strongest volume. This supports the Elliott wave count which sees an upwards breakout.
ADX is still declining indicating the market is not trending; it is consolidating. The +DX line remains above the -DX line, so a trend change is not indicated. If the trend returns here, it should still be upwards.
ATR is increasing indicating the market is trending.
On Balance Volume has broken below the dark blue line. This is a bearish signal. On Balance Volume has not broken out of the zone it has been moving in since about 9th February though. A break below the orange line would be a strong bearish signal. A break above the pink line would be a strong bullish signal. A new short term green line is added. A break by OBV above this line would be a weak bullish signal.
RSI has moved close to neutral. This should now be enough to resolve the prior divergence with price. There is again room for the market to rise.
Stochastics has also moved down from overbought.
This analysis is published @ 09:57 p.m. EST.
A small green daily candlestick would be a slow start to this fifth wave up.
We still do not have price confirmation that it is underway, nor do we have trend channel confirmation yet.
I can see a small five up off the last low on the hourly chart… but it could also be seen as a three (zigzag). It is impossible to tell for sure which one it is.
However, following the possible five up I can see what looks very clearly like a three down.
And so I have a little more confidence today in the wave count, but this comes with the strong caveat that price has not confirmed it yet.
The last green hourly candlestick came with an increase in volume. If this is a low degree third wave up (maybe within the first impulse of minor 5) that fits with the short term volume profile. This adds slight confidence to the wave count and the idea that Gold should make new highs, but it is only slight.
The bottom line is we don’t have price confirmation that Gold is now on the way up. While we don’t have that please understand I could be wrong, and if you choose to enter long here it is essential you understand there is a risk to such a trade (as always there is risk) and manage the risk to your account accordingly.
I have entered a small buy, keeping my position small, last night. My stop is just below the end of minor 4. I understand the risk is I could be wrong and have a loss. As soon as my position is reasonably profitable I’ll pull my stop up to just beyond my entry point eliminating risk.
A chart would be better wouldn’t it.
This shows the small five up I can see, and the more clear three down.
Note too the last two green hourly candlesticks come with some increase in volume; the rise in price is supported by volume.
getting above the 20 ema has led to some nice moves for nugt lately, will it happen again?
Shahab, Thanks a lot for the amazing chart.
This afternoon gold commenced it’s upwards Breakout.
“This supports the Elliott wave count which sees an upwards breakout.”
“The strongest move may still be ahead. Gold often exhibits swift strong fifth waves typical of commodities. Minor wave 5 may be strong and may end with a sharp upwards day on a volume spike.”
GDX had gone into MACD buys 1,3,5,15,39 and 78 minutes also Fired Buys 1,3,5,15 and 39 minutes in the last 2 hours. Gold MACD has bottomed and turned to BUY for 15, 39, 78 minutes today and showing it is under a major consolidation process today.
Gold woke up at 2:30 pm and momentum and price picked up.
Thanks for the updates…
I opened an option position on GLD when it was at 1230 about an hour ago…
Got the April 15th $123 strike price calls for $0.90.
Hoping to unload them when GLD gets to $122/123 price range…
And this might happen as quickly as tomorrow with the FED announcement.
Watching gold prices like a hawk
Intr-day update by Lara would be very helpful 🙂
Prosperous trading!
went over the 20 ema (57.18), want it to close above 57.18
I missed the NUGT trade. Yesterday I planned on loading up on April 15th, $60 calls. They went as low as $6.10 today when NUGT was at 52, and now going for $8.20 for a 33% up already. So missed out on that one…
Best of luck. I think NUGT will get to $63-65 before this up move is over…
bought some at 56.20, will buy more after lara update and close above 57.18
excellent way to close! expecting a nugt blast in the near future! will post chart later.
Yes enjoyed the close.
I think NUGT may hit $70 even at 1295 and higher if gold goes up to 1338.
GDX may hit $21 or higher I hope.
It closed above 57.18 amazing.
Canada sale may mark a long-term bottom in gold –
Avi Gilburt EW Mar 11, 2016 12:47 p.m. ET
Central Banks tend to have the worst timing in gold.
I believe when we look back years from now, 2002 and 2016 will both represent major bottoming points in a very long term uptrend for gold.
http://www.marketwatch.com/story/canadas-gold-sale-could-mark-a-long-term-bottom-2016-03-11
What will be the count for gdx compared to gold now? Given that gdx started going up later than gold? Can it be that gdx is in minor 2 wave now? Anyone? Thanks.
I think you mean intermediate 2.
However miners follow gold so if gold is entering minor 5 and goes up then GDX goes up.
Ok…. so if that is the case…. The next leg up for gdx will be intermediate 3 ( probably an extended wave) a stronger wave for GDX, and mnor 5 for gold ( probably a strong swiffed wave) would that be correct?
I don’t know which wave GDX is in. I just trade it and follow the gold count.
GDX appears to be in the same count as GDX.
This was dated March 9th.
The author says.
I have been looking for a 5-wave rally off the lows in the metals complex to take us to the 21-23 region in the GDX
https://www.elliottwavetrader.net/scharts/Charts-on-GDX-GLD-YI-201603061169.html
Is Gold Topping? Avi Gilburt EW March 9, 2016
http://www.gold-eagle.com/article/gold-topping
GDX can’t be in intermediate wave 3 as it would have had to have a huge correction down first and that didn’t happen.
There may be a timing difference between GDX and gold however they aren’t that far apart as gold intermediate wave 2 hasn’t even begun yet and intermediate are very big wave cycles.
Thank you
Now showing at your local theater: “Beginning of small wave 3 UP”
🙂
Gold :Flat-lining , singing “No-body cares for me”
MACD – GDX is a buy at 1, 3, 5, 39, minutes, good signs. Gold is a buy at 39, 78 minutes and maybe others now at 10:53 am? Gold is more bullish than GDX.
I will go all in at the 60 min macd cross, and above the 20 ema, nugt!!!
Sounds interesting. Please post when that happens. I’d like to buy some NUGT.
I think I see a wave 1 up first 5 wave count from the overnight low of 1225.79 at 9:12 pm Monday up to the 1238.18 at 8:37 am Tuesday. Then is that a correction 3 A-B-C down to 1228.24 at 9:46 am for wave 2 down?
I am hoping that is it too, except it starts at 1226 and finishes at 1236 for 1st wave, then an expanded flat for 2. Condition is now has to take out 1238 and not brake below 1226, or it will be just another 4 followed by 1 more final 5 … pfew
Ok will be looking for gold to go above 1238.
By the way I use this for my gold counts.
Live, real time gold in many time frames from 1 minute to 1 month.
http://www.pmbull.com/gold-price/
Or you are right and wave 1 is an expanding diagonal from 1225 to 1238? And wave 2 just happened at 1227 and now in wave 3 up already?
Yes I hope wave 2 down ended at 1227.64 at 11:24 am EST then wave 3 up began.
Hello 🙂 Lara, do we see impulsive waves up on the 1min or 5min chart yet from the low? Coz I am not completely sure… Well I am long now from 1233 abit but stop on 1229… I hope this is not another wave 4 up only… Anyway, bottom should be in or close if not… I also believe indeed gold won’t make it past 1300 this round with interm. 2 coming, but do not see interm 2 as such a deep retrace either as the commercials hope will be, maybe a 50% max retrace… Time will tell 🙂
Nvm moved stop at 1223 now this is some funky action… What do you think?
Great Bull market in ASX junior mining sector.
Here is one stock of several rose from AUD 0.40 to 1.50 since August 2015. May be Aussies led the way to put bottom in Gold??? AND Lara cought it in time to declared it.
Others: EVN,NST,SAR OGC, RSG,BDR,GOR,MML………and more
Beware COT still rules Gold with large commercial shorts very high!!!!
AGREE with Dreamer below.
GOLD and SILVER COT update – GET 30,000 COFFINS READY.
Watch the movie clip imbedded in the text. LOL!! My favorite.
“While the PM sector bulls have been working themselves up into a lather the Commercials have been piling up the shorts to a huge level, and since these guys are never seriously wrong, it means trouble, big trouble. If you go against them, especially at extremes, you are a fool. I have received any number of Emails in the recent past telling me that “It’s different this time” and that the COTs don’t matter etc,”
http://www.clivemaund.com/article.php?art_id=3750
A deep second wave correction will fit that prediction.
The thing about COT is it is accurate, but it does not pinpoint the turn.
While commercial shorts are piling up it does not tell us the market must drop right now. Only that drop it will.
It does point to a short sharp fifth wave up to finish intermediate (1) as more likely than an extended fifth wave.
Thanks Lara. That is why EW is very important to line up the market turn with wave counts.
One more fifth wave up to complete intc (1) and gold goes down in deep correction .
COT thinks they are the boss, but they are not.
Chart shows how gold’s rally is about to sputter
Mar 14, 2016 2:08 p.m. ET
http://www.marketwatch.com/story/a-pullback-for-gold-is-on-the-way-says-this-chart-2016-03-14?siteid=rss&utm_source=feedburner&utm_medium=feed&utm_campaign=Feed%3A%20marketwatch%2Ffinancial%20(MarketWatch.com%20-%20Financial%20Services%20Industry%20News)
I just need gold to spike up in minor 5 so I can sell at 1,295 or 1,335.
Then reverse my position to DUST as gold crashes with all the shorts out there. They think they are always right and one day they will be right at the top of minor wave 5, intermediate wave (1).
Lara the hourly chart shows the 2nd target as 1,338 however the text has, “If price keeps going up through the first target, the next target is at 1,335.” ?
Sorry Richard, I fixed the chart but not the text.
Target is 1,338
Minor 1 was only 2 days and it looks like GDX may be in a 4th wave triangle. This portends that Minor 5 will be over very quick, maybe a fib 3 days, then a large drop for Intermediate wave 2. Large Commercials short position also supports this.