
Upwards movement has unfolded exactly as expected.
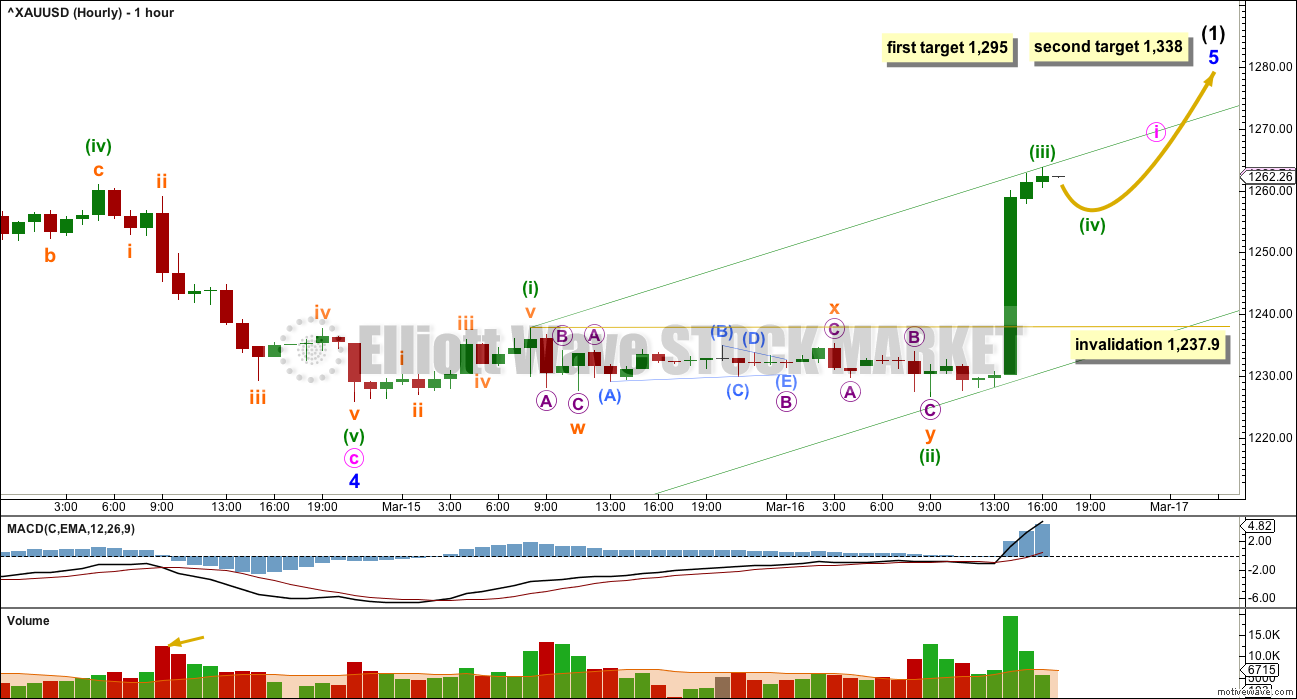
Summary: The first target for this upwards move to end is at 1,295. If price gets there and the structure is incomplete, or if price just keeps rising through the first target, then the next target is at 1,338. We have both trend channel and price confirmation above 1,260.93 that the last wave down is complete.
New updates to this analysis are in bold.
Last published weekly chart is here.
DAILY ELLIOTT WAVE COUNT
Click chart to enlarge.
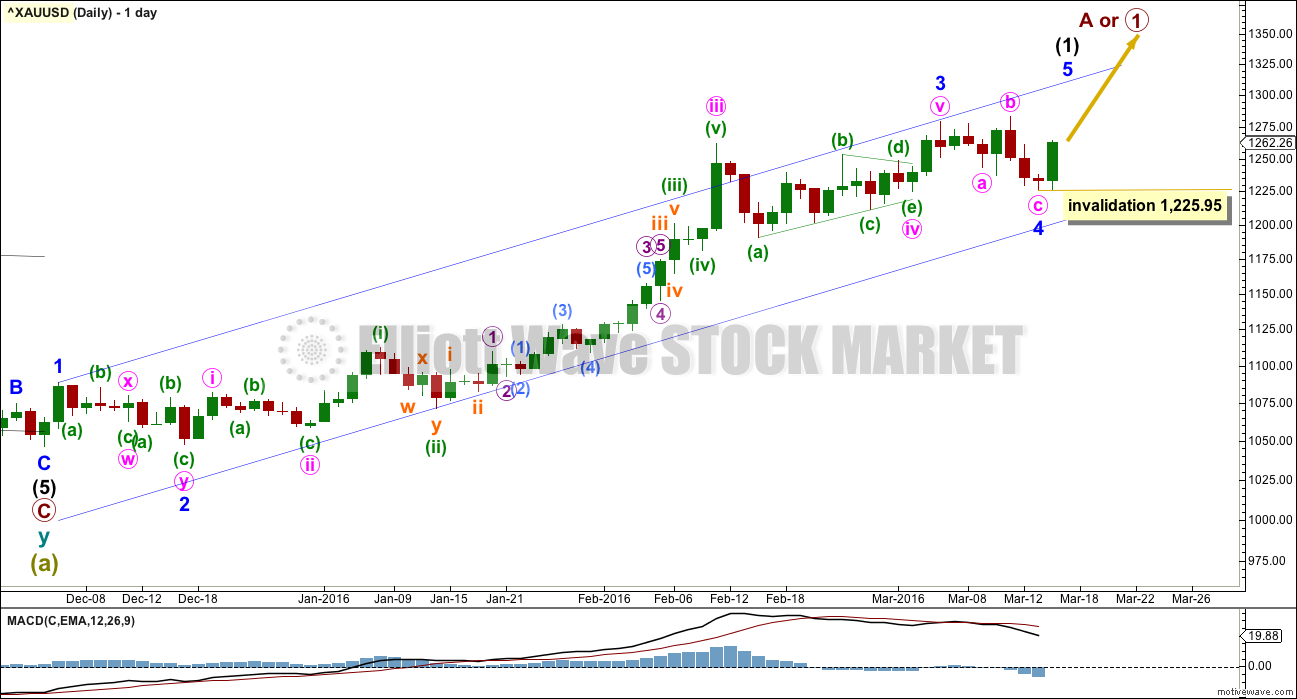
Gold has very likely changed from bear to bull.
So far, within the first five up, the middle of the third wave is now most likely complete. The strongest move may still be ahead. Gold often exhibits swift strong fifth waves typical of commodities.
Ratios within minor wave 3 are: there is no Fibonacci ratio between minute waves iii and i, and minute wave v is just 0.07 short of 1.618 the length of minute wave i.
There is perfect alternation between the deep double zigzag of minor wave 2 and the very shallow 0.23 expanded flat correction of minor wave 4.
Minor wave 4 is within the price territory of one lesser degree. Minute wave iv has its range from 1,261.94 to 1,190.9.
Upwards movement has confirmed that the last wave down within minor wave 4 is complete. The probability that minor wave 4 in its entirety is complete is high. Within minor wave 5, no second wave correction may move beyond the start of its first wave below 1,225.95.
Minor wave 1 lasted one day. Minor wave 2 lasted nine days (one longer than a Fibonacci eight). Minor wave 3 lasted fifty four days (one short of a Fibonacci fifty five). Minor wave 4 lasted seven days (one short of a Fibonacci eight).
At this stage, minor wave 5 may be expected to last either a Fibonacci five or eight days. It may be swift and strong but not necessarily extended. It is very likely to end with a strong upwards day on a volume spike.
HOURLY ELLIOTT WAVE COUNT
Click chart to enlarge.
It is very likely that minor wave 4 is over because the wave count has the right look with good proportions at the daily chart level. If it were to continue further as a double flat, it may begin to be out of proportion.
If minor wave 4 has ended here, then at 1,295 minor wave 5 would reach 1.618 the length of minor wave 1. If price keeps going up through this first target, or when it gets there the structure of minor wave 5 is incomplete, then the next target is the next Fibonacci ratio in the sequence. At 1,338 minor wave 5 would reach 2.618 the length of minor wave 1.
Minor wave 5 must subdivide as a five wave structure. So far within it the first five up of minute wave i is incomplete.
There is no Fibonacci ratio between minuette waves (i) and (iii) within minute wave i. This makes it more likely that minuette wave (v) will exhibit a Fibonacci ratio to either of minuette waves (i) or (iii). It would most likely be equal in length with minuette wave (i) at 11.31.
Minuette wave (ii) was a very deep 0.98 double zigzag. The time consuming part of the correction was a regular contracting triangle for subminuette wave x.
Minuette wave (iv) would most likely be very shallow; the 0.236 Fibonacci ratio at 1,255 is a reasonable target. It may not move into minuette wave (i) price territory below 1,237.9. Minuette wave (iv) may not be as time consuming as minuette wave (ii), and it should not show up on the daily chart as a red candlestick although it may show as a doji. It should be over within the next 24 hours. When minuette wave (iv) is complete, then a target may be calculated for minuette wave (v) upwards to complete the impulse of minute wave i. Because I don’t know where minuette wave (v) starts today this cannot be done yet.
If I am wrong, then minor wave 4 could be continuing sideways as a double flat or combination. This is possible, but the proportions of minor waves 2 and 4 on the daily chart look to be right as I have it labelled today. A continuation of minor wave 4 is an outside possibility; in my judgement, it has a very low probability. I do not want to give this idea too much weight by publishing it as a chart. I will publish an alternate only if this wave count is proven wrong by invalidation below 1,237.9.
TECHNICAL ANALYSIS
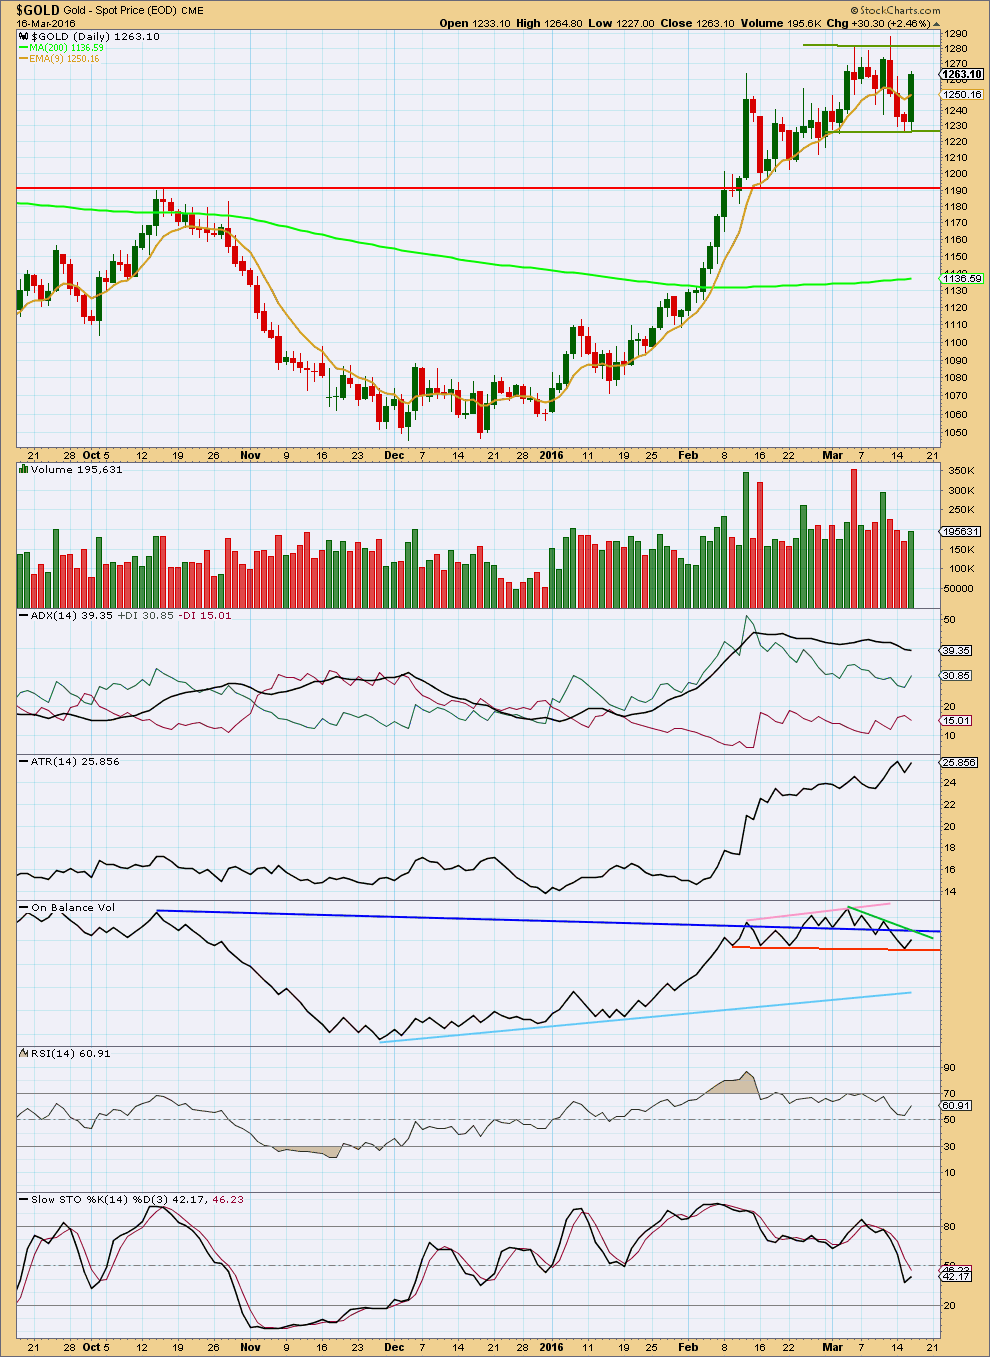
Click chart to enlarge. Chart courtesy of StockCharts.com.
A strong upwards day coming with an increase in volume supports the Elliott wave count which expects an upwards breakout. Price has not yet broken above the upper edge of this current consolidation zone. A break above the upper edge of this zone now delineated by green trend lines, on a day with increased volume, would be an upwards breakout. Likewise, a break below the lower edge on a day with higher volume would be a downwards breakout.
During this current consolidation it remains an upwards day with higher volume. This supports the Elliott wave count and indicates an upwards breakout is more likely than downwards. Volume tends to be a fairly reliable indicator of breakout direction for Gold.
ADX is today flat not indicating the market is trending yet. The +DX line remains above the -DX line, so a trend if it resumes would still be up.
ATR is today increasing, and has overall been increasing for about five days. This indicates the market is trending.
On Balance Volume found support at the short orange trend line. The strength of this line is reinforced, and it now has some reasonable technical significance. OBV may find some resistance at the green line, but this does not have much technical significance. The dark blue line has more significance. A break above that line would be a strong bullish signal. If OBV cannot break above that line, that would be a reasonable bearish signal.
Neither RSI nor Stochastics are extreme. Neither show divergence. There is room for this market to rise or fall.
This analysis is published @ 07:09 p.m. EST.
I still see one final fifth wave down is required to complete the correction for minute ii.
The target will be the 0.382 Fibonacci ratio at 1,254.
I am holding onto my buy position I opened a few days ago now at 1,235.46. I do not think minute ii will be that deep. It could be, and I could lose my profit, but I really prefer to not day trade. It’s too stressful. I prefer to set a position and hold for days or weeks preferably.
As we have not made a new high above minor 3 end yet this upwards move should have a fair way to go. So I’ll hold on.
Very good choice, I am thinking about giving up day trading too soon, it requires alot of work and stress and specially alot of my time… But the problem is sometimes I just cannot stay away, it is in my blood, I like it too much… lol! However with gold now will not risk miniswings, just restarted a small long position (I was also short today but with same small position compared to yesterday bigger long) and my plan is to continue buying on 1266+ or under 1253 if we make a WXY- will put some pending orders…. Stop at 1224,5, funny my trading platform shows a low at 1225.1 2 days ago. Also looking to get some silver and some ABX before the close… 🙂
Well, I re-opened my long position towards end of closing US markets today:
GLD April 15th $125 strike calls for $0.99…
I think by tomorrow when US markets open, minuette wave 3 should be on its way… will keep fingers crossed. And this time, I will not buy in and out and will ride minuette 3, 4, and 5…
/GC gold MACD is a sell for 1,3,5,15, 39, and 78 minutes
Also Gold already 5 minutes fired bearish at 1:50 pm 15 minutes fired bearish last 1 hour and 78 minutes just fired bearish a few minutes ago.
The means gold may turn around bullish overnight or tomorrow.
Understand it doesn’t mean gold is oversold like Wednesday morning.
Did you ever feel that suddenly the whole world is moving in SLOOOOW motion? That is the feeling I have now ,waiting for the SPX to drop and Gold to rise.
They’re rising together.
Their inverse relationship has ended it seems. They’ve decoupled.
That’s the problem with those relationships. They’re unreliable.
Hi, Stephen, I believe sp500 might get to at least 2060 and then 2075-2085 before the big drop. If not even 2120ish possible although I do not see it so far myself or put little chance for that, this is my opinion i kinda see wave 3up of V(or c of V) now forming… I am judging this also based on NDX100 not performing same but more rather as it did on the previous swing high 02-04.03 and on the german DAX which should make a new swing high little bit above today as that pattern there seems like a repeat of Draghi-FMOC release data. And gold maybe will make a new high soon together with the indexes going higher and will go down for some time at least together with the indexes … There is no more inverse correlation between them or direct, each got their own trends now … 🙂
It looks like minute ii may be close to completion.
Now remember also, this degree may be moved down one. This may be only wave A of a flat for minute ii, or it may be minute w of a double zigzag (more likely) for minute ii.
If it continues lower as a double zigzag to deepen the correction it may reach down to the 0.618 Fibonacci ratio.
This labelling is tentative, it does not mean minute ii must be over.
A new high above the start of minuette (c) on this five minute chart at 1,265.07 would be reasonable indication that this correction may be over.
That is because the most likely structure for minute ii to be if it continues is a double zigzag. Within a double zigzag the X wave should not be very deep. This is not a rule, this is my judgement based on experience.
Awesome, thanks Lara, just as I counted it !:) Hmm well guys, what does your TA indicators say? shall we bottom here or go sideways and lower to end min. ii? Mine are conflicting so don’t know but my fingers are itching for a long soon :)))
I really like that huge volume spike up for subminuette iv 🙂
With a volume spike for an upwards candlestick within the correction it looks like an upwards breakout possible.
But on the five minute chart I just don’t know how reliable that indicator will be. Probably not very. So I’ll not give it much weight at all.
Now it looks like a fourth wave triangle may be unfolding.
Time to watch some paint dry.
I still see minuette (c) as needing one final push down for the final fifth wave to complete the structure.
Ok i totally see an (a) from 1271 to 1261 , a (b) triangle to 1265 and now 4 of 5 already of the (c) to end soon min. II or just wave A or W , waiting for Lara to confirm, anyway I am closing shorts as we speak lol… 🙂
I am adding longs, with latitude for further drop (if it comes) but confident of Laras call and expertise.
Minute wave i now ha a very good five wave look to it.
This downwards move this hour is minute wave ii.
Invalidation point on the hourly chart must be moved down to 1,225.95.
The 0.382 Fibonacci ratio is at 1,254.
The 0.618 Fibonacci ratio is at 1,243.5.
Either is a reasonable target for minute ii to end
I do not think minute ii is over this quickly. If it is over here it would be quicker than minuette (ii) one degree lower.
Now looking at the five minute chart to see if minute ii could be over.
In the 15 min chart seems that we need another leg down 1256 to complete a double three with x wave as triangle…. Is it correct?
The FAT LADY is singing at the NYSE as the S&P 500 has most likely toped by filling in its Gap at 2044 plus. Therefore the BOT’s who buy gold when the SPX drops are waiting to execute that spread trade when the DJIA and SPX begin dropping. IMHO.
2:36 pm Gold may be ending minute ii right now as just dropped parabolic big drop in a few minutes.
Good morning.
And it looks so far like light volume for this last hour.
Yes I’m thinking this dip just now may be an opportunity to join the trend up to 1295 or higher. Or else buy the low before the close.
Not so fast there…. I don’t think it’s quite done yet.
Let me look at the five minute chart
This first wave has been fenomenal. (Anyone else think we’ve reached end of Minute I?) I’m now looking for Minute II end to enter Nugt. Lara, are you here??
I’m going to guess (like Dorian) that minute 1 ended at 1271, and it seems like minute 2 is a shallow correction…
I was hoping it would retrace 38.1 or 50%, but doesn’t look like that’s happening…
Will wait for Lara’s update…
And yes minute 1 was great, hoping minute 3 and 5 have at least the same octane…
Yes, maybe a shallow re-trace 23.6 or 14.4, maybe not. Lara did say these big days like yesterday tend to retrace a lot. Thanks for your response. I’m waiting too
Hi everyone.. I am new here. I think that minute wave 1 is over too.
But, was just thinking that minute wave 2 might retrace quite a bit. Most of the wave 2s seem to be retracing a lot..
Good morning. I’m here
Gold price appears to be finding support at 1261-60 (probably a good place to go long on it?) Unless a break below there occurs to test pivot/5dma…. ? Probably better off waiting for NY Globex to open to see how this goes….
Hi Lara,
Silver analysis doesnt want to open for me.
would i have to pay extra money for that?
Silver analysis is available to Grandfather members, Gold Plus members and Oil & Silver members.
If your membership is Gold only then yes, you have to sign up to Gold Plus.
But if your membership is Gold Plus or you have been here a long time and are on a Grandfather rate then no, you should have access.
We’re checking the permissions on that post now because you are the second member who has a problem.
i allways could watch silver and oil too with my goldmembership.
since my last renew i cant anymore.
is it cause i had a 2 week interruption. i had to order the membership again cause my bankaccount was not covered with money.
if that is the case im very sad cause i am here since about 3 years.
I think it may be if payment doesn’t clear then they try again a few days later and if it doesn’t clear the grandfathered price is over.
This site will clarify this, check membership details. Best wishes.
I just got 33% profit for a trade I didn’t know I made. That is a very pleasant surprise.
I had placed a bid for NUGT Monday but missed the close by 3 seconds. I thought it would expire overnight and forgot about it. Turns out I bought NUGT at the Tuesday open at $54.19 and just found out about it this morning and sold NUGT at $72.47 at 10:11 am for 33% profit in 2 days. First time that’s happened. I’ll follow up before the open next time, meanwhile, I’m laughing all the way to the bank about this. Best trade I made in awhile, LOL
Lol, gz, last night i made 100$ just for trading some small position in gold bought in 1255 and sold in 1268, stop was all way down in 1224, had lots of pendings too in 1242-1245 just in case they decided to drop gold overnight again but naah 🙂 position got filled and exited during my sleep! Not bad, right? :))) Now I am looking if this is really minute ii down or is minute i extending further… In silver it made a new high today and no divergence yet but gold has negative divergence on 1hour chart on RSI, STS MACD, what do you think?
Gold is a wild trade, however silver is gold on steroids for a even wilder trade.
I just checked Silver MACD 195, 78, 39 and 15 minutes and still BUYS, it may have been oversold and now buyers continued getting in even strong this morning. 15 minutes is weakening.
However gold those times started to get weak yesterday turning into sells this morning except 195 minutes.
Yea thx, i got out of silver at 16, waiting to see the retrace what shape it forms, and am short abit on gold too now … target 1255 🙂
Gold / Silver ratio is almost at a 10 year high
https://www.kitco.com/Gold_Silver_Ratio_Charts/gold-silver-ratio-charts.html
At the bottom of intermediate wave (2) may be a good time to invest in Silver or even GDXJ as it does contain some silver mines and does well when silver or gold does well.
Strange that from the mid January low to the February high gold went up 17% and silver went up 16%. One would think silver would of outperformed gold.
Also strange that from the mid January low to the February high GDX outperformed GDXJ. GDX up 58% GDXJ up 55%. I guess that GDX was just a more popular and less risky buy for many including the institutional buyers who are not allowed to buy into junior miners.
Interesting observations indeed. I would have thought if gold went from 1050 to 1250, silver would go from 14/15 to 22/23… but that’s not what’s happening
Silver analysis seems that cannot be accesed, page does not open … Thanks
Hi. Silver analysis is opening for me.
It’s ok, working now… 🙂
Hi Lara what kind of retrace do you expect for minute ii of minor v now? I think it already started. Confirmation if it takes out 1254 and goes lower? Maybe a 61,8% or not that much? Thx:)
Lara: Your EW S&P March 16 video is not current and it is from old date when SPX was below 2000.
Thanks.
Fed gives gold bulls a reason to cheer, for now – Mar 16, 2016 4:49 p.m. ET
Policy makers scale back outlook for interest-rate increases from 4 to 2 for 2016
http://www.marketwatch.com/story/fed-gives-gold-bulls-a-reason-to-cheer-for-now-2016-03-16
Continued low or negative rates around the world, coupled with a higher-than-usual risk environment, could plausibly nudge gold back towards’ the $1,400 level.
Katrina Lamb, MV Financial
Thank you Lara for the day’s analysis…
My question is this: Is there a possibility that what is labelled as minuette (iii), be in fact end of minuette (v), and end of minute wave i?
Possible. But highly unlikely.
Even for Gold that move would look too strongly like a three and not a five.
On the five minute chart it doesn’t look very good.
And as I type Gold is making new highs, I think the market has answered. The fourth wave is over. A fifth wave up is underway.