
A little more upwards movement was expected to end about 1,245 – 1,247, and then a small wave down was expected. Price turned at 1,248.44.
Summary: The target for a short fifth wave up is at 1,261. If this target is wrong, it may be too low. On the way up, a new high above 1,248.44 would confirm the fourth wave triangle as complete and a fifth wave up underway.
New updates to this analysis are in bold.
Last published weekly chart is here.
DAILY ELLIOTT WAVE COUNT
Click chart to enlarge.
Gold has very likely changed from bear to bull.
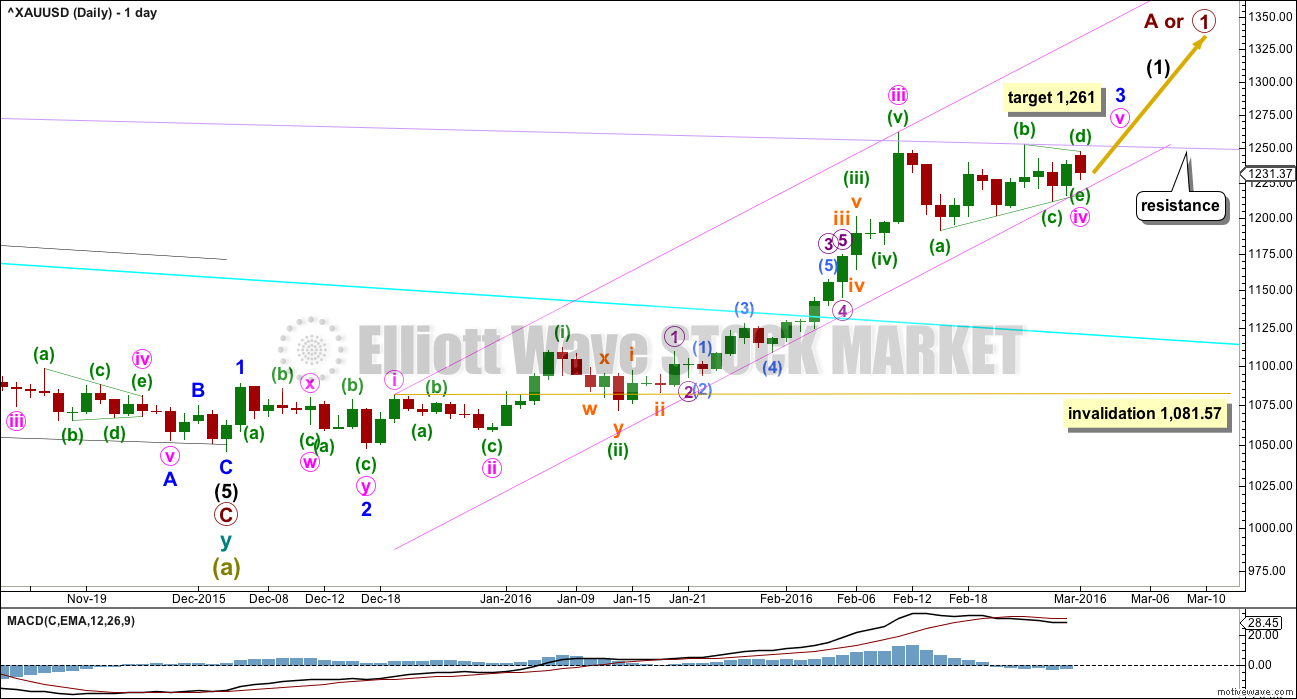
So far, within the first five up, the middle of the third wave is now most likely complete. The strongest move may still be ahead. Gold typically exhibits swift strong fifth waves to end its third wave impulses. Look out for surprises to the upside for minute wave v and minor wave 5.
Minute waves i, ii and now iii are complete within minor wave 3.
The pink channel is a best fit. Draw the first trend line from the highs labeled minute waves i to iii then place a parallel copy lower to contain the whole upwards wave. Minute wave iv may find support at the lower pink line. If price touches that line, it should offer a low risk entry point to join the upwards trend.
The main hourly wave count now expects a triangle may have completed today in a total Fibonacci thirteen sessions. Upwards movement is finding resistance at the lilac line and downwards movement is finding support at the (a)-(c) triangle trend line. To see how to draw the lilac line see the weekly chart here.
Gold often exhibits very short quick fifth waves after its fourth wave triangles. At 1,261 minute wave v would be short and only equal in length with minute wave i.
If the alternate hourly wave count is correct, then the lower pink trend line may be breached. Sometimes fourth waves are not contained nicely within channels; sometimes they breach channels.
Minute wave iv may not move into minute wave i price territory below 1,081.57.
MAIN HOURLY WAVE COUNT
Click chart to enlarge.
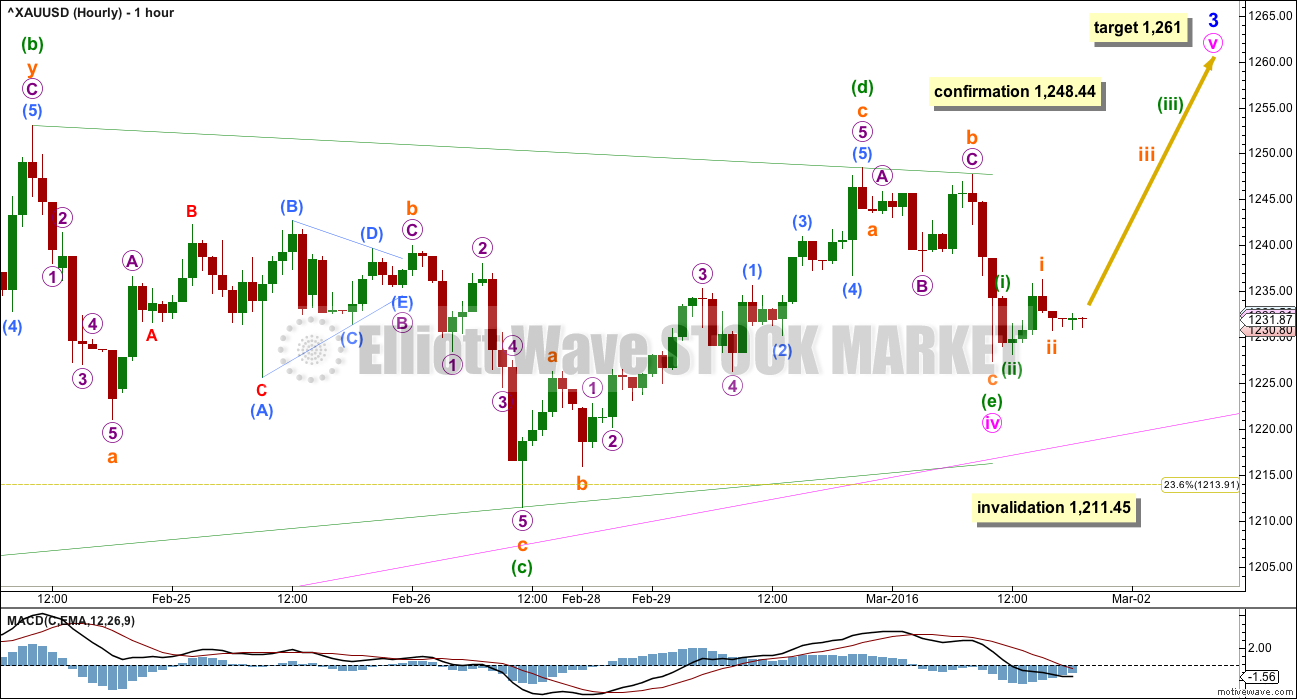
This main hourly wave count expects to see alternation in structure between the zigzag of minute wave ii and the triangle of minute wave iv. This is the main wave count mostly for this reason.
Minuette wave (b) will only subdivide as a double zigzag within the triangle. Only one of the five subwaves of a triangle may be a double zigzag and all other subwaves must be simple threes. Minuette wave (e) may not continue lower as a double zigzag.
If the labelling of minuette wave (e) is correct, then it should be over. If the labelling of minuette wave (e) is wrong (it may be that only subminuette a is complete), then it may not move below the end of minuette wave (c) at 1,211.45.
There are two completing tendencies for minute wave v upwards. This is a fifth wave to end minor wave 3. Fifth waves to end Gold’s third wave impulses are often very strong and extended. However, Gold usually exhibits surprisingly short fifth waves to follow its fourth wave triangles. It is my judgement that minute wave v is more likely to be short as it follows a triangle for minute wave iv, than it is to be a long extension.
If the target at 1,261 is reached and the structure is incomplete, then more upwards movement should be expected. If price keeps rising through the target at 1,261, then the next target is at 1,316 where minute wave v would reach 1.618 the length of minute wave i.
A new high above 1,248.44 would invalidate the alternate below and provide price confirmation that minute wave iv is over and minute wave v is underway.
ALTERNATE HOURLY WAVE COUNT
Click chart to enlarge.
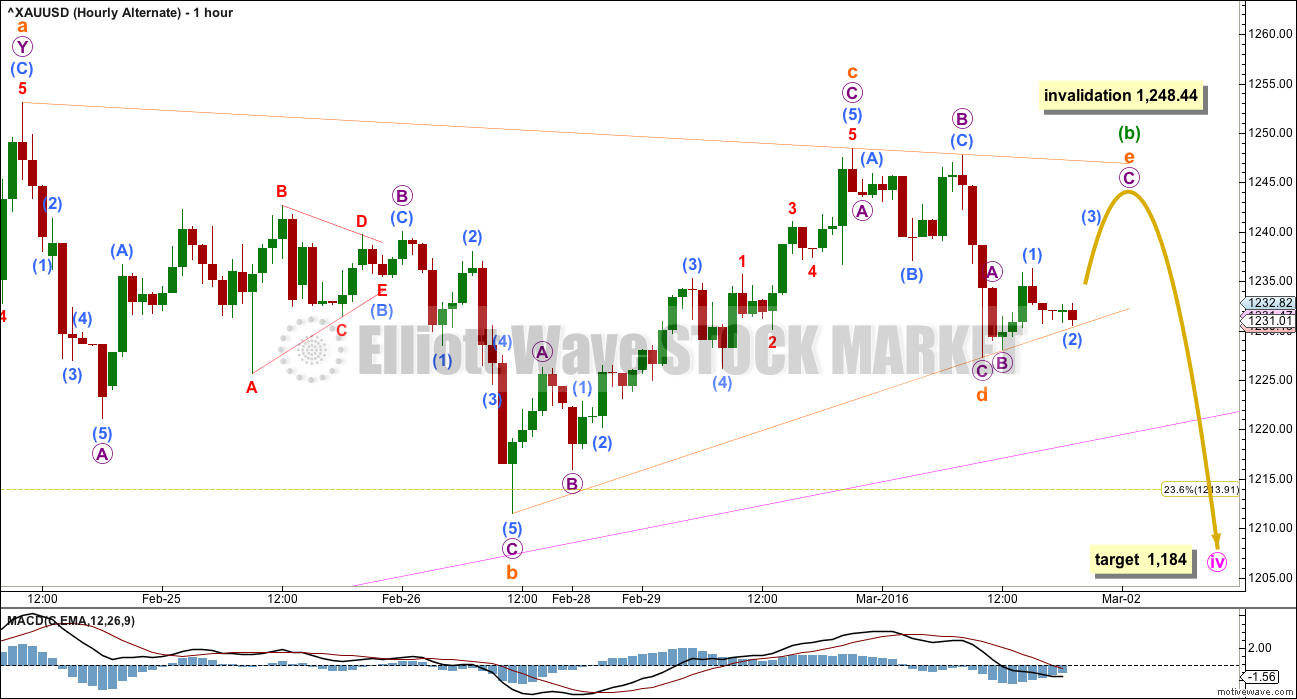
Minute wave iv may be continuing as a zigzag. This would offer no structural alternation with minute wave ii which was also a zigzag. For this reason, this must be an alternate wave count with a lower probability.
At this stage, if minute wave iv is continuing as a zigzag, then minuette wave (b) within it may be a triangle. This wave count no longer has the right look at the daily chart level. A single zigzag for minute wave iv should not have taken this long to unfold and it would be much longer in duration than the single zigzag for minute wave ii which lasted seven daily candlesticks. While a triangle could be expected to be longer lasting a zigzag should not be.
This wave count has a low probability, but alternates should always be considered for triangles. A new low below 1,211.45 would invalidate the main hourly wave count and confirm this alternate.
At that stage, minute wave iv may be expected to end about the 0.382 Fibonacci ratio at 1,184.
Within the triangle of minuette wave (b), the final wave for subminuette wave e may not move beyond the end of subminuette wave c above 1,248.44.
TECHNICAL ANALYSIS
Click chart to enlarge. Chart courtesy of StockCharts.com.
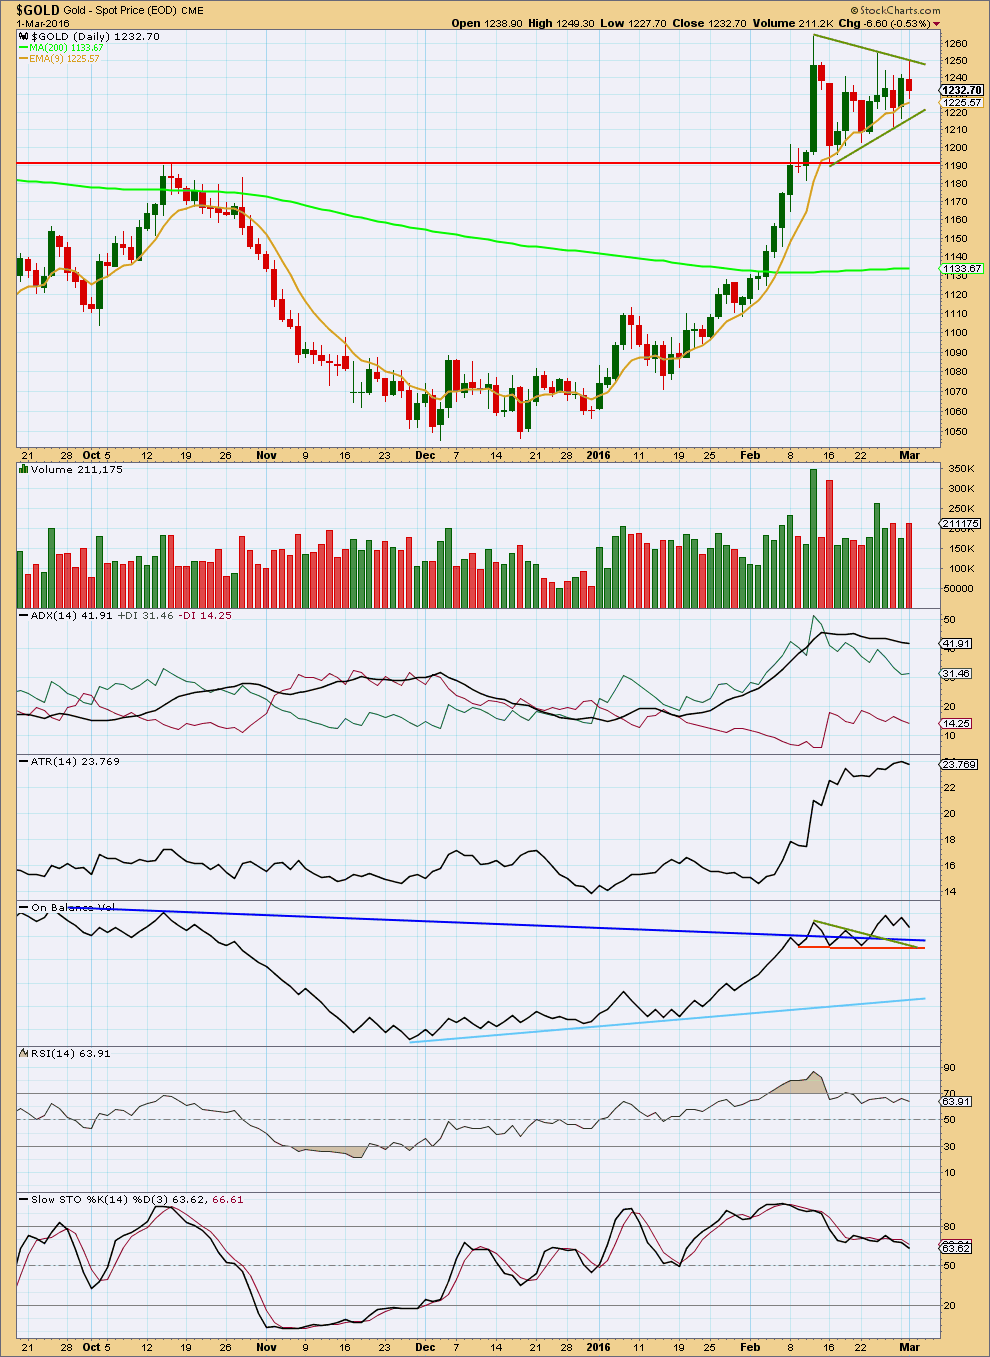
A triangle pattern looks to be forming. The trend lines are drawn across the top and bottom of the pattern. This is a fairly reliable continuation pattern. The breakout should be up. If price breaks above the upper green line on a day with an increase in volume, that would be a classic breakout from this pattern.
A decrease in volume now overall for the last few days again gives this consolidation a more typical look.
ADX is flat to declining indicating the market is correcting. ATR is now flattening off, so it now agrees with ADX.
Apart from the outlier of 16th February, highest volume is for an upwards day. The 16th of February may include data for the holiday session of 15th February for which there is no daily candlestick in StockCharts data. If this candlestick for 16th February is ignored, then the breakout direction indicated by volume should be upwards.
If the volume for the daily candlestick of 16th February is taken into account. then the breakout direction indicated by volume should be downwards.
On Balance Volume may be providing an early indication. It has broken above all of its trend lines. OBV is often a reliable early indicator for price. This supports the Elliott wave count.
RSI is neutral. There is plenty of room for this market to rise or fall. Stochastics has returned from overbought.
This analysis is published @ 08:28 p.m. EST.
Avi – Gilburt EW – Can Silver See A Lower Low Without Gold and GDX?
Wednesday March 02, 2016 13:59 First published Sat Feb 27 for members of ElliottWave
http://www.kitco.com/commentaries/2016-03-02/Can-Silver-See-A-Lower-Low-Without-Gold-and-GDX.html
Includes Elliott Wave charts of GDX, GLD and Silver
GDX Elliott Wave chart from February 20th article –
Intermediate wave 1 target is $23.29
Intermediate wave 2 target is the $17 area
https://cdn77.elliottwavetrader.net/images/charts/201602/full-SgS7kGym6Q311VKx6pY62.jpg
What Are The Probabilities For Lower Lows In Gold And Silver? – February 21, 2016
Avi Gilburt – EW
If it keeps going higher then it should find very strong resistance at the upper triangle (b)-(d) trend line. Triangles normally adhere very well to their trend lines. And it’s actually rather common for those lines to be touched and tested while the triangle unfolds.
This upwards move looks still too weak to the be breakout of the triangle. MACD looks too much below the last high of minuette (d) even though price is now fairly close to that point.
It looks like minuette wave (e) will end minute iv Thursday at about 1,221.
I’ll buy GDX back there for minute v $34 rally up then sell it. Unless GDX drops hard down to 18.52 Tuesday’s low today. It did hit an after hours low of 18.38 at 8:20 am today.
there is now a bearish engulfing candlestick pattern on the hourly chart, and the structure of subminuette b is complete.
a trend line from across the bottom of this upwards move may now be breached
so now I can use the ratio between A and C to calculate a target for minuette (e) to end. C = A at 1,220.
so that’s the target now for this big triangle to end.
it should reach that within 24 hours.
Thursday the day then to buy miners for the last quick run up $34, in a while. Then minor wave 4 heads south for Spring break a week or maybe several. That may get the gold bears excited again.
Just a reminder to everyone…
Friday the U.S. reports non-farm payrolls at 8:30am EST
(with the fabulous E.W. here, we have our map!)
That may be the excuse needed for Gold to thrust up out of this triangle.
Here’s a warning to our more inexperienced members about those highly volatile moves markets do on “news” releases:
Price often moves swiftly and strongly about the time of the release. The move in the first direction is almost always retraced mostly or fully in the opposite direction. Temper the feeling of missing out when markets do that. Be a little patient, know that the first strong move is likely to be reversed.
If the EW count here is right then the move on the release of Non Farm Payroll on Friday may cause Gold to thrust up very strongly. This may be a first wave, they often are very strong. Then price should reverse for a deep second wave correction.
Jumping in right at the end of the first wave would be a common mistake, watching markets do that you feel left out and want to join the trend.
Wait for the reversal and join the trend there.
But here’s the thing about that psychology. When it reverses you’re joining the larger trend on a correction, and when you open a position you’re opening it while price is going against you. That is one of the hardest things to do in trading. Psychologically you’re feeling that you’ve missed out, and now you’ve gotten it wrong.
This upwards move looks like a B wave.
What it does not look like is a thrust out of a triangle. They are usually very clear and strong. This upwards move lacks strength.
So I’ll still be expecting a new low below 1,224.7 but not below 1,211.45.
When it’s clear this B wave has ended (when it has a corrective count and breaches a lower trend line providing support) then I’ll use the ratio between A and C to calculate a target within that rather wide zone.
I can’t do that yet.
Triangles take their time. I had expected this one to end in a Fibonacci 13 sessions but it has not.
It is very close though.
Can anyone properly define this move in gold…??
I think that at 9:52 am EST the high of 1241.86 that ended subminuette wave b.
Then started down subminuette wave c of minuette (e) of minute wave iv of minor 3. I think from that point at 9:52 am we need a five wave down to end at about 1,221.
The upwards move now has a corrective count of seven.
And so it could be over here.
Now C down to complete the larger more time consuming zigzag for minuette (e). And then it should finally be done!
I just sold my GDX at a small profit over yesterday.
As per EW gold needs to drop back down to 1,221 before going up $34
Gold is in an Zizzag and needs to complete an A-B-C before going up $34
Right now it is near the top of a B wave and then drop in a C wave down to 1221 then $34 up
I already sold minutes ago for a profit the GDX I bought near Tuesday’s low.
The B wave may or may not be over, however close is good enough selling at a profit so can buy again for less today.
Today I buy GDX back at 1221 gold and sell it up $34 at 1255 or $34 above the next gold low.
B wave is undergoing its way…waiting for a new low to buy
I’ve been waiting for one more low to complete a corrective wave count lower. It is late now in NZ and I can’t wait any more. I’ve set an order to open a buy at 1,221, stop just below 1,211.45.
This hourly chart is an update. The cyan line is a best fit, but it’s really not that good.
So far to the downside I count a complete five. If that count is right then minuette (e) should be incomplete. At 1,221 subminuette c = 0.382 X subminuette a. That seems a reasonable target because it would still see minuette (e) fall short of the A-C trend line, which is the most common place for the E wave of a triangle to end.
Whereever E ends up add about 34 to that point for the target. That target is the first target; when price gets there if the structure is incomplete then another higher target may be used. Or if price just keeps rising through the first target then another higher target may be used.
Lara will you be doing an update on GDX anytime soon?
Probably not.
I am sorry for it. I just simply cannot find the time.
Lara, just my observation as a long term member, it seems that many members on this site have an interest in trading the miners, like GDX and the 3x etf’s like NUGT, etc. While there is a high correlation with gold and one can trade the miners based on the Gold EW, it sure helps to see the EW of GDX on a regular basis. You have been generous to provide us with GDX updates every month or two and I’m sure that it’s a challenge to find the time to do that.
I have a proposal… What if you were to alternate Silver and GDX every other week? I could be wrong, but based on comments and requests, it seems that GDX EW is valued by members at least as much as Silver, if not more. Silver posts do help to often clarify or confirm Gold counts, but based on the comments, it seems that not too many members actually trade Silver? Silver posts rarely have any significant number of comments. This option may provide a benefit to more members and will also fit within your schedule and not require you to find the extra time to provide the “bonus” GDX analysis.
I realize that this would require a change to your TOS, but I think it may be a great compromise. Maybe you could survey members if you are unsure of the impact. Thanks for your consideration. ? ? ?
I agree, Silver doesn’t seem to be popular. I did have requests for it some time back hence the decision to provide it regularly once a week.
Now I have a few members paying for Silver once a week, so I’d have to ask them.
My problem (and it’s a big one) with regular analysis of GDX or any other smaller market is it just doesn’t have the volume for a solid Elliott wave analysis. GDX exhibits truncations all over the place, it’s waves don’t have a typical look at all.
Volume on GDX is too light for me to have enough confidence in Elliott wave analysis of it to make it a very regular thing. If I made it very regular members would (some may anyway) begin to rely on it and use it. And invariably my accuracy rate with it is likely to be pretty poor. And members would lose money. And I’d take the heat for it.
So no, I don’t want to go there.
OK. Thanks for the reply.
Thanks Lara, I also appreciate the hard work at such a critical juncture.
And now with a slight new low below 1,227.30 minuette (e) cannot be over.
It now needs to complete as a three wave structure. So far down there is a five. It needs a B wave up, then a C wave down. Minuette (e) may only be a zigzag, it has to have a corrective wave count. That is 3, 7, 11 etc. adding multiples of 4. It looks like it should be 7.
It is still likely to fall short of the (a)-(c) trend line.
The target at 1,261 must be revised down. Minute wave v is likely to be either 34 or 55 in length.
Thanks a lot for the after hours comment.
No worries. I’ll be watching this tonight, if I see minuette (e) again possibly complete I’ll publish a chart short term.
The closer to 1,211.45 it gets the lower the risk for a buy entry.
Lara heartly thanks for your hardwork..