
A little downwards movement to 1,238 was expected before upwards movement. This is not quite what happened.
Price did not move any lower, but it did move higher to complete a small green doji.
Summary: I have three wave counts today. None see minor 5 as underway and two see minor 4 continuing sideways, which is most likely. The third least likely wave count sees intermediate (2) down beginning. In the short term, all expect either sideways or upwards movement.
New updates to this analysis are in bold.
Last published weekly chart is here.
MAIN DAILY ELLIOTT WAVE COUNT
Click chart to enlarge.
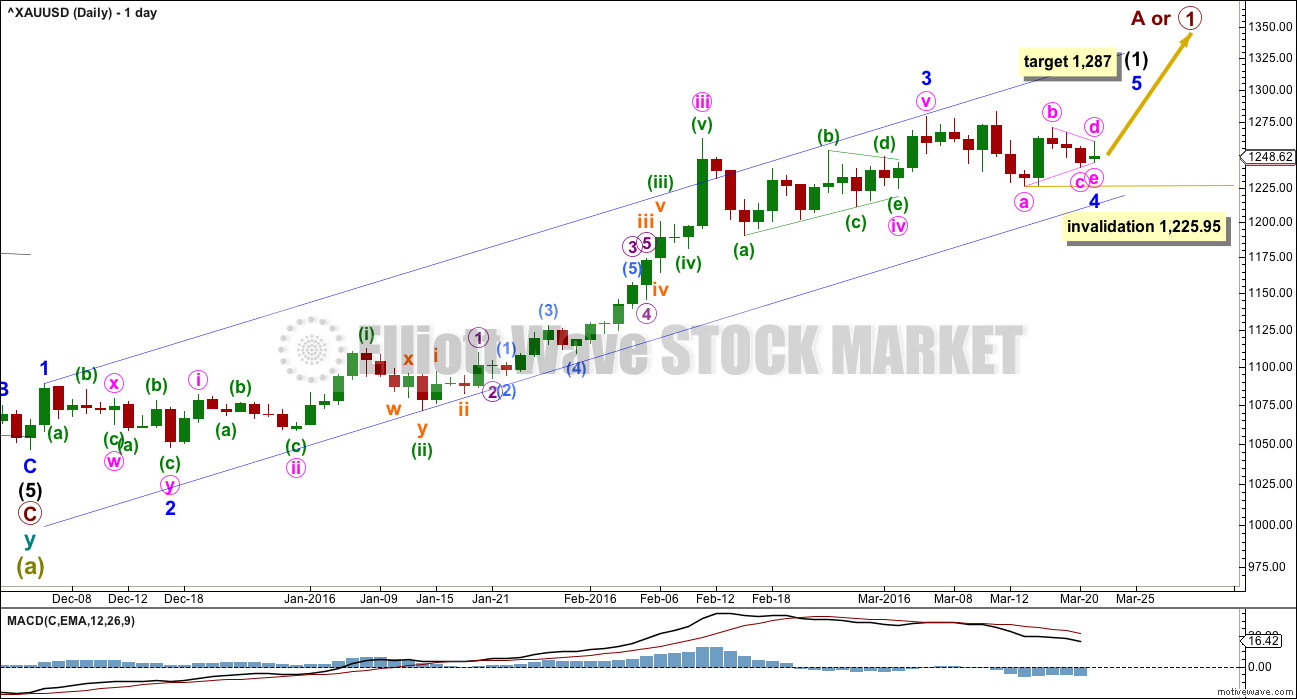
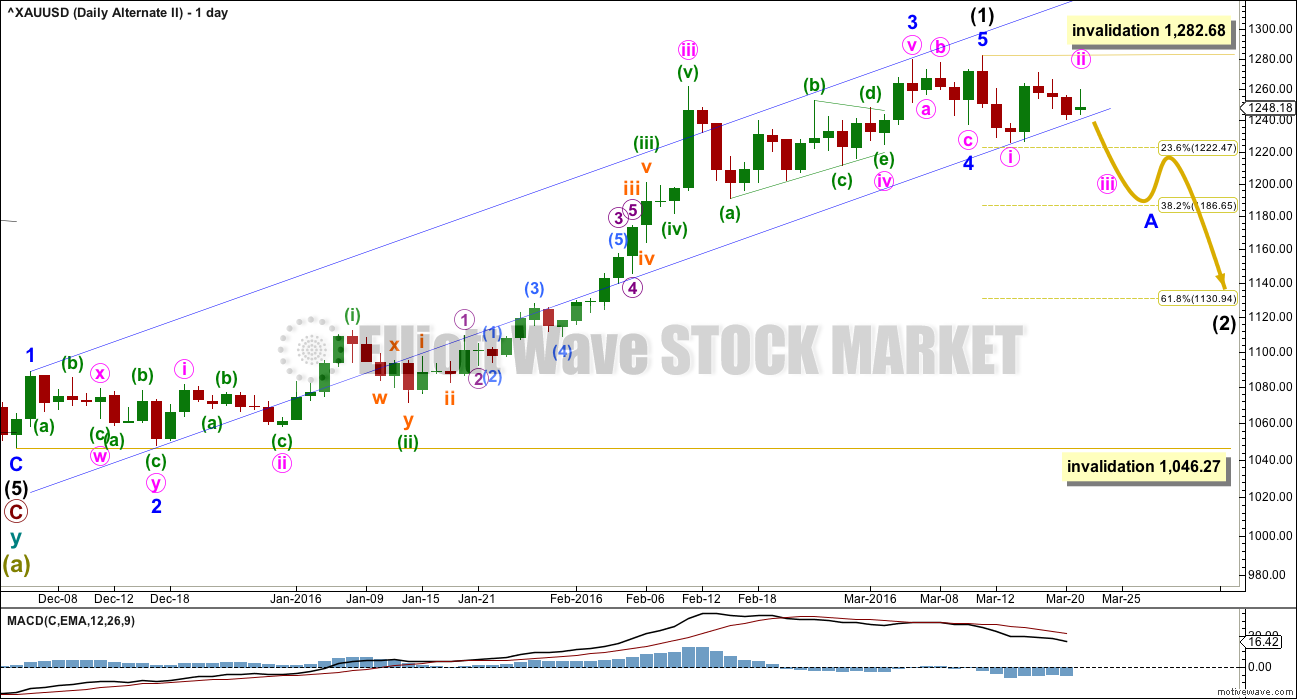
Gold has very likely changed from bear to bull.
So far, within the first five up, the middle of the third wave is now most likely complete. The strongest move may still be ahead. Gold often exhibits swift strong fifth waves typical of commodities.
Ratios within minor wave 3 are: there is no Fibonacci ratio between minute waves iii and i, and minute wave v is just 0.07 short of 1.618 the length of minute wave i.
Sideways movement does not fit as a new upwards impulse, so minor wave 4 may be incomplete. It is either a triangle, double flat or double combination. This first main wave count has a better fit at the hourly chart level, so a triangle is more likely.
Minute wave c, if it is incomplete and moves lower, may not move beyond the start of minute wave a below 1,225.95 within the triangle of minor wave 4.
The triangle may be very close to completion. Gold often exhibits surprisingly short fifth waves to follow its fourth wave triangles. At 1,287 minor wave 5 would reach equality in length with minor wave 1. Minor wave 5 is likely to move at least slightly above minor wave 3 at 1,279.45 to avoid a truncation.
Minor wave 5 may be very quick lasting only one or two days. When it is complete, then intermediate wave (1) in its entirety would be complete and intermediate wave (2) downwards should be expected to unfold over several weeks.
HOURLY ELLIOTT WAVE COUNT
Click chart to enlarge.
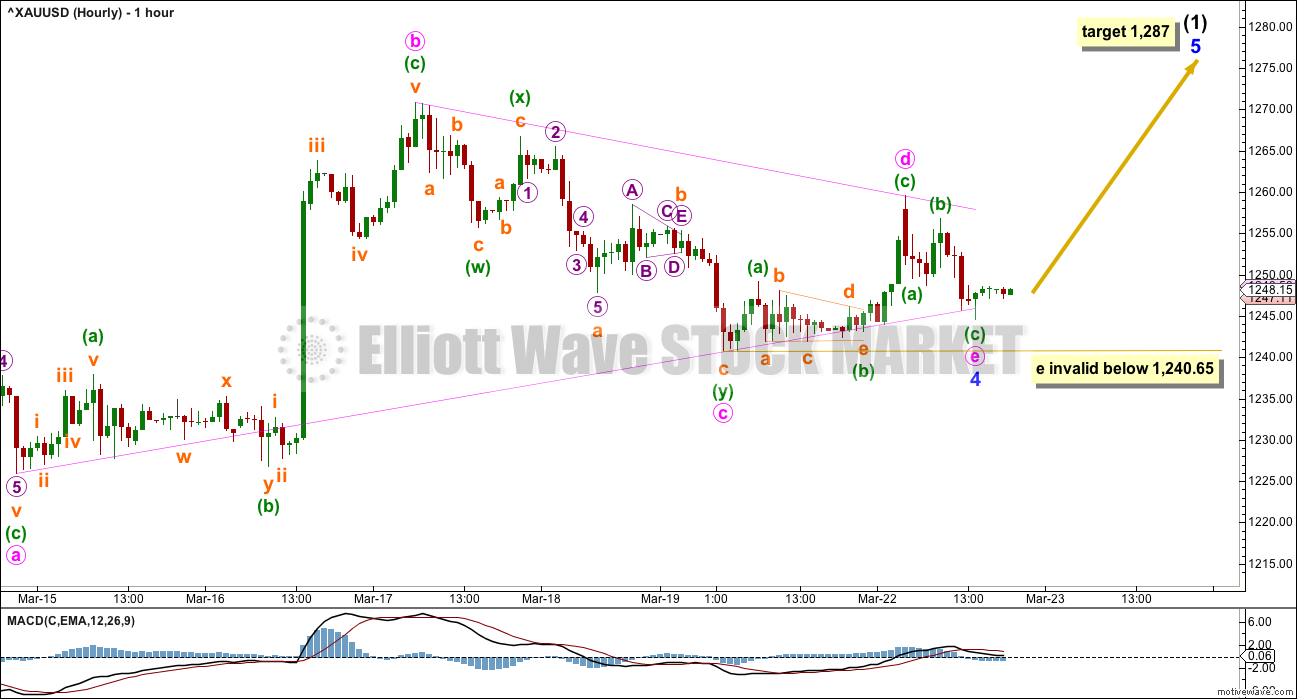
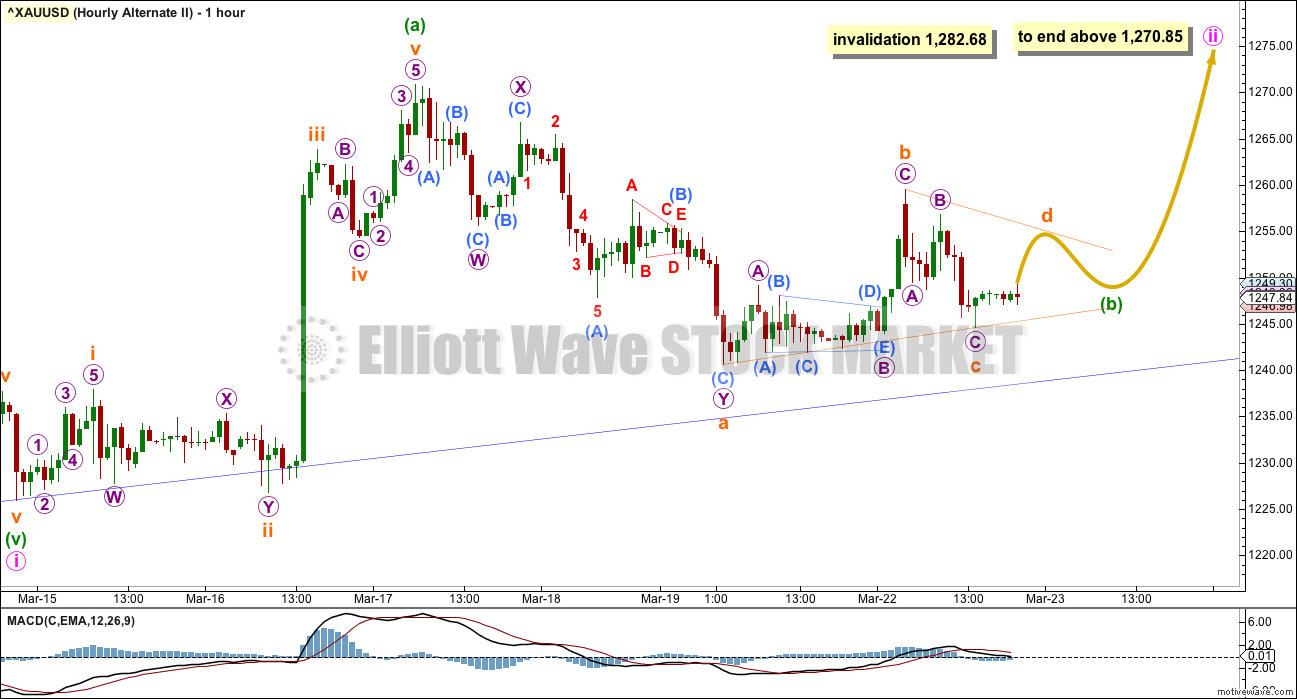
If minor wave 4 is a triangle, then it may be complete.
Four of the subwaves within the five subwaves of a triangle must subdivide as single or multiple zigzags. Only one subwave may be a multiple zigzag and all subwaves must be threes. In effect, this means that one subwave may be a three which is not a single or double zigzag but may be a flat correction. Minute wave a is seen as an expanded flat correction. This is slightly unusual in my experience, but it meets the rules for a triangle.
Minute wave b upwards is seen as a single zigzag.
Minute wave c downwards will only fit as a double zigzag. This movement will absolutely not fit as any other Elliott wave structure and meet all rules.
Minute waves d and e must be single zigzags because minute wave c is a multiple. They may be complete.
However, this does look like too brief an end to the triangle. It may continue as a nine wave triangle to take up more time. I have seen one nine wave triangle which in hindsight could not be any other structure and included one subwave which was a double zigzag, so this is possible.
Minute wave e may not move beyond the end of minute wave c below 1,240.65.
This wave count expects to see a short sharp thrust up and out of the triangle towards the target. The movement should be surprisingly brief and short, lasting only about one or possibly two days.
FIRST ALTERNATE DAILY ELLIOTT WAVE COUNT
Click chart to enlarge.
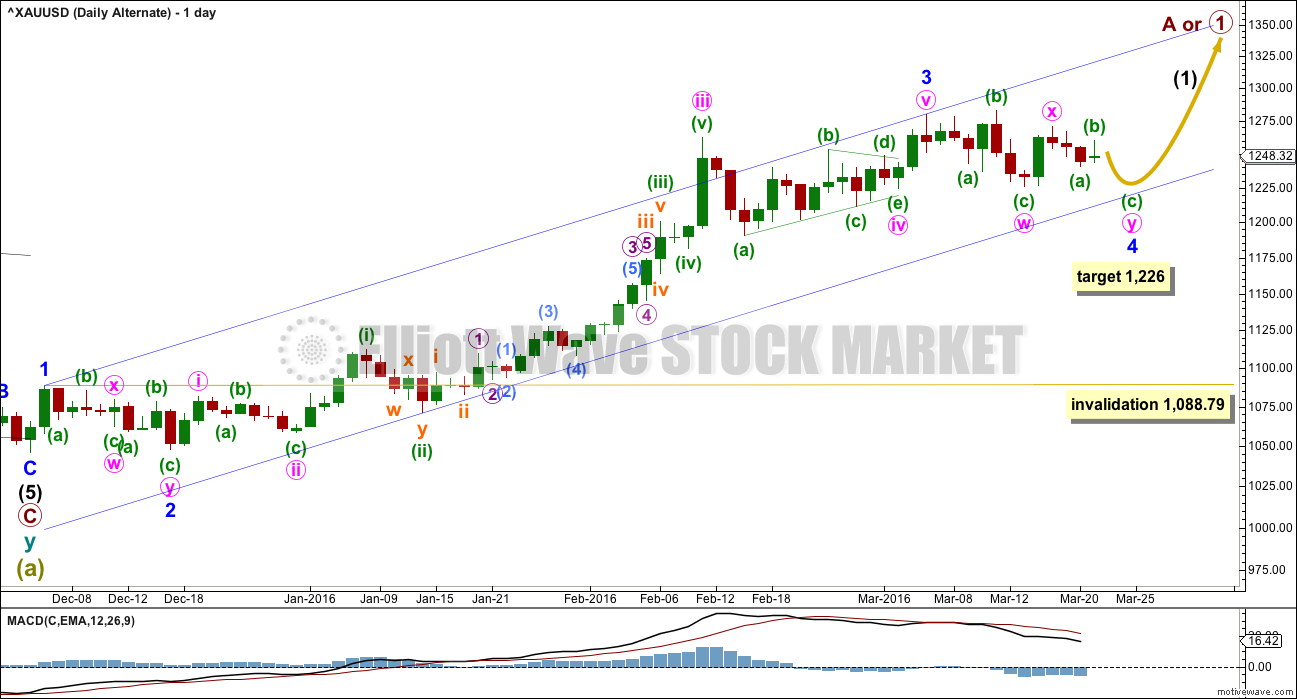
I have learned the hard way to always consider an alternate, usually a combination, when a triangle looks to be unfolding or even complete. Too many times I have seen what looked like a perfect triangle complete only to see it invalidated shortly after.
Minor wave 4 may be continuing as a double flat correction. The first flat in the double is an expanded flat labelled minute wave w. This is identical to what has been the main wave count up until today, only the degree of labelling within minor wave 4 is moved down one degree to see the flat as only the first in the double.
The double is joined by a three, a zigzag in the opposite direction labelled minute wave x.
The second structure in the double may either be a flat correction for a double flat, or a triangle for a double combination.
Double flats and combinations both move sideways. They do not have slope against the prior trend. To achieve this sideways look the second structure in the double normally ends about the same level as the first. Minute wave y may be expected to end about 1,226.
Technically the invalidation point must be placed at the high of minor wave 1. Minor wave 4 may not move into minor wave 1 price territory below 1,088.79. However, in practice a reasonable new low below 1,226 would see this wave count discarded on the basis of no longer having the right look.
ALTERNATE HOURLY ELLIOTT WAVE COUNT
Click chart to enlarge.
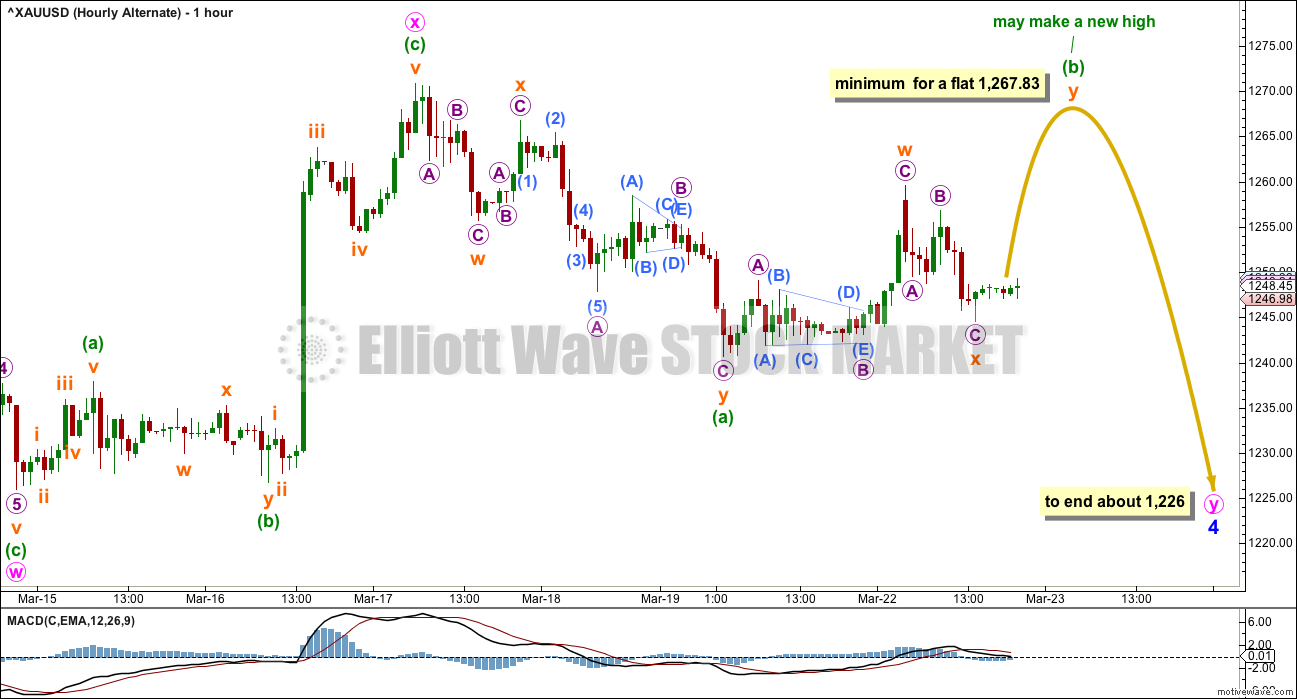
The first flat is an expanded flat labelled minute wave w.
The double is joined by a three, a zigzag in the opposite direction labelled minute wave x.
The second structure in the double is most likely to be a flat correction. It may not be a zigzag because minuette wave (a) will not subdivide as a five; this downwards movement will only fit as a three (double zigzags are classified as “threes”).
If minute wave y is to unfold as a flat correction, then within it minuette wave (b) must retrace a minimum 0.9 length of minuette wave (a), and it must reach above 1,267.83. It may make a new high.
When minuette wave (b) is complete, then the type of flat for minute wave y would be known and a target may be calculated for minuette wave (c) down to complete it. For now it is likely that minute wave y would end about the same level as minute wave w at 1,226.
Minute wave y may also subdivide as a triangle (not charted). This is possible but less common than a double flat correction. If sideways movement continues in an ever narrow range, then this possibility will be charted. If MACD begins to flatten off at the zero line, then expect minute wave y to be a triangle. The minimum at 1,267.83 would not be met and a triangle would be invalidated with a new high above 1,270.85.
If minor wave 4 continues as a double combination or double flat, then minor wave 5 may be longer than the first main wave count expects it to be. The first target would still be for minor wave 5 to reach equality in length with minor wave 1 at 42.52. Thereafter, a more likely length for this wave count would be about 69 where minor wave 5 would reach 1.618 the length of minor wave 1.
SECOND ALTERNATE DAILY ELLIOTT WAVE COUNT
Click chart to enlarge.
What if my analysis of intermediate wave (1) as incomplete is wrong? If it is complete, what would that look like? Does it fit?
This wave count is identical to the main wave count up to the end of minor wave 3 . Thereafter, instead of seeing minor wave 4 as an expanded flat correction this wave count must see it as a regular. There is still alternation between minor waves 2 and 4: minor wave 2 is a deep 0.97 double zigzag and minor wave 4 is a shallow 0.18 regular flat. The proportions are not as good though: minor wave 2 lasted nine days and minor wave 4 only four days. This slightly reduces the probability of this wave count.
Ratios within intermediate wave (1) are: there is no Fibonacci ratio between minor waves 1 and 3, and minor wave 5 is 2.95 points longer than equality with minor wave 1. This good Fibonacci ratio adds a little support for this alternate wave count.
A movement at intermediate wave degree should begin with a five down on the daily chart. That is incomplete. Within the first five down, no second wave correction may move beyond the start of its first wave above 1,282.68.
SECOND ALTERNATE HOURLY ELLIOTT WAVE COUNT
Click chart to enlarge.
Downwards movement will not subdivide as the start of a third wave. Minute wave ii must be continuing higher as a zigzag for this alternate.
Within the zigzag, minuette wave (b) may be a triangle which is close to completion. The breakout from the triangle should be upwards to complete minuette wave (c).
Minuette wave (c) would be most likely to make at least a slight new high above the end of minuette wave (a) at 1,270.85 to avoid a truncation. Minute wave ii may not move beyond the start of minute wave i above 1,282.68.
TECHNICAL ANALYSIS
Click chart to enlarge. Chart courtesy of StockCharts.com.
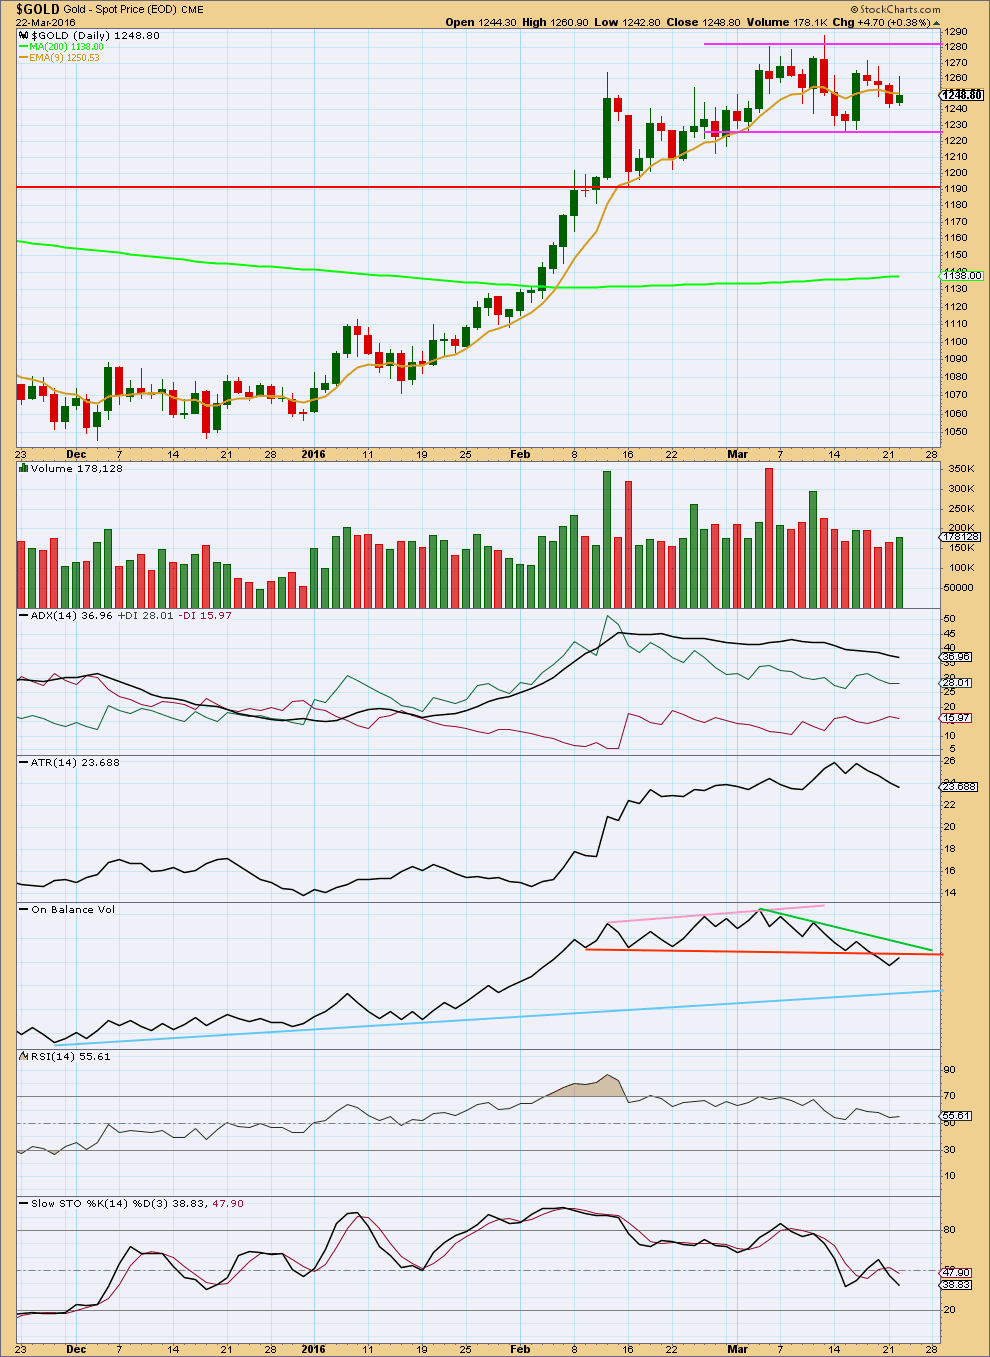
Another small range day within the consolidation zone indicates no breakout yet. Price needs to break above or below the horizontal pink lines delineating resistance and support on a day with increased volume for confidence in the next trend and direction.
The strongest volume day during this consolidation is still for an upwards day, indicating an upwards breakout is still more likely than downwards.
On Balance Volume disagrees though. The break below the orange trend line indicates a downwards breakout for price. If OBV breaks back above the orange line. this signal will be negated. If that happens, then more confidence may be had in the signal from volume for an upwards breakout.
RSI and Stochastics are close to neutral. There is room for price to rise or fall.
This analysis is published @ 09:02 p.m. EST.
Thank you lara…
You are working hard doing your best in this complicated gold move…
Will wait for todays analysis…want to see how EWcounts justifies Int(2) with TA..
🙂
Volume will be important today. StockCharts don’t have finalised volume data until 6:30pm EST.
So I must wait for that data before finalising my analysis.
So far from COMEX data volume looks like it is lighter than the last two days; falling price on declining volume is suspicious, looks like the downwards move is ending. If that is how the session closes then the first alternate would be preferred.
But On Balance Volume will now have moved further away from that trend line.
This gives enough conflict in indicators for me to say that we cannot have reasonable confidence in either of the alternate wave counts. This could be the end of a fourth wave correction, or it could be the start of intermediate wave (2) down to last weeks or even months.
Price is breaking below the lower edge of the support line on the TA chart. But on lighter volume this may just be an overshoot, to be reversed.
We don’t have a full breakout yet. Price remains range bound.
I’m not going to try and pick a winner and try to pick a low at the same time so I’m going to patiently wait for price to tell us which wave count is correct before proceeding.
Thanks, Lara. I believe 1 more wave down is required as I see price stuck in a minute4 (unless it is done at 1224,6 -23,6% fibo also). I have minute 3 ending at the low today 1214.5. If so, my targets for whole structure starting yesterday to end are: 1214(double bottom today and minute1=minute5, 1207 if 1.62xminute1, 1196 if 2,62xminute1). This is unless minute 4 as I see it goes to end at 1231(38,2%), then must move targets up. I still can only “hope” this targets will end minor4 afterwards, but for that I see 1240 resistence needed to be taken out or it can turn into interm 2….
Only two wave counts today, the two alternates.
If this is a double combination for a fourth wave then it should be over here. I see a volume spike at the last low. For Gold that often indicates an end to a movement.
But I am concerned that this may also be an early stage of a third wave down for the second alternate. So any longs entered here must be carefully managed, you could not hold that during intermediate wave (2). The loss is just too great.
There are two ways to count this downwards wave at least. It could be a 5-3-5 with a final wave needed to complete the impulse. Or it could be a complete impulse. Which makes entering long here risky.
Too risky for me. I’m going to wait for a classic breakout of resistance or support before I have confidence enough to go long or short. Price will tell us which wave count is correct. With this downward move possibly intermediate (2) I don’t want to risk another long, and I’m not ready to go short without confirmation.
After taking some losses on long positions last night , i have put in some LIMIT orders to buy June gold futures at 1198 down to 1188. And keeping my fingers crossed.
The probability of an April rate hike just doubled
Mar 23, 2016 12:50 p.m. ET
http://www.marketwatch.com/story/the-probability-of-an-april-rate-hike-just-doubled-2016-03-23
I do not think they will raise rates, ok it is 14% chance up from 7% still nothing, but even if they do? So what? Fed raised rates last year and what happened? Gold dumped abit and then went from bear to bull market. So even if there will be rate hikes, they will just be reason for corrections in this bull market, be them intermediaries or minors. Perhaps this rumour coincides with intermediary 2 which I do not think has started yet… and it is just minor 4 so far… Still plenty of time till april for price to rise and fall deep and rise again…
The main “So what” now about the FED rumours about April rate hike is that it may help move markets, the US dollar and gold sentiment and prices. so when investors ask what happened then they may look at EW and major news headlines as possibilities and give them weight or not depending whether they believe in them and their effect or accuracy or not. Or else we can ignore all headlines, etc. as our personal choices. Just as some here put huge weight on the COT and others think it is trivial and ignore it.
This key gauge of dollar strength rose to its highest level in a week
http://www.marketwatch.com/story/dollar-stays-supported-in-the-wake-of-fed-officials-comments-2016-03-23
I’m not sure how to interpret the volume spike with prices falling like a rock today. Is it capitulation and we will be going higher from here, or is it signifying short term trend change and we will see new lows for an intermediate (2)?
I would think logically like this: the sp500 and german dax looks like topping soon. The comercials have been short on gold since 1-2months now and have to take some profits off. Therefore, I think or hope (and I hope it is not just a hope) that minor 4 ends today at around 1210… 🙂 But that should imply some fast impulsive wave up after that, not just some other corrective up which will be a wave 4 up in that case… the key to watch is now 1240 for a break up…
https://www.bullionvault.com/gold-news/gold-stocks-032220161
Interesting article, however Doug Casey offers gold investing advice and in my opinion is a Perma-Bull, which is not accurate for investing except for very long term.
Spot gold hits 3-week low on dollar, US rate hike comments
41 Mins Ago
http://www.cnbc.com/2016/03/22/spot-gold-steady-as-safe-haven-trade-offsets-dollar-gains.html
I see wave iii only complete at 1215 of C down and we are now in wave iv up, target 1230…. Then shall see what happens, hoping still for around 1210 bottom… The hope this is only minor 4 to end soon is backed up now by the fact on my chart OBV is starting to move up , hmmm… 🙂
Edit: target 1227-1228…
Thanks for sharing your target for wave iv before wave drop today.
Lara says: “This would be my preferred hourly wave count, it works with the first alternate. A double combination: flat – X – zigzag, may be almost complete now.
At 1,229 minuette (c) = minuette (a)”
Now at 1210 minuette (c) = 1,618 * minuette ( a )
Yes… But I am worried if it goes beyond 1210… that would setup a 2,618xa or in fact 2,618x i which would give more credit to interm. 2 performing… I really hope not 🙁 Does anyone have a up to date situation on bearish COT data? Maybe a chart on last week/month up till today to see if commercials are closing longs or not ? Thx…
Last month’s including last Fri’s COT data:
http://www.cftc.gov/dea/futures/deacmxsf.htm
Not in a chart. Best I can do I’m afraid. Sorry.
That’s great Greg, thanks for posting. And no worries about a chart, that kind of data is easily read in table format.
So commercials are still more short than long. As they’re usually right, that favours the second alternate.
THis move ends soon and we go into a small wave iv up followed by another v down to end it… it= whatever it is, part of minor 4 or interm2…
This move down is concerning for a impulsive third wave down of five for beginning of intermediate wave 2. Would bail on longs if go much below 1211.
I would bail on longs if the lower edge of the blue channel is breached.
When laraa wakes up she will not like this…
Exceeded the target of 1229…minor 5 invalidated…but if its minor 4 invalidation is too low…market getting support near the lower edge of bollinger band…SlowSTO oversold now…what is next..
Its confusing
Minor 4 not invalidated. I am looking for 1210-1212 now as low…
Minor 5 is not invalidated, just the main daily and hourly counts.
I have found some interesting facts about a 1211-1220 level. If u draw the line connecting minor 1 and minor 3 and place a parralel channel copy thru the lows u get today support about 1218. Also the bollinger band sits about 1220. Also the low of day 25/01/2016 was 1220.6. And there is more the 34EMA sits right at 1222 or so. For this bull to continue and this to be minor 4 and not intermediate 2 I find this levels very important for support today- tomorrow. Also there is the low of 26/01/2016 at 1211: interesting that if c=1,618xa for the Y of minor 4, the target is right 1211. So I will be looking to buy between 1211-1220 and I only mean that in case 1225 breaks… Does anyone else share this view?
Today is Fib 13 day for minor 4.. i think it will end today…if its minor 4 i will be hard to last for another 8 days..
If it is minor 4 indeed it must end today or tomorrow. Unfortunately, at this point it could be also interm.2, but then price must confirm a wave 4 up after this whole down move from yesterday top 1260 ends which will be considered wave 3…
Thank you lara for timely update…
Happy to see that you still have confidence on the upside…
I got my longs yesterday after the confidance we got above 1255…
So having some pain right now…but its part of this game…
Hoping to see this correction to be minor 4 and rocking wave 5 coming ahead…im hopefull…
Sl below 1225..
🙂
One of my risk management techniques is to move my stop to just slightly beyond my entry point as soon as the trade is comfortably positive.
I did that a few days ago with my long position.
Then I moved it up slightly to just below first wave price territory when a small fourth wave correction unfolded.
To hold a position for weeks for a longer term trade it often takes me about 5 or 6 entry attempts. Which I’m okay with because very few are losses.
Risk management is the single most important aspect of trading.
Just found this GDX chart. Looks like it matches up good with Gold. New high, then a larger drop.
Is the 22-March video unavailable, it was available earlier today…. Good luck everyone, got to appreciate Lara’s timely update/s and quality presentations. Thank you so much.
None of the hourly wave counts were correct. It wasn’t a triangle unfolding.
The problem was my analysis of the last downwards wave as a double zigzag. This further downwards movement doesn’t fit with that labelling, so it can’t be that.
If it is an impulse it could fit but almost with a running flat, which has a low probability. But price is now telling us this must be right.
This downwards movement looks weaker than the last wave down. MACD hasn’t made a new low.
This would be my preferred hourly wave count, it works with the first alternate. A double combination: flat – X – zigzag, may be almost complete now.
At 1,229 minuette (c) = minuette (a)
Awesome. Thanks.
Wave 5 may be truncated if minor 5=minor 1
Even if (c)=(a) that does not exclude making a new low. What if c will be 1,618xa ? I have lost money yesterday. And I am looking for 1210-1218 if 1225 brakes to reload longs…. Thanks, Lara
I agree with the wave count but I do not see wave iii of c of Y done. Did you count it on the 5min chart? I always only count it on 5min and even 1min chart, never on 1hour if it is such a low degree. In fact I think we are ending it as we speak. The iv up will follow and then v down with lows below 1225… I hope I am wrong…
Thers a small gap that i can see in hourly chart on 16march…from 1229 to 1234…
Is gold coming down to fill that gap..??
Comments..??
Hey laraa..
Im thinking to add some longs here…
What u suggest…??..
Is gold having the confidance of Wave 5…or its time to just wait n watch with a SL on longs..???
SlowSTO is in oversold region now
Just your thought.. 🙂
Thank u..:)
My position closed for a small profit. It didn’t stick.
I’m going to wait another day to see what price does before entering another position. The conflict between volume and On Balance Volume concerns me.
Price is range bound. And I’m not confident of which direction it will break out.
Looks like we’ll just have to wait an see what price tells us… the price falling to 1231.88 doesn’t fit any of the hourly charts, but right now it seems like either the main wave count or alternate 2 are in play… I guess we’ll find out more tomorrow as this unfolds…
? New wave count needed for the short term fall below 1240.
Yes the main Hourly wave count has been invalidated with movement below 1,240.65 as gold just dropped to 1,231.88 at 12:35 am. The main daily wave count is still valid. At this point it is unclear which is more likely of the two remaining hourly wave counts.
On Balance volume warned of a downward breakout and it looks like that may be what we got at midnight.
“On Balance Volume disagrees though. The break below the orange trend line indicates a downwards breakout for price.”
Lara, I really appreciate the quality of your presentation style.
Thank you. Its a shame the short term analysis didn’t work today.
Yes and I am relieved I only had a very small bullish position and only a 1x as was GDX.