
The alternate Elliott wave count was invalidated.
There is only one Elliott wave count. The situation is clearer.
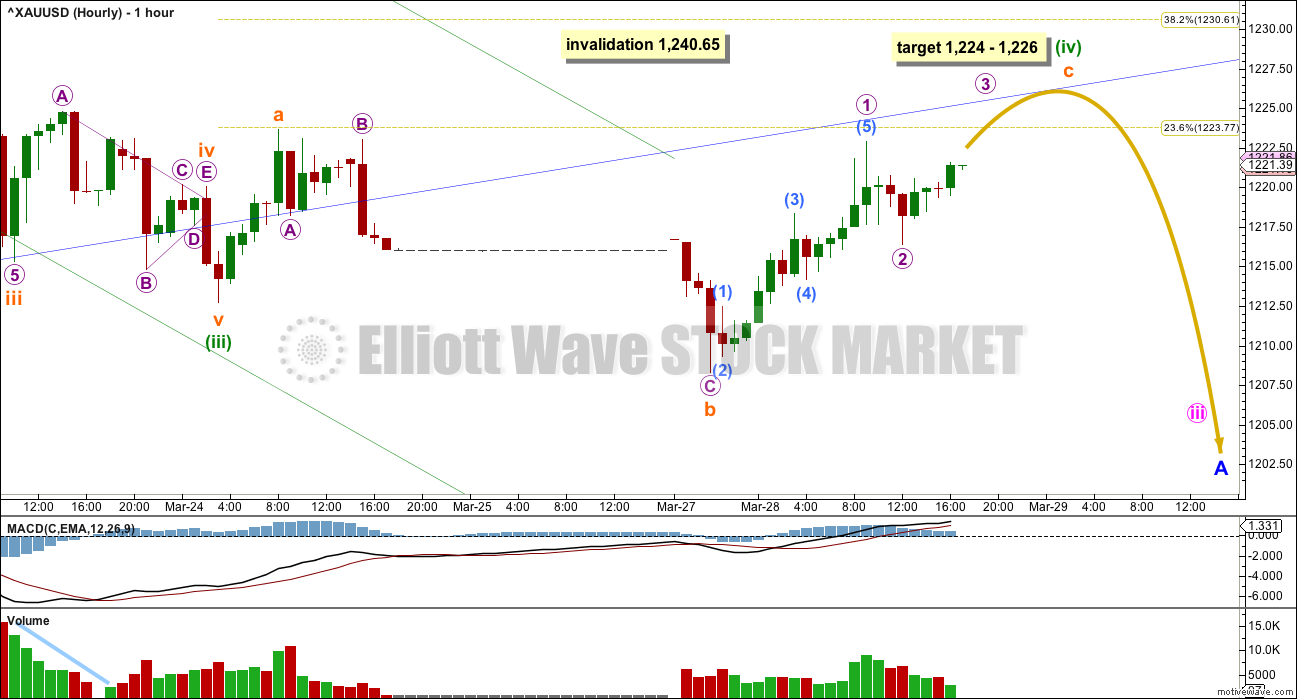
Summary: This correction may end in a few more hours about 1,224 – 1,226, or it may continue sideways for another two to three days. Price is finding resistance at the upper edge of the dark blue channel for a typical throwback.
New updates to this analysis are in bold.
Last published weekly chart is here.
DAILY ELLIOTT WAVE COUNT
Click chart to enlarge.
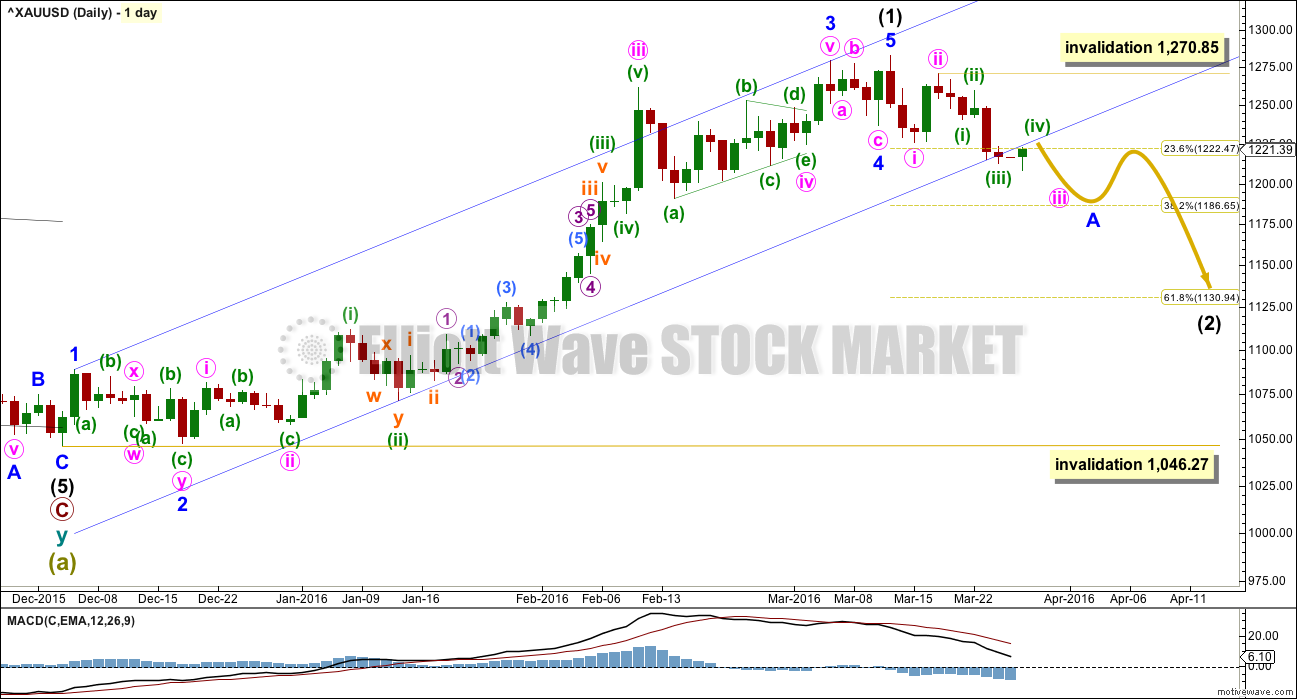
Intermediate wave (1) may be a complete impulse. Intermediate wave (2) may have begun. COT supports this wave count; the majority of commercial traders are currently short. While this does not pinpoint when price should turn, it does support a larger downwards trend about here.
Ratios within intermediate wave (1) are: there is no Fibonacci ratio between minor waves 1 and 3, and minor wave 5 is 2.95 points longer than equality with minor wave 1. This good Fibonacci ratio adds a little support for this wave count.
A movement at intermediate wave degree should begin with a five down on the daily chart. That is incomplete. Within minute wave iii, no second wave correction may move beyond the start of its first wave above 1,270.85.
It is extremely unlikely that intermediate wave (2) is over already, although the structure could be seen as complete. It has not breached the channel containing intermediate wave (1) and it should be expected to. It is far too shallow for the normal depth of a second wave, particularly the first second wave of a new trend. And finally, it is far too brief for an intermediate degree wave.
HOURLY ELLIOTT WAVE COUNT
Click chart to enlarge.
There are still multiple structural possibilities for minuette wave (iv). Although I am labelling it as an expanded flat (because that is the most common structure), it may also be a combination or running triangle. Labelling on the hourly chart may change as the correction unfolds.
If minuette wave (iv) is an expanded flat, then within it subminuette wave b is a 1.4 length of subminuette wave a. This is slightly longer than the normal range of 1 to 1.38.
At 1,226 subminuette wave c would reach 1.618 the length of subminuette wave a. This is just $2 above the 0.236 Fibonacci ratio at 1,224 giving a $2 target zone with a reasonable probability.
If minuette wave (iv) is an expanded flat, then it may be over within the next 24 hours.
If minuette wave (iv) is a running triangle, then it may move sideways in an ever decreasing range for another two to three days.
If minuette wave (iv) is a combination, then the second structure in the double combination should unfold sideways over the next one to two days.
It looks like price may continue to find strong resistance at the lower edge of the blue channel. When channels provide support or resistance and are breached, and then price throws back to the trend line, it offers an excellent opportunity to join a trend. Stops may be set at the invalidation point or a little above the blue trend line, depending upon personal risk appetite (the risk with a stop above the trend line is price may overshoot the line before turning down). The closer price gets the the trend line the lower the risk is for an entry to the short side.
The next wave down for Gold for this wave count would be a fifth wave to complete a third wave. These can be swift and strong movements. Look out for this tendency, although it cannot be relied upon for a smaller movement during a counter trend second wave.
TECHNICAL ANALYSIS
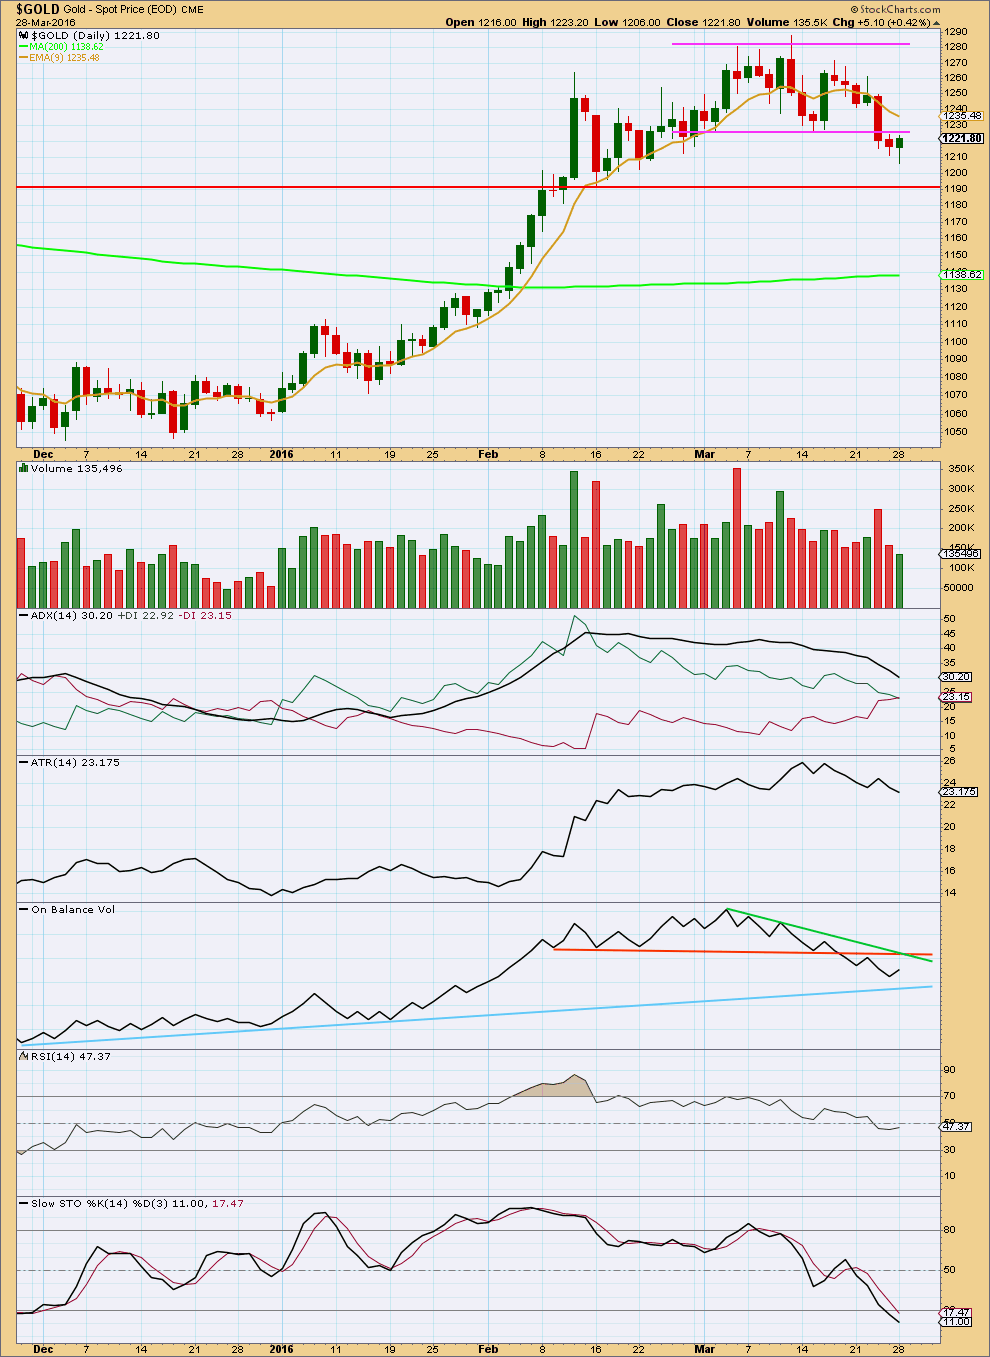
Click chart to enlarge. Chart courtesy of StockCharts.com.
Price continues to find resistance at the horizontal trend line about 1,225. This line should be expected to most likely hold. Price is showing a typical breakout followed by a throwback.
The last two days of small range movement have come with declining volume. Monday’s session has lighter volume for an upwards day. The rise in price is not supported by volume. This indicates this movement is a small countertrend movement. This supports the Elliott wave count.
ADX is declining indicating the market is not trending. ATR agrees as it is declining.
On Balance Volume indicated more downwards movement when it broke below the orange line and came back up to test it. OBV is bearish, which supports the Elliott wave count. The next line for support on OBV is the light blue line. Price may stop when OBV finds support at the blue line, when the next downwards movement in price unfolds.
RSI is still neutral. There is plenty of room for the market to move up or down.
Stochastcis is now entering oversold. In this instance, on the balance of all analysis, I will not give much weight to this indicator today. Although this is oversold, it does not mean price must turn up here. Price can still move lower and Stochastics can become more extreme before a low is found. If Stochastics offers divergence with price, then I would expect a trend change.
This analysis is published @ 06:59 p.m. EST.
… the bears wont have much to say should 1268 be taken out; expecting an up move / rally….
Janet Yellen and the rest of the Fed are an unprofessional and dangerous group out of control with their conflicting comments.
But what do I know ( i’ve only been around for 1,840 years)
kind of think this is just a small first wave of third bigger wave up that will get to 1260 overnight, and correction will be only be to low 1240 or so, before further strong move up.
I’ll have two wave counts today.
The main wave count will see minor A complete as a zigzag. Which means intermediate (2) may be a flat, combination or double zigzag. Three options.
The alternate wave count has a much lower probability. It will see intermediate (2) as a complete zigzag in just 11 days, only slightly deeper than 0.236 of intermediate (1). This is possible, but highly unlikely.
It’s not invalidated until it’s invalidated.
Sometimes fourth waves correct right up to the price territory of the first wave.
If this is an expanded flat then it should be done with one slight new high to complete the fifth wave of subminuette c.
The invalidation point is black and white. Any movement by any amount at any time frame above 1,240.65 would invalidate the wave count.
I’ll work on a “what if?”. What if I’m wrong? What if something else is happening?
I still think it is extremely unlikely that intermediate (2) was over in just 11 days, only slightly below the 0.236 Fibonacci ratio. That would be highly unusual. It is possible (anything is possible) but it would be very rare.
And.. it’s just invalidated.
So I was wrong.
Lara, which count just invalidated above 1,240.65?
Does that mean that intermediate wave (2) is already over and intermediate wave (3) up has just begun?
the hourly chart level
four can’t move into one.
I figure we may have 2 counts tonight one bullish and 1 bearish.
Friday’s comment by Lara, “A break above 1,240.65 would reduce the probability of a downwards trend and increase the probability of an upwards trend.”
Janet Yellen today is a repeat of last FOMC, gold just spiked up and dollar crashed.
1045 loe in December to 1291 high = 246 points . multiplied by .38 FIB = 93 points, subtracted from 1291 = 1198 correction wave 2 low . We got to 1203 overnight a couple nights ago. Maybe this was close enough for a quick correction (as some have said it would be) “A stealth bull market with small corrections”. So maybe we are now at the first small wave of wave 3 UP . IT IS POSSIBLE . I am long.
Hi stephen: I am wondering where you got 1203 low from. I think you mentioned 1203 low yesterday also. I don’t see a 1203 low for Gold Cash, April, May or June contracts… The low for March 28, 2016 was 1207.70 and maybe in one case 1206…. Anyhow, lets see how this pans out from here, expecting upside continuation in preparation for a reversal… Good luck~!
The 1203 .1 low occurred overnight in overseas trading in April gold FUTURES (the active month) last night or night before. This is a legitimate number. Best of luck. I remember the gold ,and silver ,markets in 1976 to 1980 , very shallow corrections .
Any wave count?
Was the high at 1240.14 at 12:36 pm the 5th wave?
It’s lower than Friday’s comment by Lara, “A break above 1,240.65 would reduce the probability of a downwards trend and increase the probability of an upwards trend.”
Gold Sees Solid Rally on Dovish Comments From Fed Chair Yellen Tuesday March 29, 2016 12:37
http://www.kitco.com/news/2016-03-29/Gold-Sees-Solid-Rally-on-Dovish-Comments-From-Fed-Chair-Yellen.html
Markets getting hard…Yesterday the alternate was discarded and today the main is almost getting invalidated..
I guess we have seen the sizzle, slowly now should be time for the fizzle lol… remains a concern for Gold price likely to break above 20dma currently at 1246… Good luck all~!
Wonder if this could be a leading expanding diagonal for A with the overlapping and we need to move higher to complete wave 4.
Stopped out at 1231..
Missed going long…
:(..
Yes, was SYED at 10:33 warned we could go above 1235. I am not short in here but long.
Is it possible we saw the bottom of minute wave 2 a couple days ago at 1203 overnight? and being short is crazy and you should be long?? Short covering by Commercials may drive price in third wave up to 1300 area ,. Just thinking out loud. Also somebody here mentioned going long earlier.
Gold and GDX just spiked up at 12:20 pm
12:20p Yellen says appropriate for Fed to proceed cautiously on raising interest rates
Buzz all around…madam jannet again will give a booster for gold today…
This is premium corrective rally…im shorting gold…stoploss just above day high.. 🙂
Ruppu, I’m concerned Janet may boost gold at today’s 12:20 EST live conference. You think so too but still you are shorting gold?
I’ve only bought a small amount of DUST at the throw back in gold this morning.
Richard thanks for concern…
I feel when thers a buzz its already discounted in this small rally…going shory with small risk can be fruitfull here…
Fine, Where is today’s high for stop loss ? 1248, 1260?
Inflation is the Buzzword to look for in Janet Yellen’s 12:20 EST live speech today.
http://www.marketwatch.com/story/heres-the-buzz-word-to-listen-for-in-yellens-speech-2016-03-28?mod=MW_story_top_stories
Gold just spiked to 1229.11 at 9:08 am, maybe that is the top of minuette (iv) at Lara’s target is 1224 – 1226.
Hi Richard:…. Just my view: With Stochastic %K above %D (bullish), CCI in negative territory racing back up to zero for possible cross above zero (bullish signal when it does cross above zero) and 100dma expecting to get above 200dma soon (bullish crossover)… Better look out for the upside break above 1235 for more unless Gold price gets to break below 1215 before that~! Good luck.
Interesting spike in Gold just a few minutes ago… reaching $1,228 and change. With no alternate path, I wonder what that was all about?
So far Gold price upside is being contained under 1225 and having an inside day. IMHO Gold price appears to be looking to bottom…. I’d look to go long on this around the lower band level 1209-06 if gold price can get there subject to a break below 1211-1210…. Momentum seems to have slowed down for a possible rally which could then likely test a break above 1235….Lets see.
With price moving lower, not up to the target at 1,224 – 1,226 it looks like minuette (iv) may be a triangle or combination.
And so sideways movement for another two days perhaps should be expected.
If I’m wrong then we would know if price makes a new low below 1,208.33 with strong downwards movement. If that happens then minuette (iv) may be over and minuette (v) may be underway.
But the last wave down looks best as a three. If that is correct then minuette (iv) is not over.
Tuesday 12:20 p.m. EDT Janet Yellen’s live speech and question and answer session.