
If price kept rising, two targets were given for Friday: 1,280 and 1,350.
The first target was almost met. The high for Friday was 1,279.45.
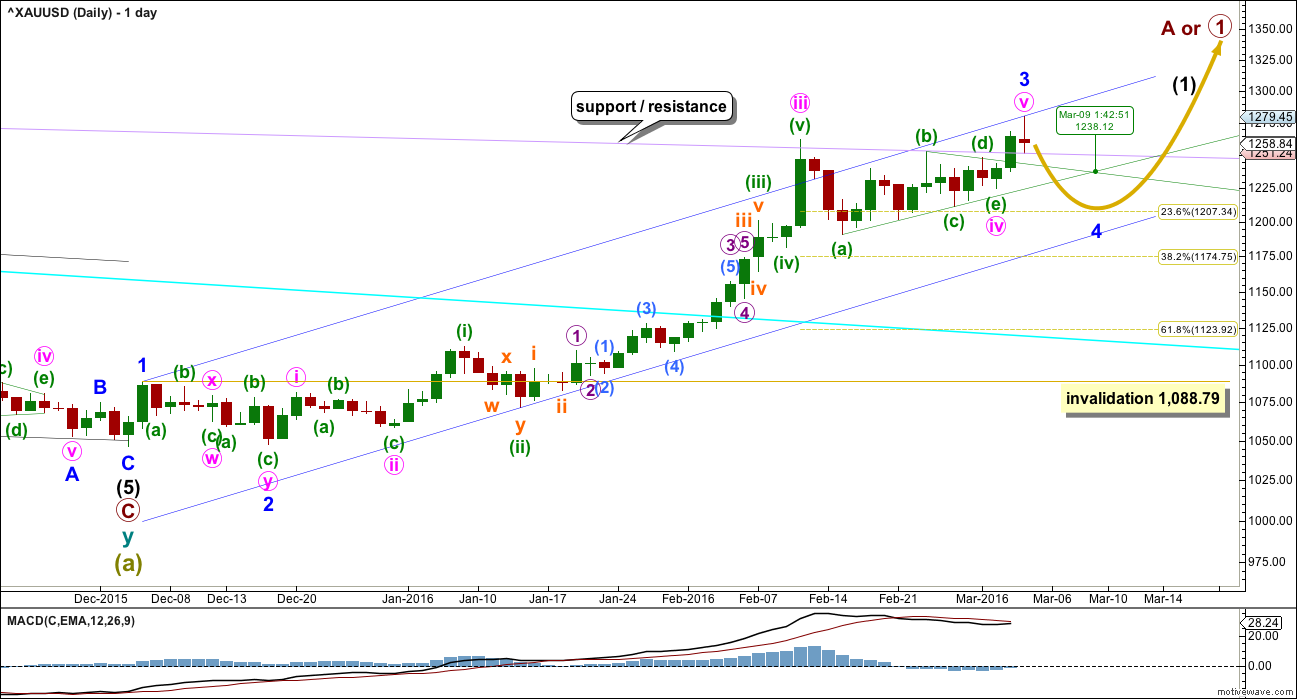
Summary: Minor wave 3 is very likely to be over at Friday’s high. Another correction should now begin for minor wave 4. It may last a Fibonacci eight or thirteen days and would most likely end about 1,207.
New updates to this analysis are in bold.
Last published weekly chart is here.
MAIN ELLIOTT WAVE COUNT
Click chart to enlarge.
Gold has very likely changed from bear to bull.
So far, within the first five up, the middle of the third wave is now most likely complete. The strongest move may still be ahead. Gold typically exhibits swift strong fifth waves to end its third wave impulses. Look out for surprises to the upside for minute wave v and minor wave 5.
Friday’s upwards movement may have completed minor wave 3.
Ratios within minor wave 3 are: there is no Fibonacci ratio between minute waves iii and i, and minute wave v is just 0.07 short of 1.618 the length of minute wave i.
Minor wave 2 was a very deep 0.97 double zigzag lasting nine days (one more than a Fibonacci eight). Given the guideline of alternation, minor wave 4 may be expected to be a longer lasting sideways structure such as a flat, combination or triangle. It may last a Fibonacci thirteen days most likely. If it is a triangle, it may take longer, perhaps a Fibonacci twenty one days.
Minor wave 4 may end within the price territory of one lesser degree. Minute wave iv has its range from 1,261.94 to 1,190.9. The most likely target for minor wave 4 would be the 0.236 Fibonacci ratio at 1,207 as it lies within this range.
Minor wave 4 would probably not be able to end on 9th March when the triangle trend lines cross over. On 9th March a trend change may occur, but it may be a small change. This may be where minute wave a within minor wave 4 ends.
Click chart to enlarge.
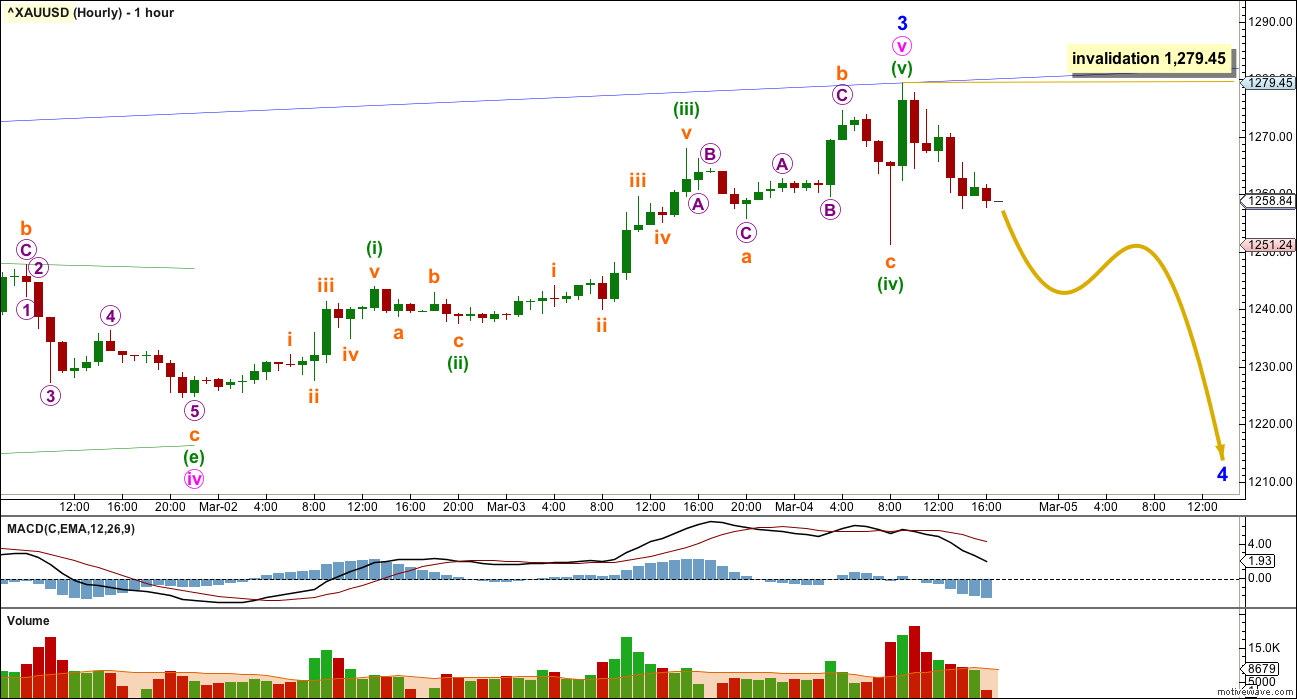
A movement at minor degree should begin with a five wave structure downwards at the hourly chart level, followed by a three up which may not move beyond the first five down above 1,279.45. In the short term, a new high above 1,279.45 would invalidate this first wave count.
Once a 5-3-5 down is complete, then the invalidation point at 1,279.45 would not longer apply. Minor wave 4 may be a flat, combination or running triangle. These structures may include a new high above 1,279.45.
ALTERNATE ELLIOTT WAVE COUNT
Click chart to enlarge.
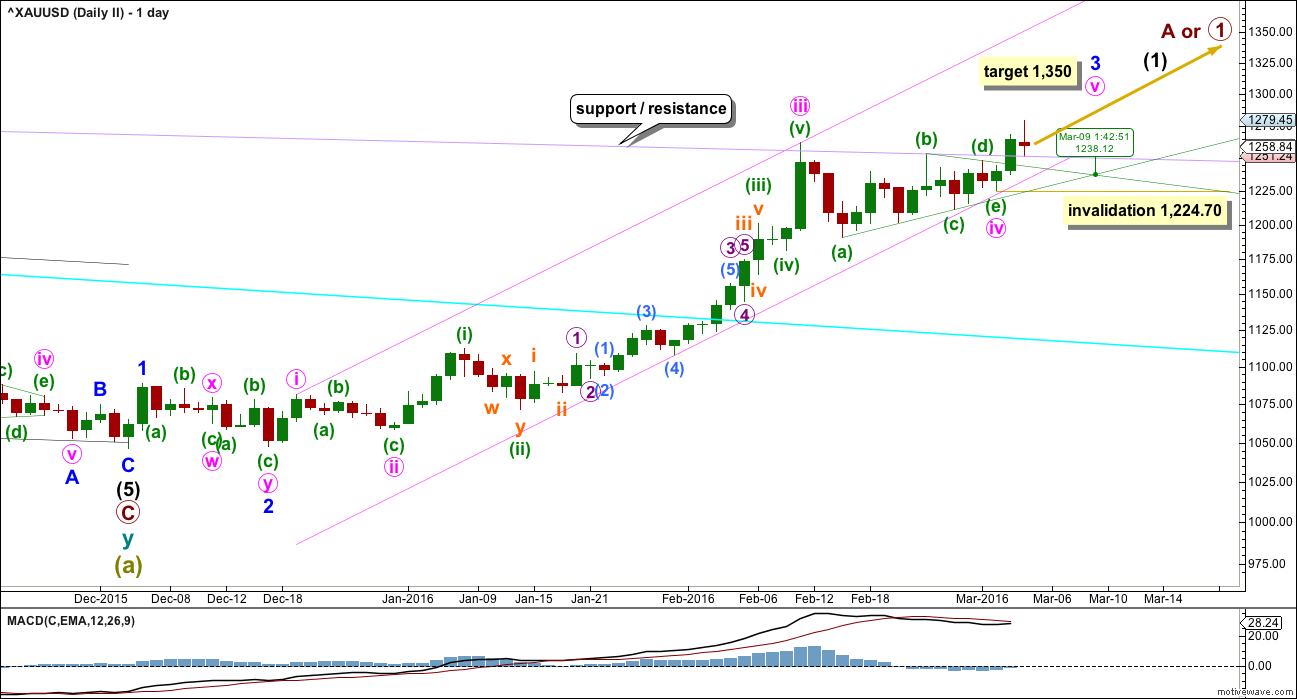
This alternate wave count has a low probability. It is published to consider all possibilities.
By simply moving the degree of labelling within minute wave v down one degree, the upwards movement that ended on Friday may be only the first wave within minute wave v.
Minute wave v may be extending.
At 1,350 minute wave v would reach 0.618 the length of minute wave iii.
Downwards movement for Friday found support at the lilac trend line.
Minor wave 3 may end on 9th March, if it ends when the triangle trend lines cross over.
Click chart to enlarge.
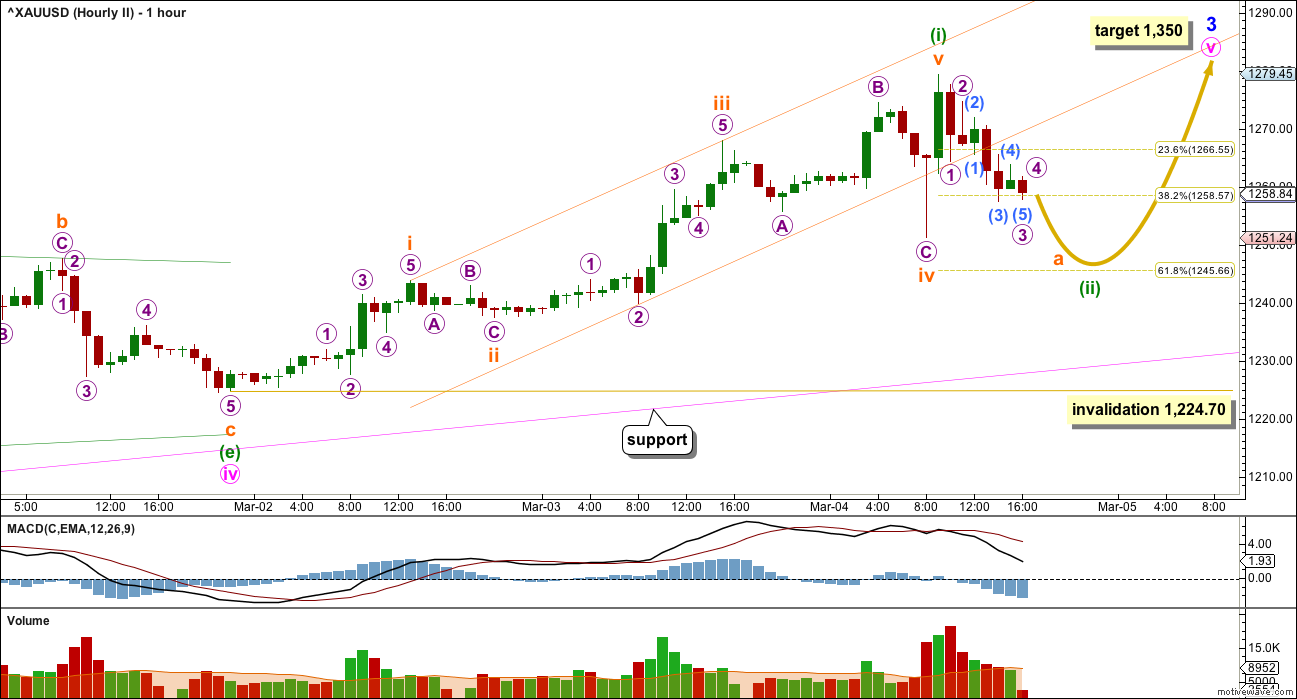
Minuette wave (ii) may end about the 0.618 Fibonacci ratio of minuette wave (i) at 1,246. If this second wave count is correct, this second wave correction should end on Monday. Monday may print a green daily candlestick.
Minuette wave (ii) may not move beyond the end of minuette wave (i) below 1,224.70.
TECHNICAL ANALYSIS
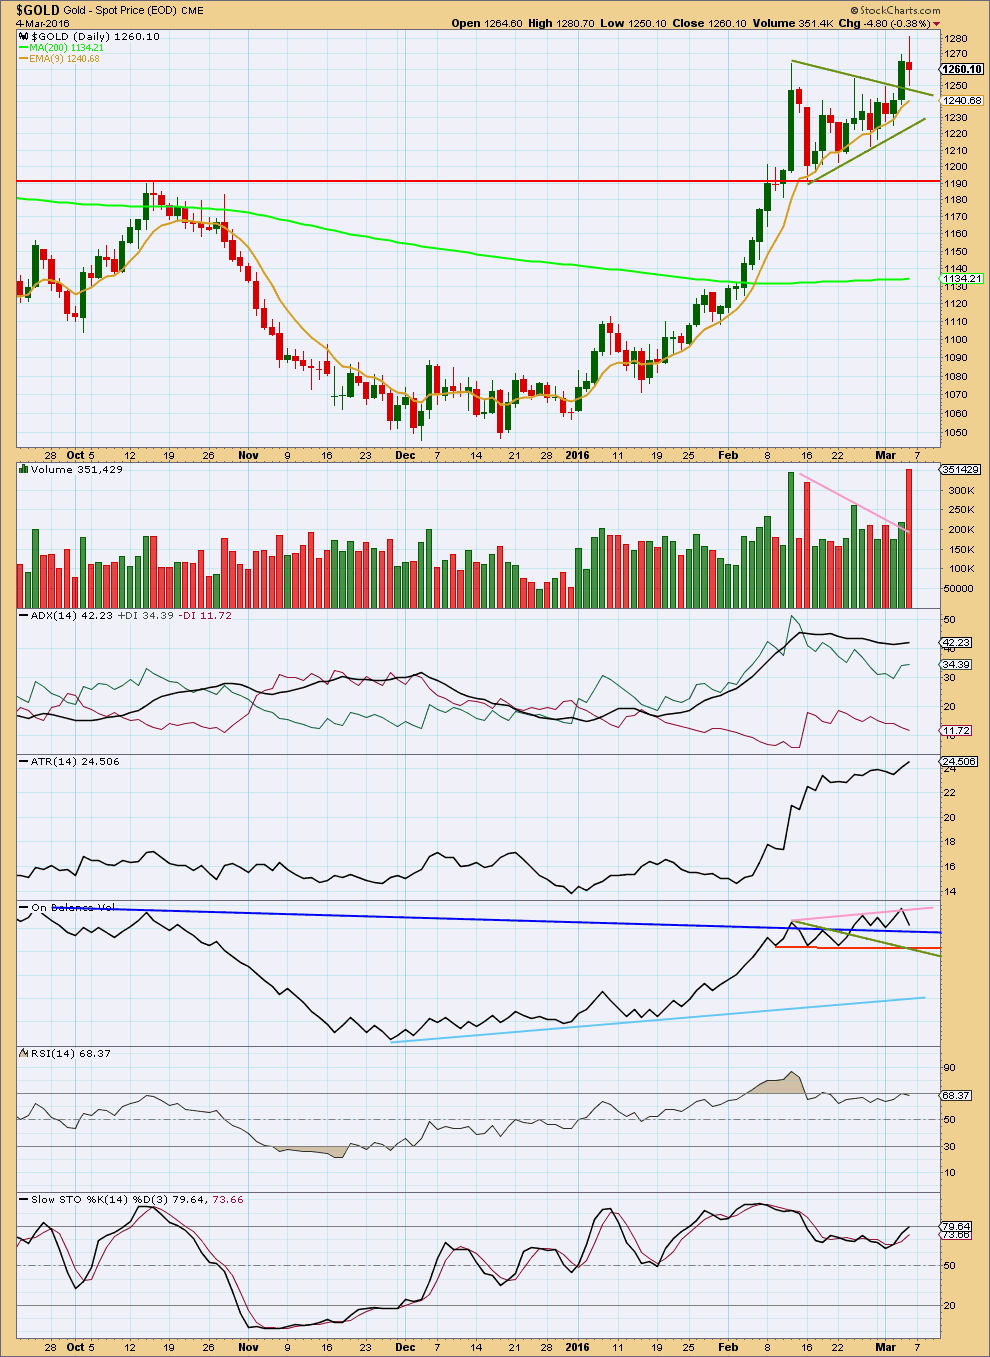
Click chart to enlarge. Chart courtesy of StockCharts.com.
Two things on this chart strongly indicate upwards movement is over for now for Gold: the volume spike for Friday and strong divergence between price and RSI.
Gold often ends its fifth waves on a sharp movement with a volume spike. Friday’s volume spike looks typical. That volume is for a downwards day which further reinforces the idea that more downwards movement is now ahead for Gold. The fall in price was supported by volume on Friday.
ADX and ATR finally caught up as they now indicate there is an upwards trend. Both these indicators are lagging as they are based on 14 day averages.
RSI shows strong divergence with price: as price made new highs for the last two days RSI failed to make corresponding new highs. A failure swing by RSI is strong indication of a trend change here.
Stochastic also shows divergence with price. Downwards movement should now be expected to continue until Stochastics reaches oversold and price finds support at the same time. The first horizontal line of support is about 1,190.
I will use the trend lines on On Balance Volume to assist in finding the end of downwards movement. When the Elliott wave structure on the hourly chart may be considered complete, if OBV finds support at the same time, this may be the end of downwards movement.
This analysis is published @ 09:00 p.m. EST.
A VIEW: With a inside day to Friday making H 1274.1 / L 1257.4 on Monday, remains to be seen which end of Monday’s range gets taken out…. Gold price is bullish up trending…. Scalp short above the upper band for me and/or Buy the drop below pivot if it does drop below pivot towards 1255…. Gold price appears range bound 1275-1260 with a likely breakout to occur…. Gold price current movement up and away from its pivot seems to suggest upside break of Monday H 1274.1 is in the offing….
This move is very corrective. I cannot see a five down so far.
For the main wave count minor wave 4 may be a flat, combination or triangle. The first wave for minute a is most likely to subdivide as a three. But still I had expected that to begin with a five down on the hourly chart for a move of this size.
If minor 4 is going to be more brief then minute wave a may be quicker, and begin with a three. That may be what is happening.
For the alternate the proportion so far is a better fit. Minuette wave (ii) may be unfolding as a combination or flat correction.
Either way, Gold is in a correction which is incomplete. I expect more sideways movement for at least one more day.
Both wave counts remain valid. I still favour the main wave count; the volume spike at the last high and divergence with RSI is too strong to dismiss quickly or easily.
Lara,
Could this be happening? It’s a variation of your alternate hourly.
It’s possible, but I expect it has a low probability for the following reasons:
The final fifth wave up now looks like a three not a five.
Wave C of the correction is substantially truncated. Because the truncation is so big the probability is quite low.
Hi Lara,
I am really looking forward to the Oil update as we have reached the 37.81 target f the main wave count. Can we expect downwards movement from here now?
Your question will be answered today in the Oil analysis.
I have not gotten that far yet. Gold just done. Now S&P. Then Oil.
The last time oil rallied like this it didn’t end well for the bulls
Mar 7, 2016 1:11 p.m. ET
http://www.marketwatch.com/story/the-last-time-oil-futures-rallied-like-this-it-didnt-end-well-for-the-bulls-2016-03-07
Gold is quite and crude is getting crazy…
Any comment
Gold went ballistic for days and now in a correction, which still has some significant moves in miners.
A rally in oil prices helped draw investors toward assets perceived as more risky, dulling gold’s investment appeal.
It appears that maybe the c wave of the A-B-C wave down minuette wave (ii) for the alternate wave count may have started down at 1,273.27 at 6:45 am EST today.
If gold hits the 1,246 area that may be the bottom of the c wave down.
“Minuette wave (ii) may end about the 0.618 Fibonacci ratio of minuette wave (i) at 1,246. If this second wave count is correct, this second wave correction should end on Monday and invalidate the main hourly chart Monday.”
Lara..
Is this move in gold is supporting alt count..??
Too early to tell. Both counts valid. Likely starting a c wave down.
Lara..
Minuette wave (ii) may end about the 0.618 Fibonacci ratio of minuette wave (i) at 1,246. If this second wave count is correct, this second wave correction should end on Monday. Monday may print a green daily candlestick…
So it should be a green close today to support alt
I think it is possible that Minuette ii may be complete. I can see a short 5 down to 1257 to complete an abc. Support at 38.2 retirement. Minute i and ii of Minuete iii complete also. GDX and GDXJ up strongly.
Questions here are answered on todays analysis to be published very shortly.
Avi has a crazy high prediction for gold
http://news.gold-eagle.com/article/upside-potential-gold-miners-truly-“unbelievable”/87
Ok that is insane crazy call at this point in time, unless this guys have a time machine and they are from the future :))) For a more realistic aproach regarding gold and miners fundamentals read http://www.zealllc.com. Indeed gold and miners are in a new bull market that is for sure. But I would say a 1500-1600 target is more realistic by year end or 2017. 🙂
Does 5 wave structure of A wave is over with an early asian trade low…??…this query is regarding alt wave count..
Here is my idea for Friday’s move. I still think 4 of 5 of A is in progress… because that Friday’s move that many count as 5 of A is a clear 3 wave advance on 5m chart.
A very bullish call on gold and bearish on the stock market.
http://www.gold-eagle.com/article/confirming-big-gold-wave-2016-2017
I predict gold will go up again on Monday. Doesn’t matter what the COT or EW or technical says. Because it’s ALL about Trump. I live in Canada so it’s doesn’t matter to me. But it seems like people especially American are hoarding gold because Trump is winning.
Dear Lara,
on lower time frames, the wave that you count as (iv)-(v) of circled(v) of 3 has a clear 3 waves structure. Why you count it as circled (v) if it’s not an impulse?
It can be seen as either.
If it’s a five then within it the fourth wave correction would be close to the end and very brief.
Sometimes Gold does that. Not all its waves will look perfect on all time frames. When it has strong swift fifth waves they force the fourth wave corrections before to be quick and shallow.
Or it could be a three wave structure.
Or it could be a five ending in a truncation.
Rambus on gold
http://rambus1.com/2016/03/03/gold-special-update/
Watch Surfers Get Demolished On The Sport’s Most Beautiful And Dangerous Wave
http://www.huffingtonpost.com/entry/surfers-pipeline-wipeouts_us_56d9f07de4b0000de40490f5
This is what happens when “wavers”, aka “traders” don’t follow Lara’s guidance. lol
On EWG board we are all hanging on to Lara’ safe surf board!!!! So we are safe.
Nice link Dreamer!
I see many parallels between surfing and trading / analysing markets.
I don’t surf waves like that! But I have had nasty wipeouts. It just goes with surfing. I’ve had technicolour bruises that last weeks, ripped wetsuits, some bad injuries. And I’ve lived to surf another day.
Losses in trading are inevitable, just like wipeouts in surfing. The key is living to trade / surf again. And not letting the loss / wipeout destroy your desire to trade / surf again. Keep your nerve and stick to the plan.
Once again lara…great analysis..
Amazing…as u said…a swift n strong 5th wave and it was…spike from day low to day high within hours… :)..
Just want to know laraa…comparitively all the 4 waves in the wave structure, the 5th wave was a very swift wave within an hour or two it was done …so…historically this kind of short 5th wave (much shorter than the corrective waves too..shorter in the sense of time) are ususal or are very rare..??
The above query is regarding both the structures…minor 3 as well as minutte 5…in both 5th wave was too short
I wouldn’t say that minuette (v) was “too” short.
It is what it is. It’s short. But it’s longer than minuette (i) (labelling taken from main hourly chart).
Within minor wave 3, minute v isn’t “too short” either. It’s longer than minute i. It’s remarkably close to 1.618 X minute i.
Remember, the daily chart is on a semi log scale. That makes a difference to perspective.
Lara – there is something that I do find puzzling. When I looked at the FXCM board, the high for Gold on Friday was showing 1280.+ and yet when I looked at my chart I saw it was 1279.45 until I clicked the ‘Ask’ price and it changed to 1280. Which price therefore is taken as being correct? When I saw the Ask price, my immediate thought was that you were bang on.
Gold is a global market. There are slight differences in data from different providers depending (I assume) on which points in the globe data is taken from.
The data I use is from COMEX.
I wouldn’t say one price point is correct and another is incorrect. It would be nice if we could get a truly global aggregate of data for the Gold cash market. But we can’t. Only that would be correct.