
A correction was expected to continue. The small red candlestick for Tuesday’s session fits both Elliott wave counts.
Summary: A correction is still unfolding and should continue sideways. The correction may include a new high above 1,279.45. It is most likely a fourth wave at minor degree and may end in a further six or eleven days. Within the correction, a B wave upwards may make a new high.
New updates to this analysis are in bold.
Last published weekly chart is here.
MAIN ELLIOTT WAVE COUNT
Click chart to enlarge.
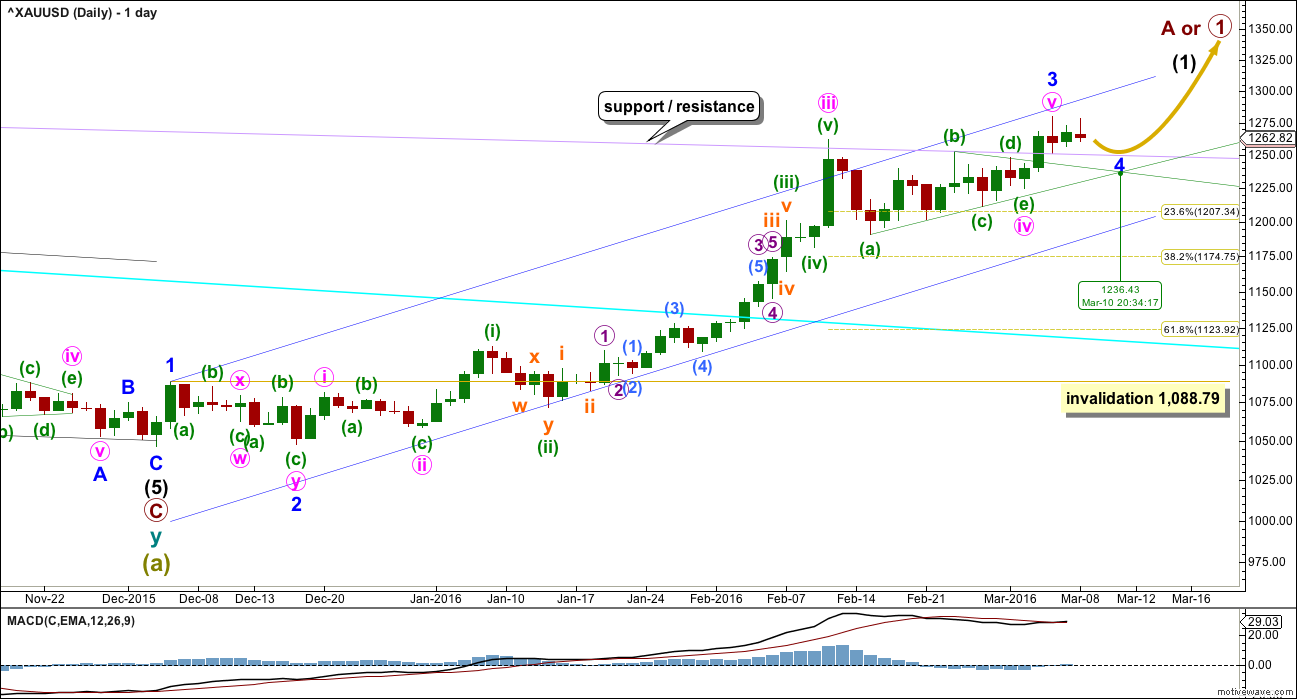
Gold has very likely changed from bear to bull.
So far, within the first five up, the middle of the third wave is now most likely complete. The strongest move may still be ahead. Gold typically exhibits swift strong fifth waves to end its third wave impulses. Look out for surprises to the upside for minute wave v and minor wave 5.
Friday’s upwards movement may have completed minor wave 3.
Ratios within minor wave 3 are: there is no Fibonacci ratio between minute waves iii and i, and minute wave v is just 0.07 short of 1.618 the length of minute wave i.
Minor wave 2 was a very deep 0.97 double zigzag lasting nine days (one more than a Fibonacci eight). Given the guideline of alternation, minor wave 4 may be expected to be a longer lasting sideways structure such as a flat, combination or triangle. It may last a Fibonacci thirteen days most likely. If it is a triangle, it may take longer, perhaps a Fibonacci twenty one days.
Minor wave 4 may end within the price territory of one lesser degree. Minute wave iv has its range from 1,261.94 to 1,190.9. The most likely target for minor wave 4 would be the 0.236 Fibonacci ratio at 1,207 as it lies within this range.
The triangle trend lines now cross over on 10th March. A trend change may be seen on this date. It does not have to be the end of minor wave 4. It may only be the end of minute wave a or b within it.
So far price is finding strong support at the lilac trend line. This may continue to provide support. If that is the case, then this correction may be very shallow.
Click chart to enlarge.
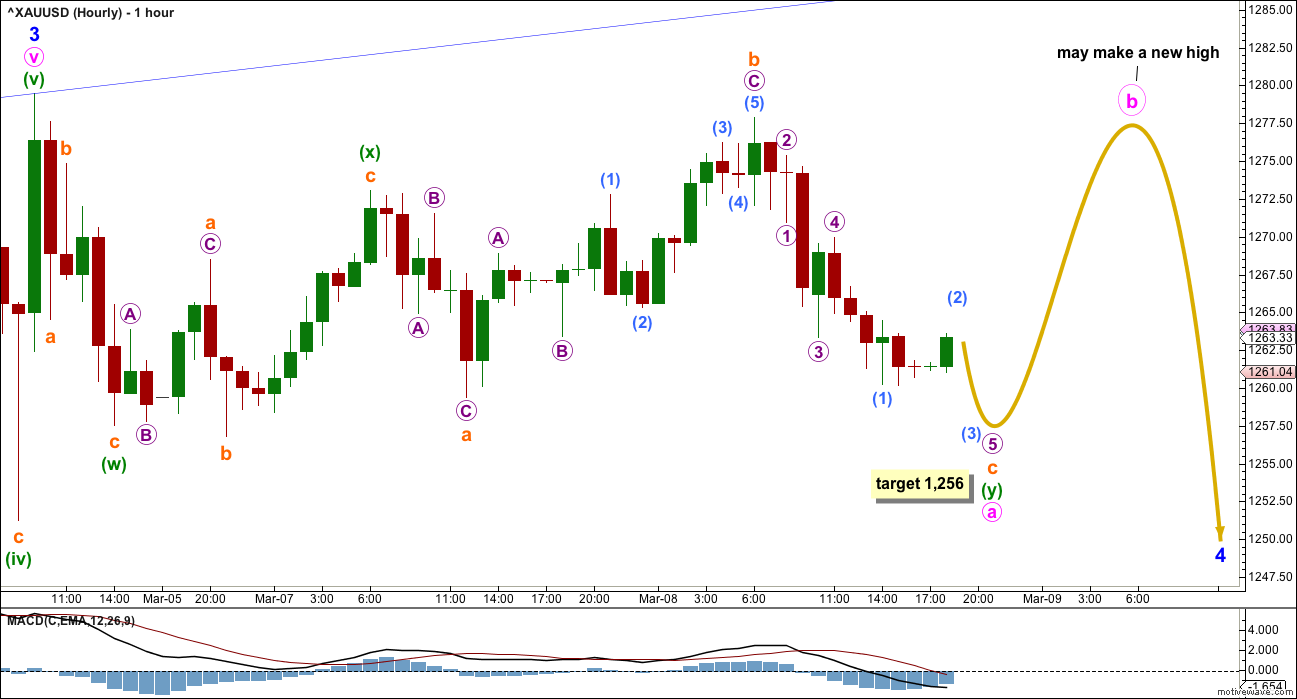
There are several structural possibilities for minor wave 4. It may be a flat, combination or triangle most likely to exhibit alternation with the double zigzag of minor wave 2. The labelling will change as this correction unfolds and as the structure becomes clearer. It is still impossible at this early stage to tell which of 20 possible structures is unfolding.
The labelling for this correction works in the same way for the main and alternate wave counts at the hourly chart level. These are just two possibilities which can be seen at this stage.
The correction may be unfolding as a flat or triangle, and for both of these structures wave A should be a three. Minute wave a may be an incomplete double combination which is classified as a three.
Within the combination, the first structure of minuette wave (w) is a zigzag. The double is joined by a three in the opposite direction, an expanded flat labelled minuette wave (x). The second structure of minuette wave y may be a flat or triangle. Subminuette wave b within minuette wave (y) is over 0.9 of subminuette wave a, so it has met the minimum requirement for a flat correction. Subminuette wave b is 1.36 times the length of subminuette wave a, just within the normal range of 1 – 1.38. At 1,256 subminuette wave c would reach 1.618 the length of subminuette wave a. This would complete a three wave structure for minute wave a.
When minute wave a is a completed three wave structure, then minute wave b upwards should unfold. If minor wave 4 is to be a flat correction, then minute wave b will have a minimum requirement of 0.9 the length of minute wave a. If minor wave 4 is to be a triangle, there is no minimum nor maximum for minute wave b within it.
Minute wave b may make a new high above the start of minute wave a at 1,279.45, for both a triangle and flat, as in an expanded flat (a very common structure) or a running triangle.
The structure of the correction cannot yet be seen as complete.
ALTERNATE ELLIOTT WAVE COUNT
Click chart to enlarge.
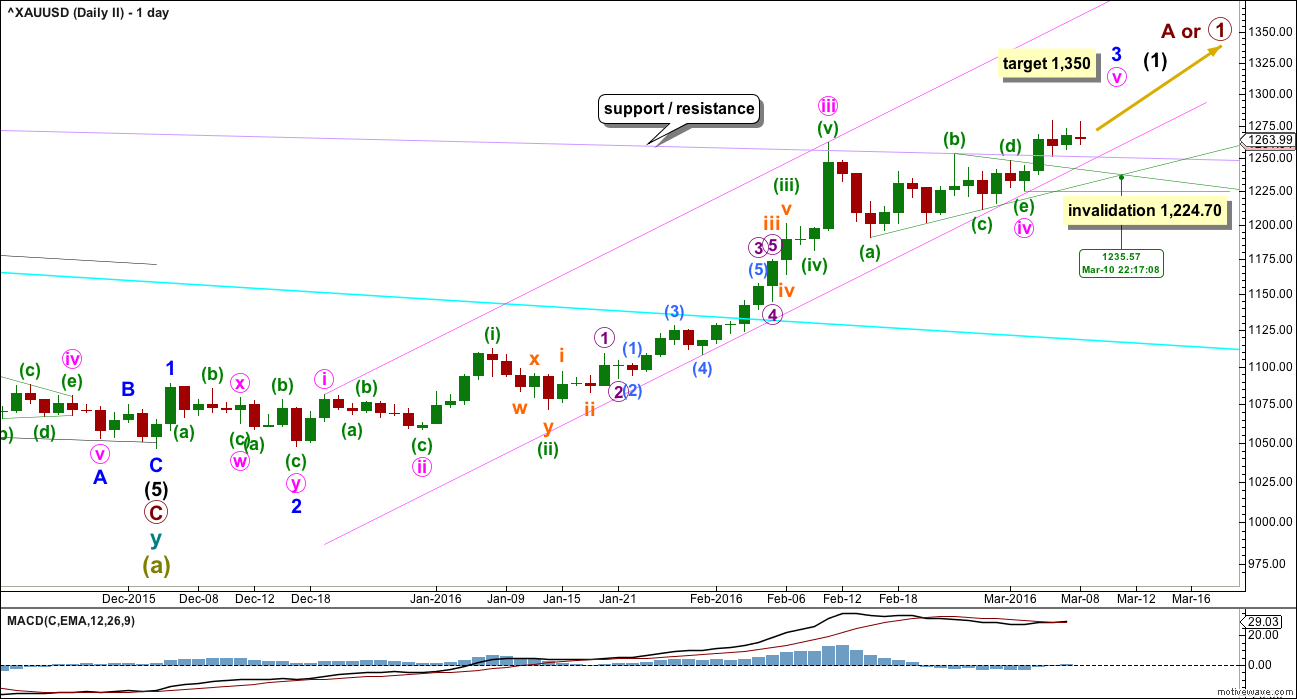
This alternate wave count has a low probability. It is published to consider all possibilities. Price needs to move strongly higher in the next 24 hours for this alternate to now have the right look. If that does not happen, then this alternate may be discarded.
By simply moving the degree of labelling within minute wave v down one degree, the upwards movement that ended on Friday may be only the first wave within minute wave v.
Minute wave v may be extending.
At 1,350 minute wave v would reach 0.618 the length of minute wave iii.
Downwards movement for Friday found support at the lilac trend line.
Minor wave 3 may end on 10th March, if it ends when the triangle trend lines cross over.
Click chart to enlarge.
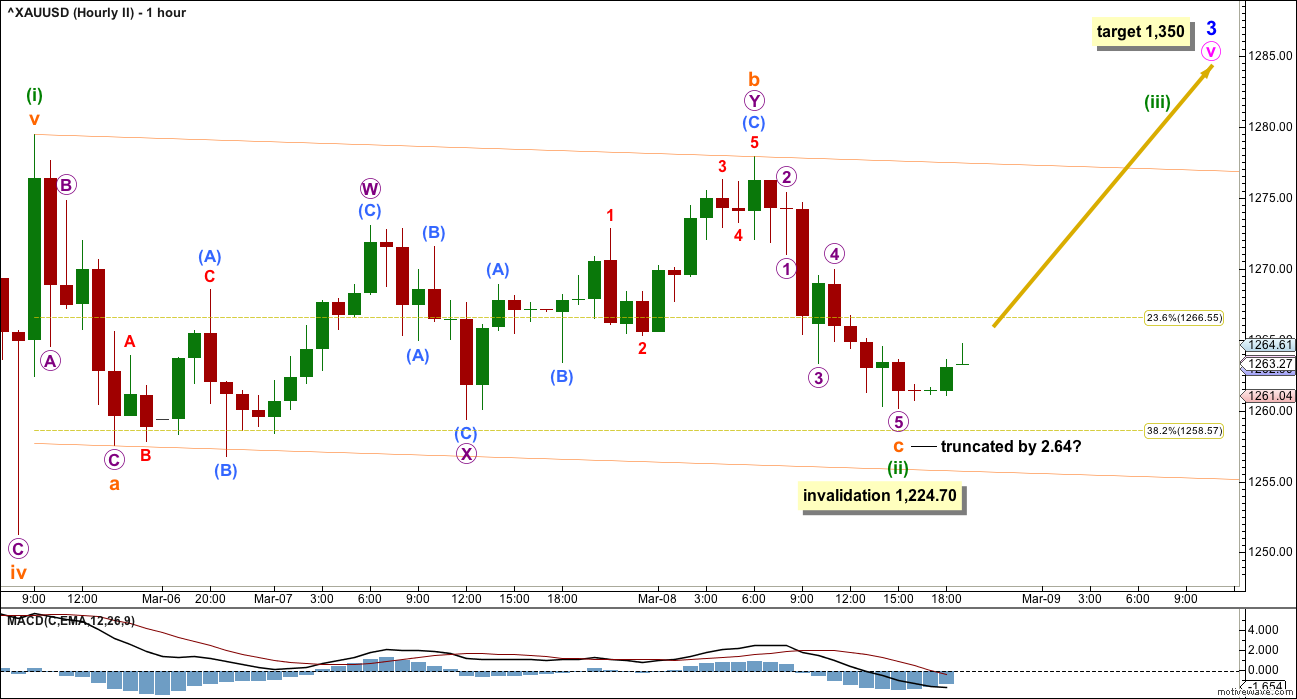
A flat correction may be unfolding sideways. This idea works in the same way for both this alternate and the main hourly wave counts. For the main hourly wave count, the flat correction would be only minute wave a within a larger more time consuming structure for minor wave 4.
If a flat correction is unfolding, then subminuette wave a is a complete zigzag. Subminuette wave b would now be a complete double combination which has retraced 0.93 the length of subminuette wave a. This would be a regular flat correction.
Subminuette wave c now looks like it may be complete, but if it is over here it would have ended with a 2.64 truncation. This is not technically a running flat (a very rare structure) because subminuette wave b did not move beyond the start of subminuette wave a. But the truncation does reduce the probability for this wave count.
I am labelling minuette wave (ii) as complete despite the truncation because for this alternate wave count it really should be over now. It should not take much longer than this for a correction at a low degree to complete within a strong extended fifth wave. Because of the truncation the possibility that micro wave 5 within subminuette wave c will continue lower must be accepted.
Minuette wave (ii) may not move beyond the start of minuette wave (i) below 1,224.70.
TECHNICAL ANALYSIS
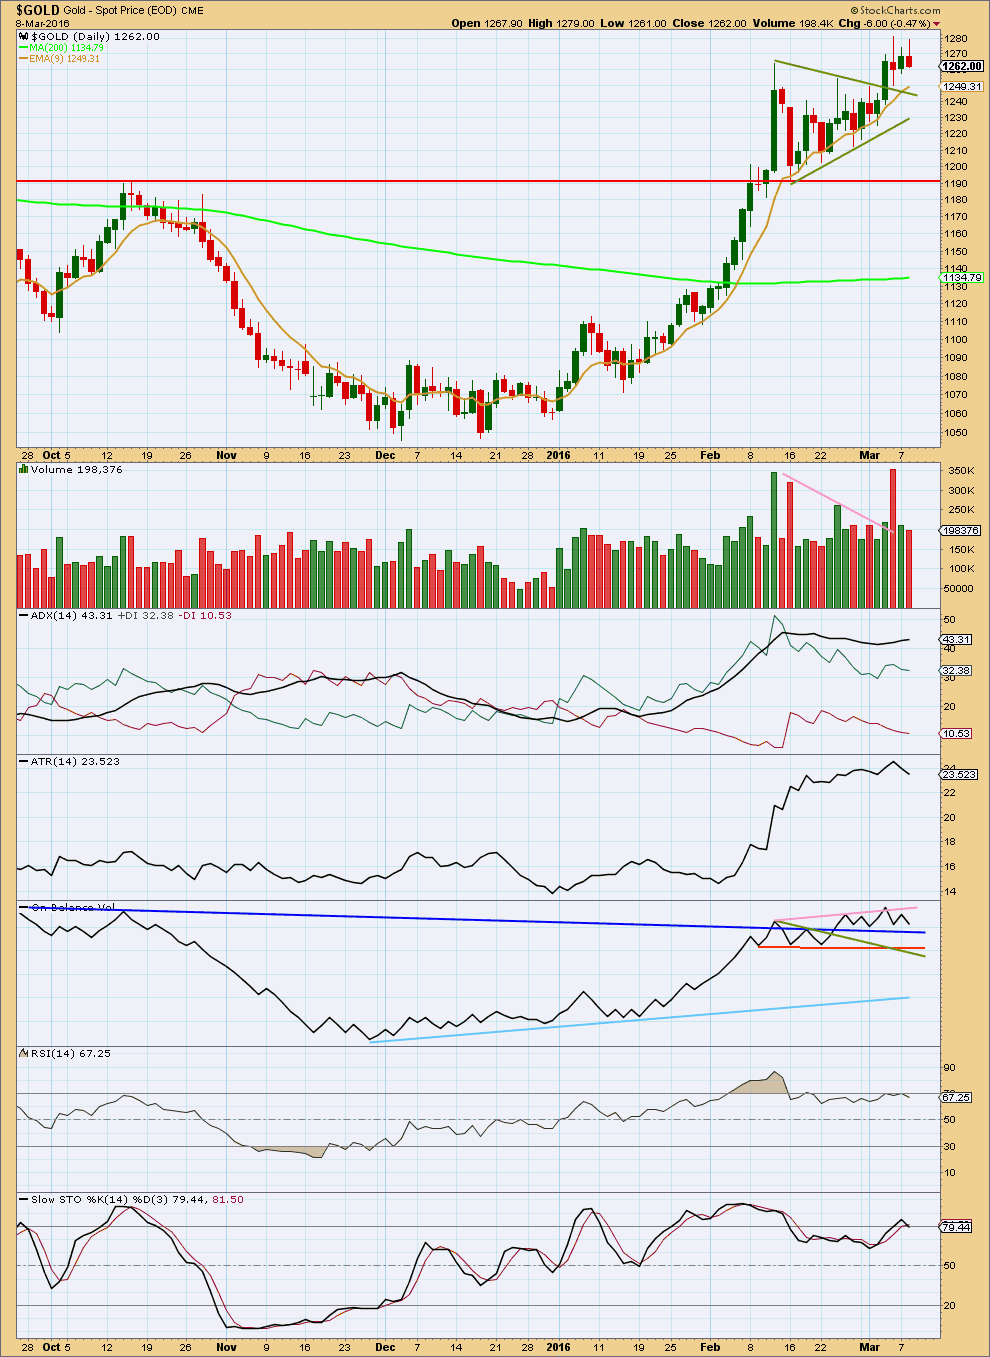
Click chart to enlarge. Chart courtesy of StockCharts.com.
Two things on this chart strongly indicate upwards movement is over for now for Gold: the volume spike for Friday and strong divergence between price and RSI.
Gold often ends its fifth waves on a sharp movement with a volume spike. Friday’s volume spike looks typical. That volume is for a downwards day which further reinforces the idea that more downwards movement is now ahead for Gold. The fall in price was supported by volume on Friday.
Two days in a row of small sideways movement to complete small candlesticks comes with declining volume. This movement looks typically corrective. As a correction unfolds, volume normally declines.
ADX has caught up with the trend. It is indicating there is an upwards trend in place. This is a lagging indicator.
ATR disagrees today as it is declining.
On Balance Volume found resistance and turned down at the pink line. Look for OBV to find support at the blue line; this line is almost horizontal, repeatedly tested and long held. It should offer fairly strong support.
Stochastics is returning from overbought and RSI is returning from almost overbought.
This analysis is published @ 08:07 p.m. EST.
Just a view…. Gold price appears toppy. Not too sure if this will get past 1257 before a pullback (short term down move) is seen for a likely break below 1244; subsequent upside move is expecting…. Will look to short any rise towards 1270-76 in any case…. Lets see how this pans out.
Golds going to drop tomorrow 7:45am New York time
Goldman doubles down on euro short position.
Just saw this article :
http://www.bloomberg.com/news/articles/2016-03-09/rbnz-unexpectedly-cuts-rate-on-inflation-outlook-kiwi-plunges
Which made me look at your last NZD/USD analysis… spot on! AGAIN 🙂
For now I expect downwards movement is over. I’ll be expecting some upwards movement from here.
Its a B wave. It may be any corrective structure.
It could also be an X wave of a double flat or double combination.
It will be absolutely impossible to tell what structure it will take and so to tell what pathway price may take on the way up. It could be a swift sharp zigzag, or it could be a sideways triangle or combination.
This upwards move may make a new high.
I am very concerned that members appear to be trying to trade small waves within a correction. This is advised only for the most experienced and nimble of traders. Now, I have no idea what your experience is so this warning comes only for the more inexperienced traders:
Don’t trade corrections. They are an opportunity to step aside, wait, and then join the trend when they are confirmed as over.
It is the trades you don’t take which often make the difference between profit and loss. One aspect of risk management, which is THE MOST IMPORTANT aspect of trading is knowing when to step aside.
My analysis and labelling of a correction will change as it unfolds. You cannot use my analysis of a correction as a road map of what you may expect price to do with the small swings in a correction, because the analysis will change.
There are 23 possible corrective structures. A fourth wave may be any one of those. I cannot tell which one it will be because I’m not psychic. I base my analysis on technicals.
Kenny Rogers “The Gambler” ” You gotta know when to hold, know when to fold, know when to walk away and know when to run. Never count your money while you’re sittin at the table, there’s time enough to count when the dealings done” (Apropos of Lara’s statement of trying to trade corrective moves,unless VERY experienced! This Aint Gambling, this is managing your money !
LOL
I liken it to surfing too.
Wait patiently for the next set, don’t try to catch a smaller wave between sets, they’re harder to catch and the ride is shorter. And if you do try to catch them you often miss them, and then turn around and see the set approaching and you’re too far in to catch the good wave.
Then on my longboard I get hammered by the set.
I’ve learned patience. In surfing and trading.
“There are all kinds of Love in the world, but never the same Love twice” (F. Scott Fitzgerald). “There are all kinds of waves in the world ,but never the same wave twice” ( Lara)
Lara – might this help…???
https://play.google.com/store/books/details?id=6e5VBQAAQBAJ&source=productsearch&utm_source=HA_Desktop_US&utm_medium=SEM&utm_campaign=PLA&pcampaignid=MKTAD0930BO1&gl=US&gclid=CLmLkYm3tMsCFQPmDQod36cAeA&gclsrc=ds
Only $9.99 (reduced from $15.99 – wonder if she saw that coming??!!) – absolute bargain imho LOL 🙂
ROFL
🙂
Lara , with what has happened last evening ,and today, are you still expecting a move up to 1279 as a strong possibility before this corrective move down is over???
Yes.
That is Great to hear. I kept the small amount of GDX I bought at day low Monday close and it is in a slight profit now and I will wait for higher up to sell before drop deep down in minor wave 4.
I could be wrong Richard. As you know.
I’ve posted my five minute chart of how I see the last wave down below. It does all fit perfectly as an impulse, and the middle of the third wave has a typically long second and quick fourth.
But… if I’m wrong there could be another push lower.
Volume will as always be important today. Light volume would support the wave count and support the idea Gold is still in a correction. Heavy volume would indicate a possible new wave down unfolding.
But I still can’t see intermediate (1) up as complete. So one final fifth wave up is still needed, which means this move so far should be a fourth wave correction.
Gold is moving as u analysed lara…thank u..
Can u put an eye on oil…its touching upper maroon line..and made a small new high..can we consider it as a sign of completion wave 2…??..what the structure say..??
The maroon trend line is not quite reached yet. It is a little above this last high.
I cannot see the structure complete yet. If I’m right then there should be three more highs, with three more small corrections in between each.
That maroon trend line may be overshot for that to unfold.
Keep using that lilac trend line. While price keeps finding support there don’t worry about structure, expect price to keep going up.
When that lilac line is breached then you may expect that the correction is over.
Thank u..
Waiting for a reversal to join the down trend..
Exactly. It may take a while, maybe even another week, for the structure to complete.
I’m also waiting for that lilac line to be breached before I enter short on Oil.
I’ll be waiting for a breach, then a throwback for resistance at the line. That is my absolute favourite set up for a low risk entry opportunity because it
1. means the stop can be set close at the last high
2. enters the trade after trend line confirmation of a trend change
3. usually enters at a very good price point, stop can be set close to entry, keeping position size reasonable can mean the risk is very low.
I am considering minute wave a finished at 1242,80……I am long from 1247 with stop at 1242 because the first leg up from 1242,80 on the 15 min chart seems in five, so the min is invalidation point at the moment. I have the exit point at 1277 where minute b wave will be near at the finish if minor wave 4 will be flat or expanded flat…..if instead minor 4 will be triangle….I will wait and I will calculate a new target for minor 5……Sorry for my english guys…
I agree. Also long about same target or 1276 would do for a flat. But… maybe it will not be 1more, market likes to full people, we need be carefull with this target. I would say minimum is 1265 anyway(61,8%) and I have some longs pending in 1252 in case they decide to dump it back 1more time :))) This would also make the right shoulder of a nice H&S if it plays this way and target would be 1274ish! But, stop at 1241.
Any idea how high gold may go today?
Wave count anyone?
Did gold complete a five wave up yet from the low today and how low may it retrace today?
On the five minute chart the upwards movement looks like it could be either, sorry Richard.
It may be an impulse with a larger fourth wave than the second.
Or it may be a zigzag with a long A wave and short C wave.
IMO the impulse has a slightly better fit.
But it could be either. And on the hourly chart it looks like a three.
the correct chart
Nice chart. I think it is possible i was looking at that too, it’s just that some waves overlap each others for a very small margin however, maybe it depends on data provider and it does not in fact, on mine your i and iv overlap abit… Can you confirm the low and high you have there maybe? I am also considering 1 more pattern with a double zigzag 5-3-5 and the last 5 in a ending diagonal… meaning there could be 1more wave down to 1240-1242 and then done… And this is only if it does not take 1261 on the upside very soon now. Anyway it took my stop at 1247 and made it back at 1244-1245 lol after i saw this structure… and im risking it too stop at 1223 now:))) Coz expecting a wave B up at least soon. Gluck! 🙂
The fourth wave does slightly overlap the first wave.
I’m looking on the five minute chart to see if the solution is in the first and second wave. If the first ended higher, and the second wave an expanded flat or combination then it would meet the rule.
I think I have the solution.
This meets all the rules. It has in the middle of the third wave a time consuming second wave at minuscule degree, and a quick fourth wave. That’s actually typical for Gold, it gives its impulses a curved three wave look to them at higher time frames.
I think that’s what has happened here.
Maybe is finished minute wave A within minor wave 4
There is an error in this chart…..see the chart up
Gold and the miners took an extra deep drop of an extra $19 from the close at 1261.53 down to low at 9:40 am of 1242.99. Good thing I only had minimal amount of miners.
The longer gold stays down at these prices the cheaper miners will drop today as they adjust to a temporary new normal price.
Nothing invalidated at this point. Closet invalidation for both counts is at 1,224.70.
The daily charts have a triangle crossover change point dated March 10th and at 1236.43 and 1235.57.
Great analysis, Lara! Do you think subminuette wave c of y of a is done at last night’ low and we go up now to complete a wave minuete (b) ? I can count a 5waves down including an extended 3 within this subm.(c) of y. On the 5min. chart… thinking last night’s decline from 1265 to 1251.5 was in fact microwave (v). Counting a microwave (i) from 1278 to 1271.5 yesterday 1st 2hour candles down… Possible? Sorry don’t have acces to charts now just want more confidence as I went long lol… stop at 1247… (allowed bit room for market if i am wrong) 🙂
I think the market answered your question for me.
I do not advise trading small waves within corrections.
Because of the huge variation of structure (23 possible corrective structures) it is impossible to tell which will unfold, and so my Elliott wave analysis should not be used as a road map for the pathway price will take during a correction.
The labelling and expectations will change as the structure unfolds.
Well… indeed, but I’m back to break even today with gold, all good :))) And more good on spx, ndx 🙂 So far at least. I think we had the low for this 1st part of correction at 1242 today. There are nice RSI, STS divergenices on the 1hour chart too! Let’s see…