
Both hourly charts yesterday expected downwards movement short term which is what happened.
Summary: The correction is still most likely incomplete. Some upwards movement for the next day or so may be a B or X wave which could make a new high. Thereafter, downwards movement should complete the correction. Look out for a trend change at the end of the session for 10th March.
New updates to this analysis are in bold.
Last published weekly chart is here.
MAIN ELLIOTT WAVE COUNT
Click chart to enlarge.
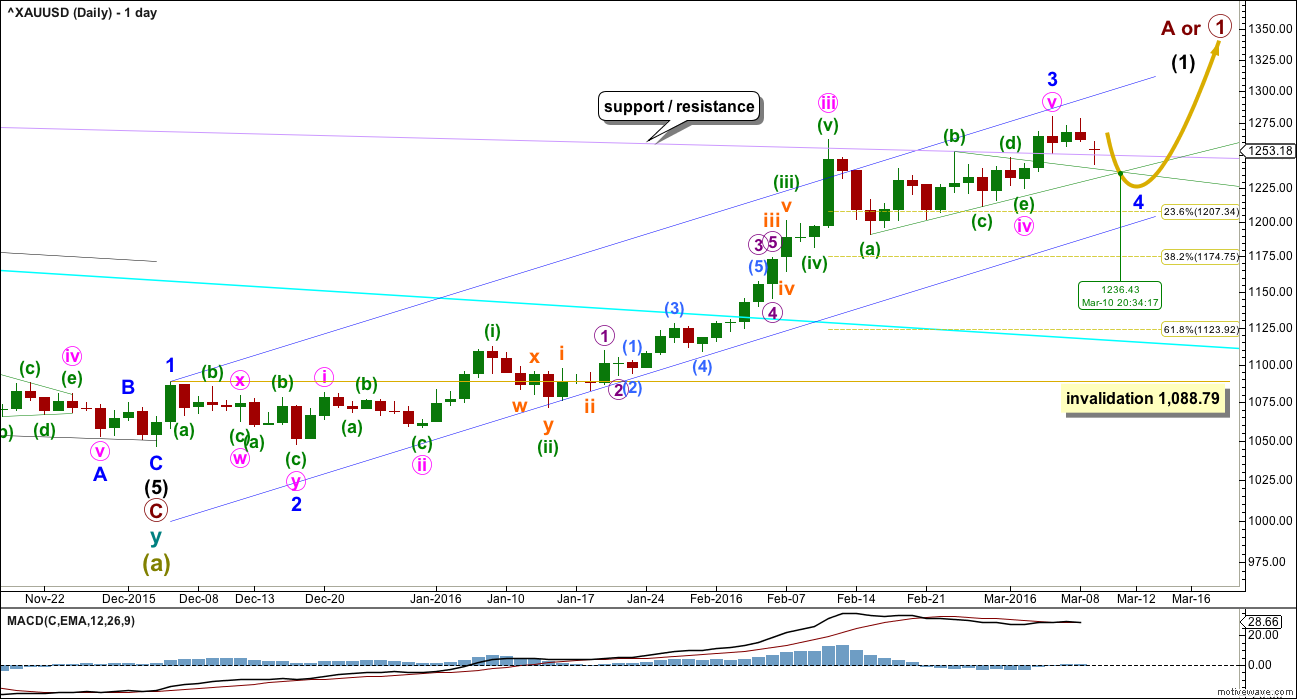
Gold has very likely changed from bear to bull.
So far, within the first five up, the middle of the third wave is now most likely complete. The strongest move may still be ahead. Gold typically exhibits swift strong fifth waves to end its third wave impulses. Look out for surprises to the upside for minute wave v and minor wave 5.
Friday’s upwards movement may have completed minor wave 3.
Ratios within minor wave 3 are: there is no Fibonacci ratio between minute waves iii and i, and minute wave v is just 0.07 short of 1.618 the length of minute wave i.
Minor wave 2 was a very deep 0.97 double zigzag lasting nine days (one more than a Fibonacci eight). Given the guideline of alternation, minor wave 4 may be expected to be a longer lasting sideways structure such as a flat, combination or triangle. It may last a Fibonacci thirteen days most likely. If it is a triangle, it may take longer, perhaps a Fibonacci twenty one days.
Minor wave 4 may end within the price territory of one lesser degree. Minute wave iv has its range from 1,261.94 to 1,190.9. The most likely target for minor wave 4 would be the 0.236 Fibonacci ratio at 1,207 as it lies within this range. Today’s low for part of minor wave 4 is now within this range.
The triangle trend lines now cross over on 10th March. A trend change may be seen on this date. It does not have to be the end of minor wave 4. It may only be the end of minute wave b within it.
Wednesday’s candlestick broke below support at the lilac line to find support at the upper (b)-(d) triangle trend line. This line may continue to provide support and may be where minor wave 4 eventually ends in a few days time.
Click chart to enlarge.
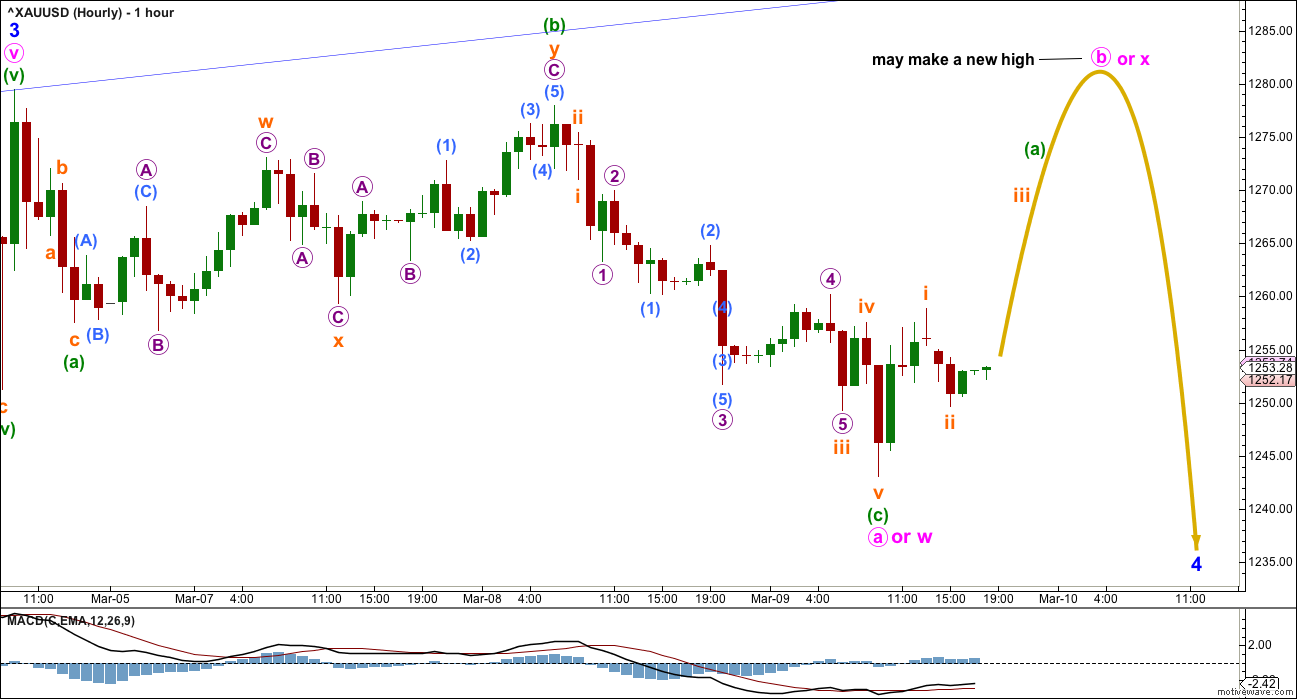
There are several structural possibilities for minor wave 4. It may be a flat, combination or triangle most likely to exhibit alternation with the double zigzag of minor wave 2. The labelling will change as this correction unfolds and as the structure becomes clearer. It is still impossible at this early stage to tell which of 20 possible structures is unfolding.
For each of a flat, combination or triangle the first wave for minute wave a or w must be a three wave structure. So far downwards movement labelled minute wave a or w subdivides as a regular flat correction.
I have taken some time today to check the structure of minuette wave (c) on the five minute chart. It will subdivide perfectly as a five wave impulse. Within micro wave 3, there was a typically swift strong fifth wave for submicro wave (5), which forced submicro wave (4) to be brief and shallow. The subdivisions fit perfectly on the five minute chart, but on the hourly chart micro wave 3 has a curved three wave look to it.
Minute wave b or x may be any corrective structure. Of all Elliott waves, it is B waves which are the worst to trade and analyse, so it is best to avoid them.
If minor wave 4 is unfolding as a flat correction, then within it minute wave b must retrace a minimum 0.9 length of minute wave a at 1,275.81. An expanded flat is a very common structure. That would see minute wave b end at 1.05 the length of minute wave a or above; this is at 1,281.27.
If minor wave 4 is unfolding as a combination or double flat, there is no minimum requirement for minute wave x within it. Minute wave x may make a new high above the start of minute wave w.
If minor wave 4 is unfolding as a triangle, there is no minimum requirement for minute wave b within it. Minute wave b may make a new high above the start of minute wave a as in a running triangle.
When the structure of minute wave b or x is a completed three, then downwards or sideways movement would be expected for minute wave c or y.
So far minor wave 4 has lasted just three days. It should continue longer to have good proportions on the daily chart. It may be expected to be a Fibonacci eight or thirteen days most likely. If it is a flat correction, it may be more brief than minute wave iv which lasted fourteen days, because triangles are more time consuming structures than flats.
ALTERNATE ELLIOTT WAVE COUNT
Click chart to enlarge.
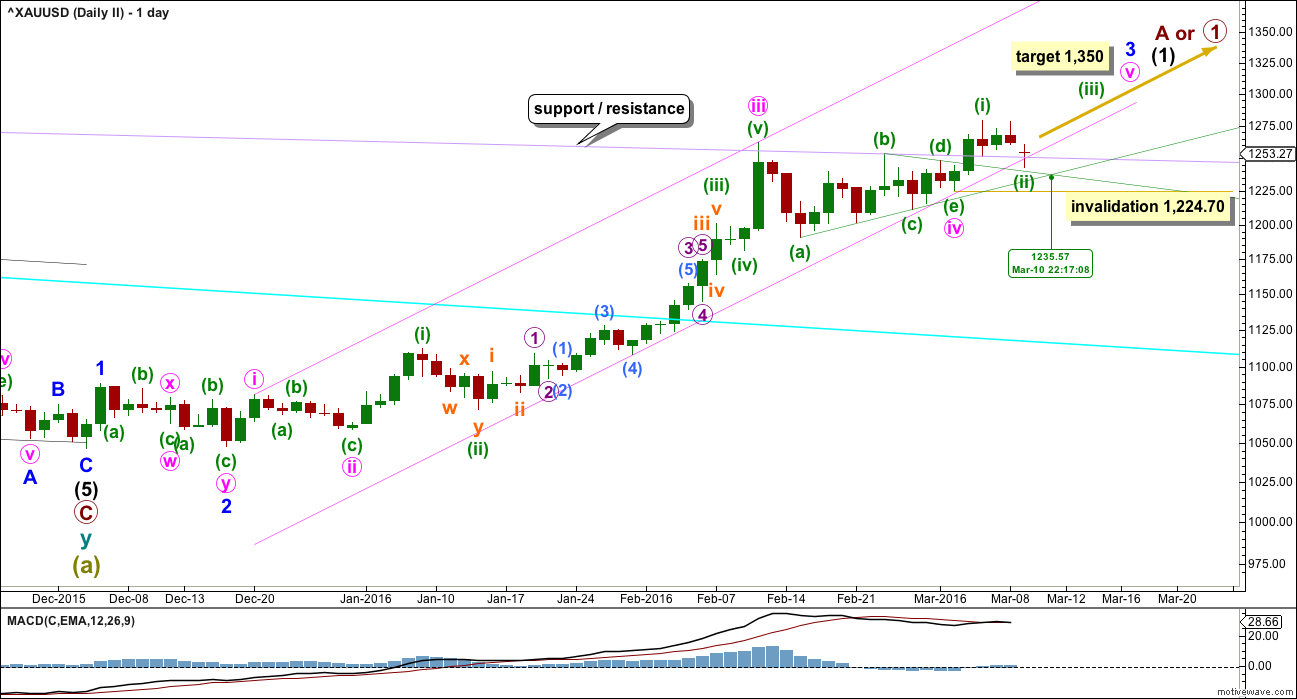
This alternate wave count has a low probability. It is published to consider all possibilities. This wave count is still viable but today the probability is reduced. Both wave counts expect upwards movement from here, so there is no divergence in expected direction. The structure of upwards movement should indicate which wave count is correct.
By simply moving the degree of labelling within minute wave v down one degree, the upwards movement that ended on Friday may be only the first wave within minute wave v.
Minute wave v may be extending.
At 1,350 minute wave v would reach 0.618 the length of minute wave iii.
Downwards movement for Friday found support at the lilac trend line.
Minor wave 3 may end on 10th March, if it ends when the triangle trend lines cross over.
Click chart to enlarge.
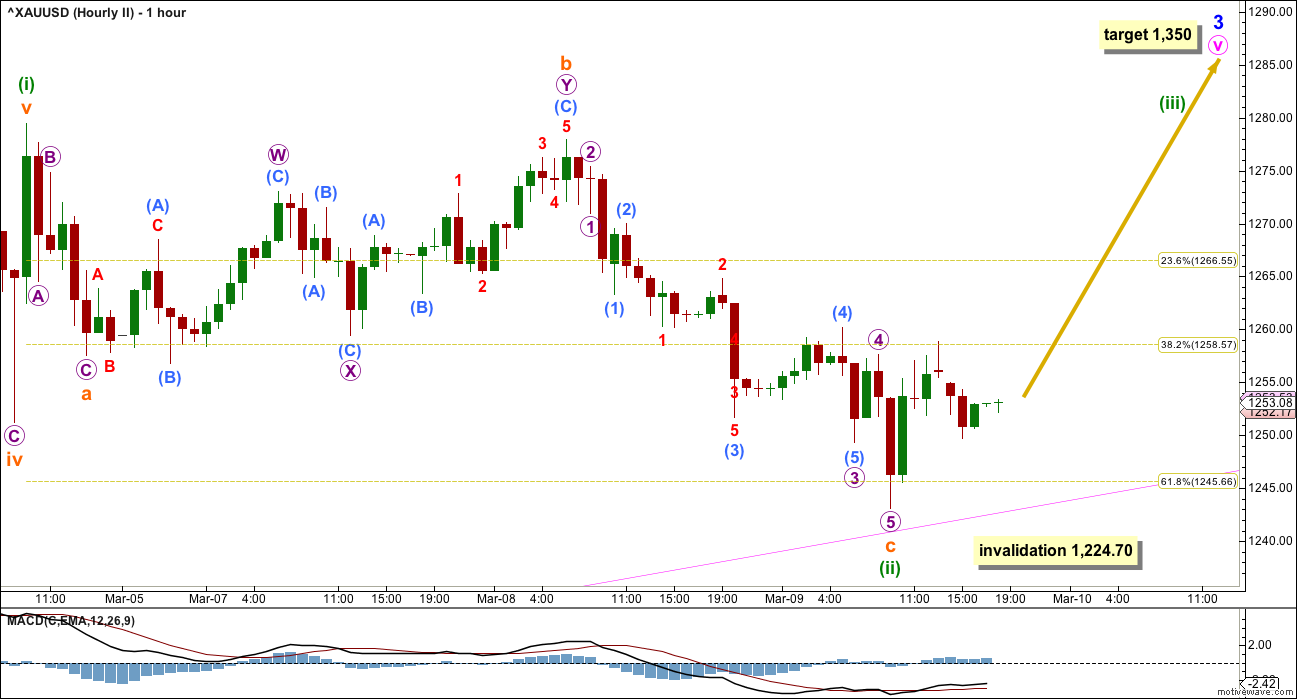
Minuette wave (ii) may be a completed flat correction ending just below the 0.618 Fibonacci ratio of minuette wave (i). This wave count now expects to see a five wave impulse unfold upwards which should show a strong increase in upwards momentum.
If the next wave up looks like a five and shows an increase in momentum beyond the last high labelled subminuette wave b, then this wave count may be correct. This wave count expects to see a strong surprise to the upside.
Minuette wave (ii) may not move beyond the start of minuette wave (i) below 1,224.70.
TECHNICAL ANALYSIS
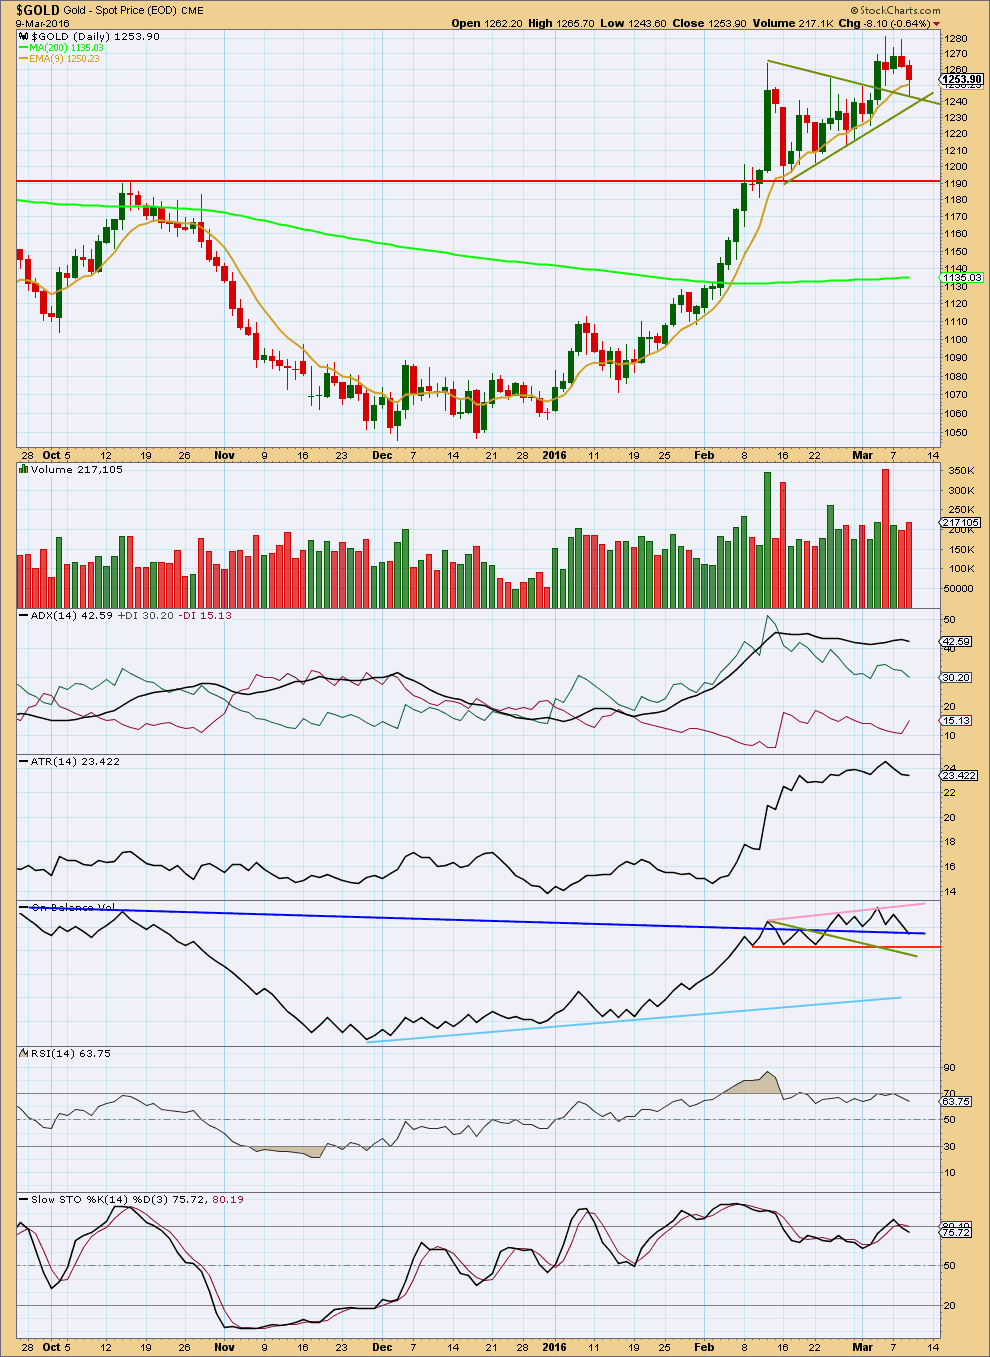
Click chart to enlarge. Chart courtesy of StockCharts.com.
Two things on this chart strongly indicate upwards movement is over for now for Gold: the volume spike for 4th of March and strong divergence between price and RSI.
Gold often ends its fifth waves on a sharp movement with a volume spike. The 4th of March volume spike looks typical. That volume is for a downwards day which further reinforces the idea that more downwards movement is now ahead for Gold. The fall in price was supported by volume on Friday.
Some increase in volume for Wednesday’s session supports the fall in price. Overall, volume remains light, but it is slightly concerning that Wednesday saw some increase. The alternate wave count should be expected to have a very low probability for this reason. Volume is telling us there is support for downward movement, not upwards.
Price has come down to find support at the upper green line of the triangle pattern. This looks like typical throwback.
ADX is declining today indicating the market is consolidating. ATR agrees. With these two indicators now in agreement, more confidence can be had in the main wave count.
On Balance Volume found resistance at the pink trend line. OBV has come down today to touch the dark blue line which is highly technically significant. A bounce up from here by OBV would be most likely.
Stochastics has returned from overbought as has RSI.
This analysis is published @ 07:47 p.m. EST.
Ok trading scouts and guides no overnight playing with fire tonight trading dangerous ‘b’ wave corrections. Do it in the morning when you can see what surprises or reversals happened overnight and when you know what you have to work with in the morning. LOL
I won’t buy DUST tonight as GDX – MACD 195 minute is not close enough to the top, not overbought yet and GDX is looking very strong today on all time frames 1 minute up to 1 day. I already took my GTX profits today. I’ll wait for another GDX low and also a day where most time frames on MACD are giving a morning BUY for GDX like they did Wednesday morning, a really great minimal risk buy instead of staying bullish or bearish overnight against Lara’s multiple warnings.
Does the Move from day low to day high looks like minutte 1 of minor 5…and are we in minutte 2 now…???…
Comments..??
That new low looks like a b wave of an expanded flat for minute wave b.
I’ll leave my labelling of minute a or w in the same place.
Minute b is now in minuette (c) up to complete an expanded flat correction. So this move up from the low needs to subdivide as a five.
And that right there is why expanded flats make wave counting so tricky. Here we have a five up off a low, which would make most think its a new trend, here we come minor 3 end.
Not necessarily. This fits still as part of minor 4.
And it could make a new high and be a very common corrective pattern.
If minor 4 is to be a flat minimum requirement for minute b up is 1,275.81. Which is not met yet.
Excellent, thank you Lara. I had some count and played well today. However, what are the chances of the green (a) being in fact the purple (b) – would be very small and simple so very unlikely- and then the green (b) being in fact the purple (c) and end of this correction at the low with minor 4? Is there any chance of this happening at this point in time? Slim to none or none? I am just asking to consider this possibility too or not, i say 10% chance for this…. 🙂
I think it will be too short for minute wave degree….i cant say whats the rule though
Hi Lara, one question ….. Yesterday, in the 5 minute chart, we have count as a perfectly five, minuette a wave within this minute b wave, but if minute b wave is expanded flat , minuette a wave cannot be in five….but it must be in three….. How we can avoid these mistake?….is there something that can help us on it?
Thanks!
I think you’re getting the degrees confused?
So on the main hourly bear which sees minor 4 unfolding: minute a is a three, its a regular flat.
Minute b is now also a three, its an expanded flat.
No violation of any rules there so far.
This could be a double flat labelled minute w-x with y to come
Or this could be a single flat labelled minute a-b with b to move higher to meet the 0.9 of a requirement, then c down to come.
Yesterdays count with a down as a perfect five was not a mistake. That’s still how it’s seen. That was minuette (c) down of a flat correction for minute wave a.
When it comes down to Elliott Wave, Lara could write an Elliott Wave book, when many Elliott Wave experts don’t even go by the Elliott Wave book.
Minute b within minor 4 is expanded flat(335)….yesterday I have counted minuette a within minute b as a five ( my mistake) and you said that this wave it was possible count in three and in five….
Maybe minor 4 is not a flat. I dont think we”re in Kansas anymore TOTO !!
Its a relaxing time now…had some cautious gain today…playing with corrections is like playing with fire…you know that if you do it wrong than got burnt… :)..
And once again thanx lara for your guidance..
You’re welcome. Trading a low degree B wave… yes, playing with fire that is.
Glad it worked out. But remember, next time I may not be able to be so accurate.
Too much variety in possible moves for B waves.
Long this B wave up to 1281 adding ti comex april gold positions in here.
I am out… gluck! I think indexes sp500 might post a small rally up for a wave (ii) now so prolly gold could go down when that happens, after that … shall see 🙂
Out at 1273 ,this may not be a flat lara. Going lightly short in here with stops above 1282 (mental only)
I though of going by buying some DUST at the close, however multiple longer time frames for MACD on GDX are still bullish at the close today. I’ll wait to see some MACD buys for GDX in the morning.
Here is the chart I have. Validation if this trully an extension of minor 3 ( i also think not now…) would come only if it makes a new high and stays there for a while , not just spikes at a new high above 1280 and imediatly comes back down. We shall see… but is really risky atm to enter unless you did already lower, I am exiting 1273-1275 then will wait, my stop is at low 1256 in case small iv is not over yet, last small position only! I think most likely we end wave B up somewhere between 1270-1280 today… Lara, where are you? 🙂
On the other hand, is there any actual chance that minor 4 ended even at 1236 today??? Gold is in a impulse up now… that can be wave C of the expanded flat but at 1264 the 1,618xA was exceeded, ofc it can go more but usually not… Anyone have thoughts??? I am having a hard time deciphering the miniwaves from the decline from 1258,8 that started yesterday to 1239 today, was that a 3 wave abc or wxy of expanded flat B or in fact can it be a C down to end minor IV? Maybe Lara can shine a light on us! 🙂
lol. I’m trying to stay focussed.
minute c would be a down move within Minor 4 right?
So how to view the lower low of Mar 9 to Mar 10 am, that the thing that gets me too. I want to just push minute a to the lower low but have no idea what I’m doing.
So did Minor 4 end in just 5 trading days. (today’s up move IS very impulsive) But I’ll bet Lara will say its not over yet.
Looking forward to her perspective as well. 🙂
Yes, minute c would be a down move within Minor 4. To end minor 4
I know Lara states B waves are the most difficult to analyze and does not recommend trading them. That said, is anyone trading this wave? lol.
“If minor wave 4 is unfolding as a flat correction, then within it minute wave b must retrace a minimum 0.9 length of minute wave a at 1,275.81. An expanded flat is a very common structure. That would see minute wave b end at 1.05 the length of minute wave a or above; this is at 1,281.27.”
… a combo, no minimum
… a triangle, no minimum
Just wondering what others may be using for targets and what you think this wave is looking like. I am short term trading this and exiting when C wave unfolds to re-enter at end of Minor 4.
Thoughts? 🙂
It can happen if right now there is a 4 of 5 of C up developing… reentered 1263 with stop just 1256… But very mall position 🙂
Yes I traded this b wave. I bought a small position in GDX at day low Tuesday because b wave would likely go up higher. I already sold GDX at a profit today due to lack of clarity of how high it could go and needed to sell before potential direction change.
I’ll wait for Lara comments this afternoon before maybe buying another small position today. There is also her comment that at the end of session today March 10 there may be a trend change.
Today i think it will be a high volume day…a positive close will be a relief site for bulls
A positive close today may look bullish, however, there is the warning of a direction change after today’s session ends and the analysis is still looking for a lower end to this minor wave 4 with a likely target of 1,207 before minor wave 5 up to end intermediate wave (1). I wouldn’t recommend holding a large bullish position tonight.
Volume will be very interesting. Light volume = this is a correction. Heavy volume = maybe minor 4 is over surprisingly quickly.
Possible we just completed expanded flat at 1237.5, b wave being 1.38 x a wave from 1243.5-1259.8 yesterday. Now starting c wave up with target of 1264.1 based on 1.618 x a wave.
Great call! Do you think up move and B already ended so fast at 1263.5 or we extend more up? Hard to tell with all this market volatility today! Closed longs at 1263 i had from yesterday and holding 1 runner only now (had stopped at 1233 today and got few more in 1241 today), but i agree like Lara said, trading this corrections certainly are not advised for everyone… 🙂
Thanks. I took profits at 1264. Thinking 1 more fifth wave up on 5 min chart. And then see where things play out. If we start heading higher to 1270, would not be surprised to see 1281. Otherwise that could be it and we head lower.
Expanded flat…
U mean to say correction in a correction…??..
Im not getting it…hmmm…can you please chart it daniel
Daneric is targeting the virgin wave space around 1500 for a top, then way down to 500 for some more virgin wave space. Ouch!
If Lara’s count is correct, this overall correction cannot be a zigzag though, since she has the “a” wave down as a “3”. Time will tell….lots of time, that is….
Another look
Looking at the current momemtum…and being in an intermediate 1 still…i think 1500 target maybe too low for this correction…yaa time will tell
Just a simple alert…. Hope no offense but… Daneric used to say in 2011 that the bull market ended and he was seeing for straight 5months or so ABCs and invented elliot waves counts. He is not bad, just I would not relly alot on his opinions, unless he is better elliot wave theoretician now! 🙂
I agree. He’s no Lara. Just another viewpoint. I trust my trading to Lara’s count.
Dreamer very well said.
Minute wave b began at the Wednesday low of 1,242.99.
“Minute wave b or x may be any corrective structure. Of all Elliott waves, it is B waves which are the worst to trade and analyse, so it is best to avoid them.”
Lara, you mentioned, “Look out for a trend change at the end of the session for 10th March.”
Thursday is March 10th, which direction might gold move in the direction change then?
The opposite direction to the one it’s going in.
It might be the end of upwards movement for minute b and the start of minute c down.
This trick doesn’t always work. Just often enough to be a tendency to look out for