
Last week’s analysis expected upwards movement from Silver, but price so far has moved sideways remaining above the invalidation points.
Summary: The trend remains up. The target for the next interruption to the trend remains at 16.802.
New updates to this analysis are in bold.
WEEKLY WAVE COUNT
Click chart to enlarge.
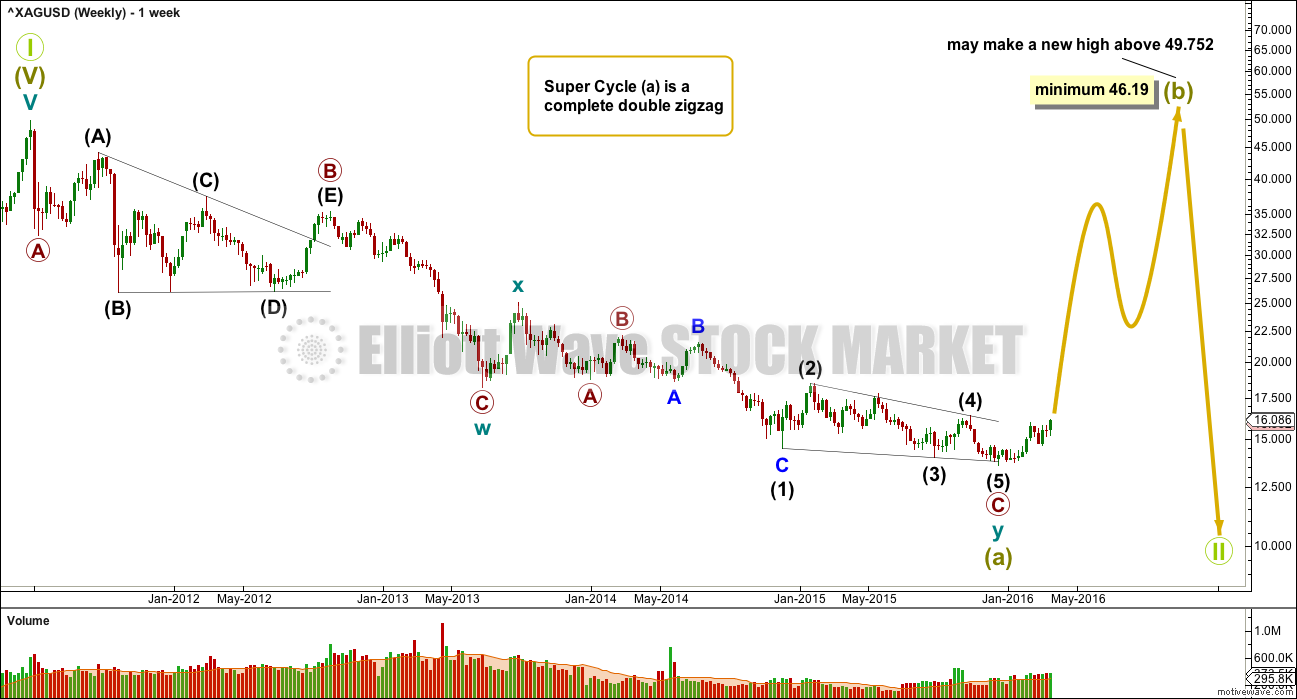
If super cycle wave (a) is a double zigzag, then within the second zigzag of the double labelled cycle wave y the structure may be complete.
Primary wave C is an ending contracting diagonal within the zigzag of cycle wave y. All subwaves subdivide as zigzags. The third wave is shorter than the first, the fifth wave is shorter than the third, and the fourth wave is shorter than the second. The trend lines converge.
There is a small overshoot of the (1)-(3) trend line at the end. This indicates the contracting diagonal structure is very likely to be complete.
If this wave count is correct, then super cycle wave (a) has subdivided as a three wave structure. That indicates Grand Super Cycle wave II may be a flat correction.
If this correction at Grand Super Cycle is a second wave (as opposed to a fourth wave), then a triangle may be eliminated.
A combination may also be eliminated because the first wave is a multiple. Combinations may only consist of a maximum of three corrective structures, so within each of W, Y and Z they may only subdivide into simple A-B-C structures (or A-B-C-D-E in the case of triangles). To label multiples within multiples increases the maximum beyond three, violating the rule.
Super Cycle wave (b) must retrace a minimum 90% of super cycle wave (a) at 46.19. Super cycle wave (b) may make a new price extreme beyond that seen for super cycle wave (a) above 49.752 as in an expanded flat.
Super cycle wave (b) may be any one of 23 possible corrective structures. It is impossible to predict at this early stage which one it will be, only to say it is unlikely to be a rare structure such as a running flat, expanding triangle or triple combination. That still leaves multiple structural possibilities. The most likely structure which would be able to meet the minimum price requirement at 23.945 is a zigzag.
The first movement up for a wave of this large degree must subdivide as a clear five at the daily chart level, and probably at the weekly chart level also.
DAILY WAVE COUNT
Click chart to enlarge.
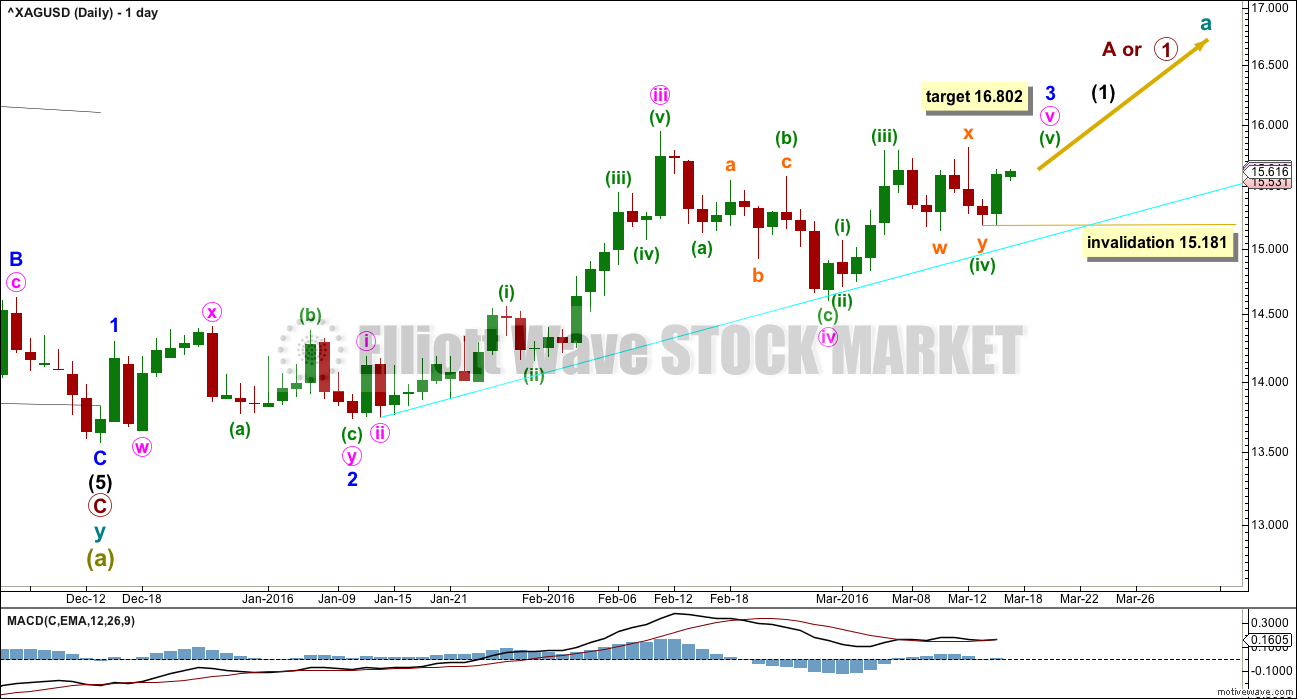
If there has been a trend change at super cycle degree, then a clear five wave structure upwards must develop. This would still be incomplete.
Along the way up, expect price to find support at the cyan trend line. When this line is breached, then intermediate wave (1) may be over.
Within minute wave v, the structure may be unfolding as an impulse. Minuette waves (i) through to (iv) may now be complete. There is poor proportion between minuette waves (ii) and (iv), but Silver just does not always have good proportions. There is alternation between the zigzag of minuette wave (ii) and the combination of minuette wave (iv).
At 16.802 minute wave v would reach equality in length with minute wave iii. If this target is wrong, it may be too high. When there is some structure within minute wave v to analyse, then the target may be calculated at a second wave degree. At that stage, it may widen to a zone or it may change.
ALTERNATE DAILY WAVE COUNT
Click chart to enlarge.
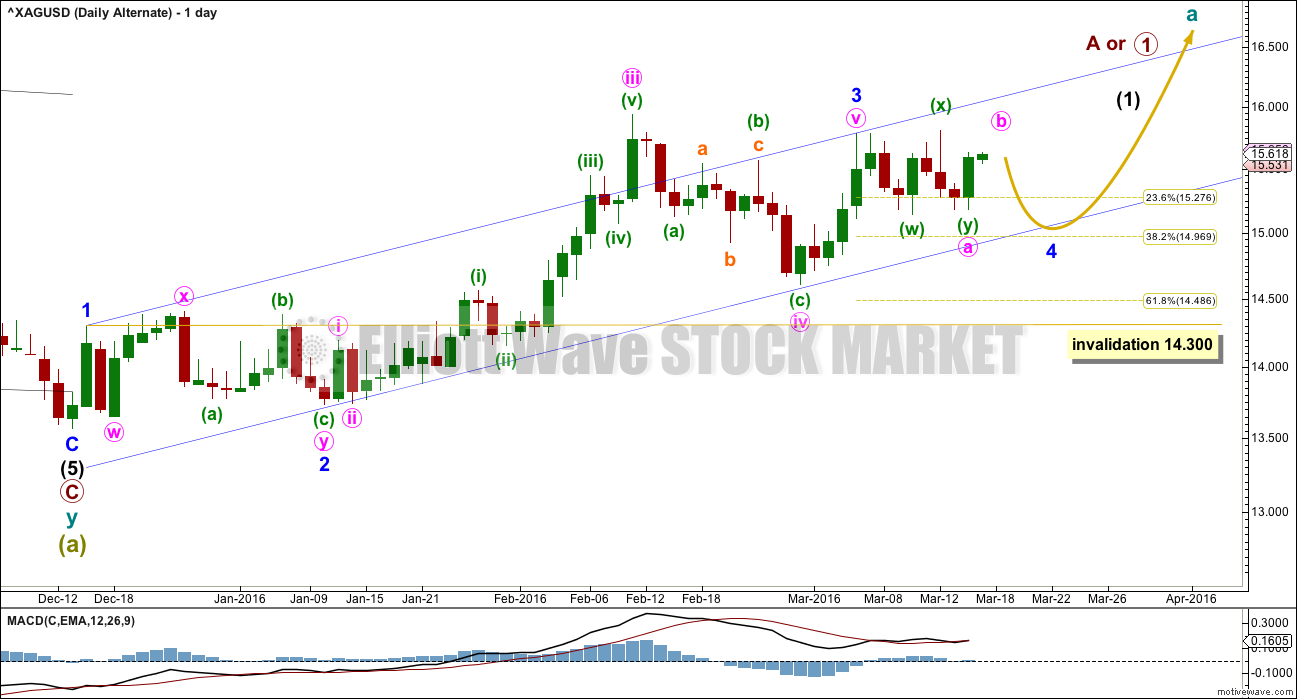
This alternate wave count is new.
What if the current sideways move is a larger correction? This wave count may fit with Gold, if Gold has a short sharp fifth wave up, so Silver may see a B wave up within a larger flat correction.
Minor wave 2 was a combination. To exhibit some alternation minor wave 4 may be a more shallow flat or triangle. Within a flat correction, the B wave of minute wave b may make a new price extreme beyond the start of minute wave a above 15.786. An expanded flat would see minute wave b end at 15.816 or above, so that it is 1.05 or longer than minute wave a.
A new high for Silver would fit this wave count.
Minor wave 4 may find support at the Elliott channel drawn about this upwards impulse.
Minor wave 4 may not move into minor wave 1 price territory below 14.300.
TECHNICAL ANALYSIS
DAILY CHART
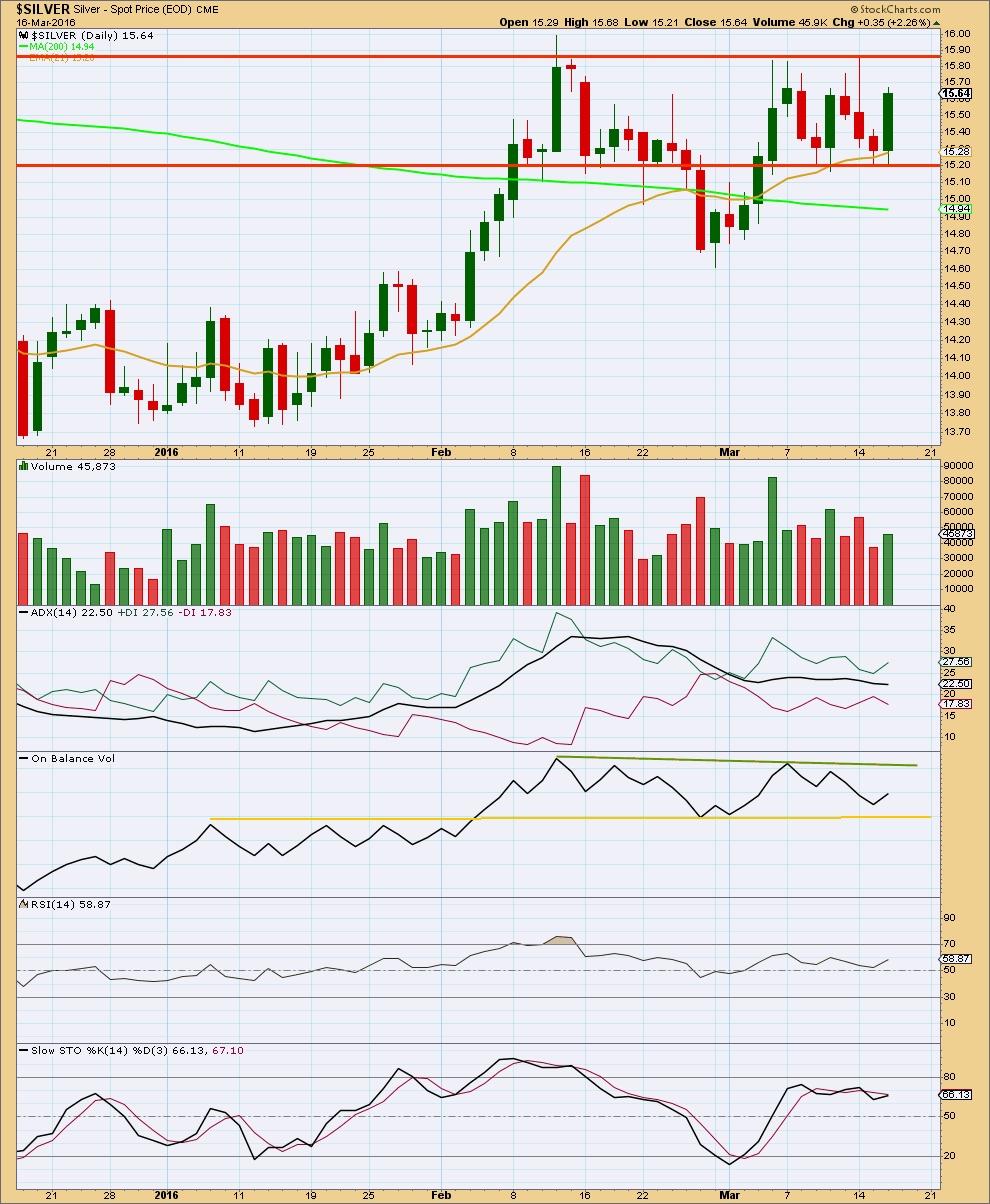
Click chart to enlarge. Chart courtesy of StockCharts.com.
Overall, volume declines as price moves sideways. Price is range bound below about 15.80 and above about 15.15. During the range bound movement of the last eight days, it is an upwards day which has strongest volume. This suggests that the breakout is more likely to be upwards than downwards, but for Silver this indication is not reliable and it is a weak signal.
ADX is flat indicating the market is not trending. The +DX line remains below the -DX line, so there has been no trend change.
On Balance Volume remains bound within the green and yellow trend lines. A break above the green line would be a bullish signal. A break below the yellow line would be a bearish signal.
RSI and Stochastics are not yet overbought. There is room for upwards movement in price. There is also room for downwards movement.
The bottom line for this regular technical analysis is we need to wait for price to break above or below the current zone delineated by the red horizontal lines. A breakout on a day with increased volume would signal the next trend direction for Silver.
This analysis is published @ 04:39 a.m. EST on 17th March, 2016.
Lara, it is always a joy to review your analysis. Really well expressed, presented, and charted. I really don’t know how the competition gets away with such inferior service. They are a risk to their clients. Thanks for everything you do Lara. I know you go above and beyond in the many ways you provide service.
Thank you very much Richard, you are very kind.