
Last week’s analysis of US Oil expected more upwards movement for the week to come up to touch the upper edge of a channel.
This is what happened.
Summary: The monthly chart remains clear: US Oil needs to move lower to complete a large zigzag structure at Super Cycle degree. In the short term, one final high to touch the maroon trend line may be required to complete this bear market rally. If the lilac line is breached by a full daily candlestick below and not touching it first though, then expect US Oil has made a trend change and the downwards trend should resume. This would be fully confirmed by price below 31.51.
New updates to this analysis are in bold.
MONTHLY ELLIOTT WAVE COUNT
Click chart to enlarge.
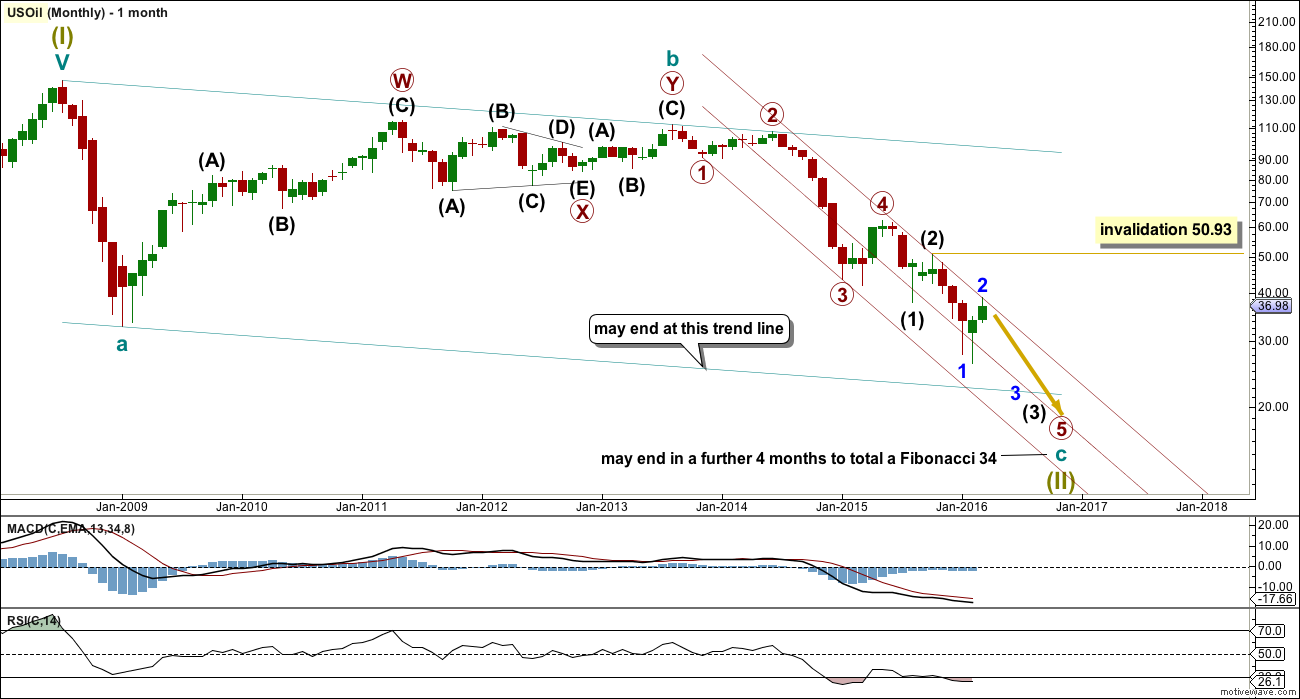
US Oil has been in a bear market since August 2013. While price remains below the upper edge of the maroon channel drawn here and below the 200 day simple moving average it must be accepted that the bear market most likely remains intact.
The structure of cycle wave c is incomplete.
This wave count sees US Oil as within a big super cycle wave (II) zigzag. Cycle wave c has moved below cycle wave a at 32.70 avoiding a truncation. At this stage, as soon as the structure for cycle c could be seen as complete an alternate wave count expecting an end to the Oil bear market would be published.
I am aware that Jeffrey Kennedy at Elliott Wave International has a wave count which calls for a new bull market in Oil. Only if the upper edge of the maroon channel is breached, will I publish a bullish wave count. For now, while price remains within the channel and below the 200 day moving average, a bullish wave count will not be published because it would be trying to pick a low.
Within cycle wave c, primary wave 5 is expected to be extended which is common for commodities.
No second wave correction may move beyond the start of its first wave above 50.93 within intermediate wave (3).
Draw a channel about this unfolding impulse downwards. Draw the first trend line from the lows labelled primary waves 1 to 3, then place a parallel copy up not the high labelled intermediate wave (2), so that all movement is contained. Add a mid line. Copy the channel over to the daily chart.
The wider teal green channel is drawn about this whole correction. Cycle wave c may end when price finds support at the lower edge of this channel. But sometimes these channels are breached by C waves, particularly if the C wave has a swift strong extended fifth wave to end it. How price behaves when it gets to the lower teal trend line, and how complete the structure is at that stage, will indicate if price may stop there or if it would continue.
DAILY ELLIOTT WAVE COUNT
Click chart to enlarge.
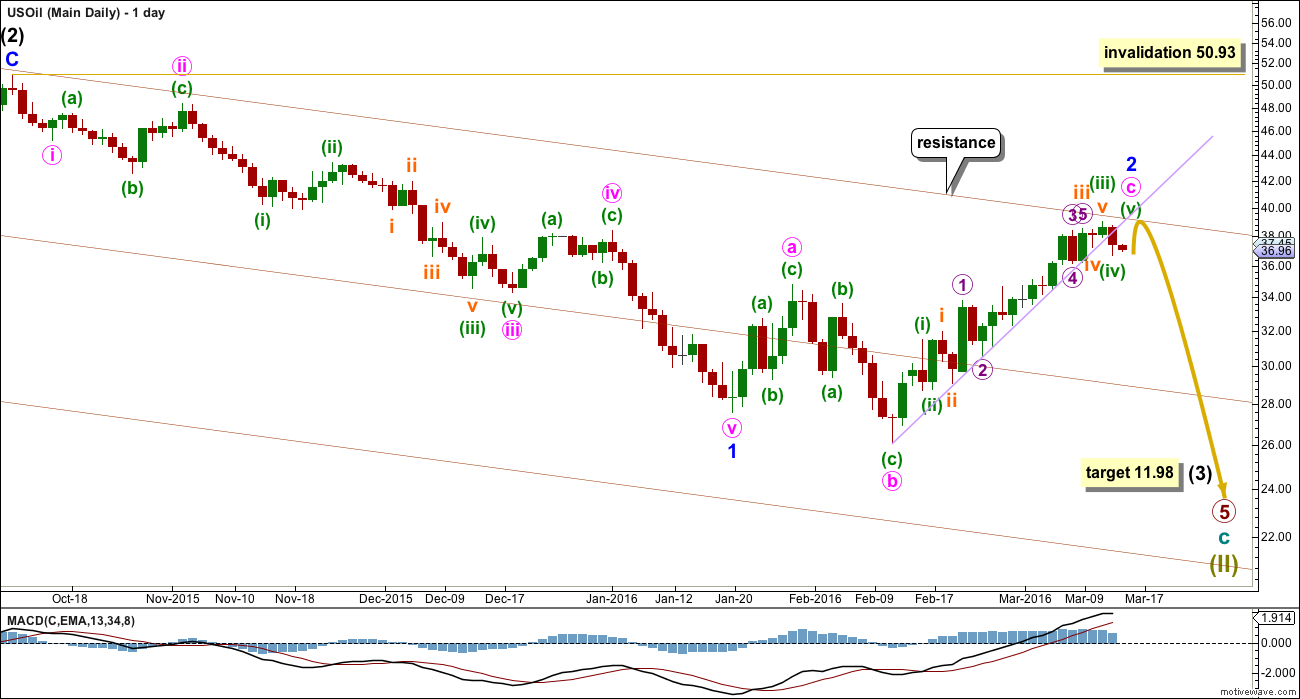
Intermediate wave (3) should exhibit stronger momentum than intermediate wave (1). So far it has not. If only minor wave 1 is complete, then the lack of an increase in momentum makes sense.
This wave count would expect primary wave 5 to be extended. This is typical for commodities, so this wave count follows most common tendencies. It should have a higher probability for that reason.
Within primary wave 5, this wave count expects that intermediate wave (3) will be extended. Intermediate wave (5) may or may not be extended.
Within intermediate wave (3), so far minor wave 1 may be complete as an impulse lasting 72 days (no Fibonacci number). Within minor wave 1, there is perfect alternation between the deep expanded flat of minute wave ii and the shallow zigzag of minute wave iv. Minute wave v is the strongest wave, typical of commodities.
Minor wave 2 may be either complete or an almost complete expanded flat. It is just possible to see minuette wave (iii) as complete at lower time frames. Minuette wave (v) may end slightly above the end of minuette wave (iii) to avoid a truncation. It may come up to exactly touch the maroon trend line.
Along the way up, for minute wave c, price has been finding support at the lilac trend line. This line is now overshot. If that line is properly breached by a full daily candlestick below and not touching it, then minute wave c may be incorrectly labelled and may be over.
An overshoot of the maroon trend line is acceptable but a proper breach is not. If a full daily candlestick prints above the maroon line and not touching it, then a bullish wave count will be published.
31.51 is the high of minuette wave (i) within minute wave c. A new low below 31.51 could not be a fourth wave correction within minute wave c. At that stage, minute wave c would have to be over. A new low below 31.51 by any amount at any time frame would indicate the next wave down for US Oil should be in the earliest stage.
When minor wave 2 is complete, then this wave count expect US Oil to move very strongly lower. Minor wave 3 within intermediate wave (3) within primary wave 5 should be the strongest part of downwards movement within the bear market for US Oil.
At 11.98 intermediate wave (3) would reach 1.618 the length of intermediate wave (1).
TECHNICAL ANALYSIS
DAILY CHART
Click chart to enlarge. Chart courtesy of StockCharts.com.
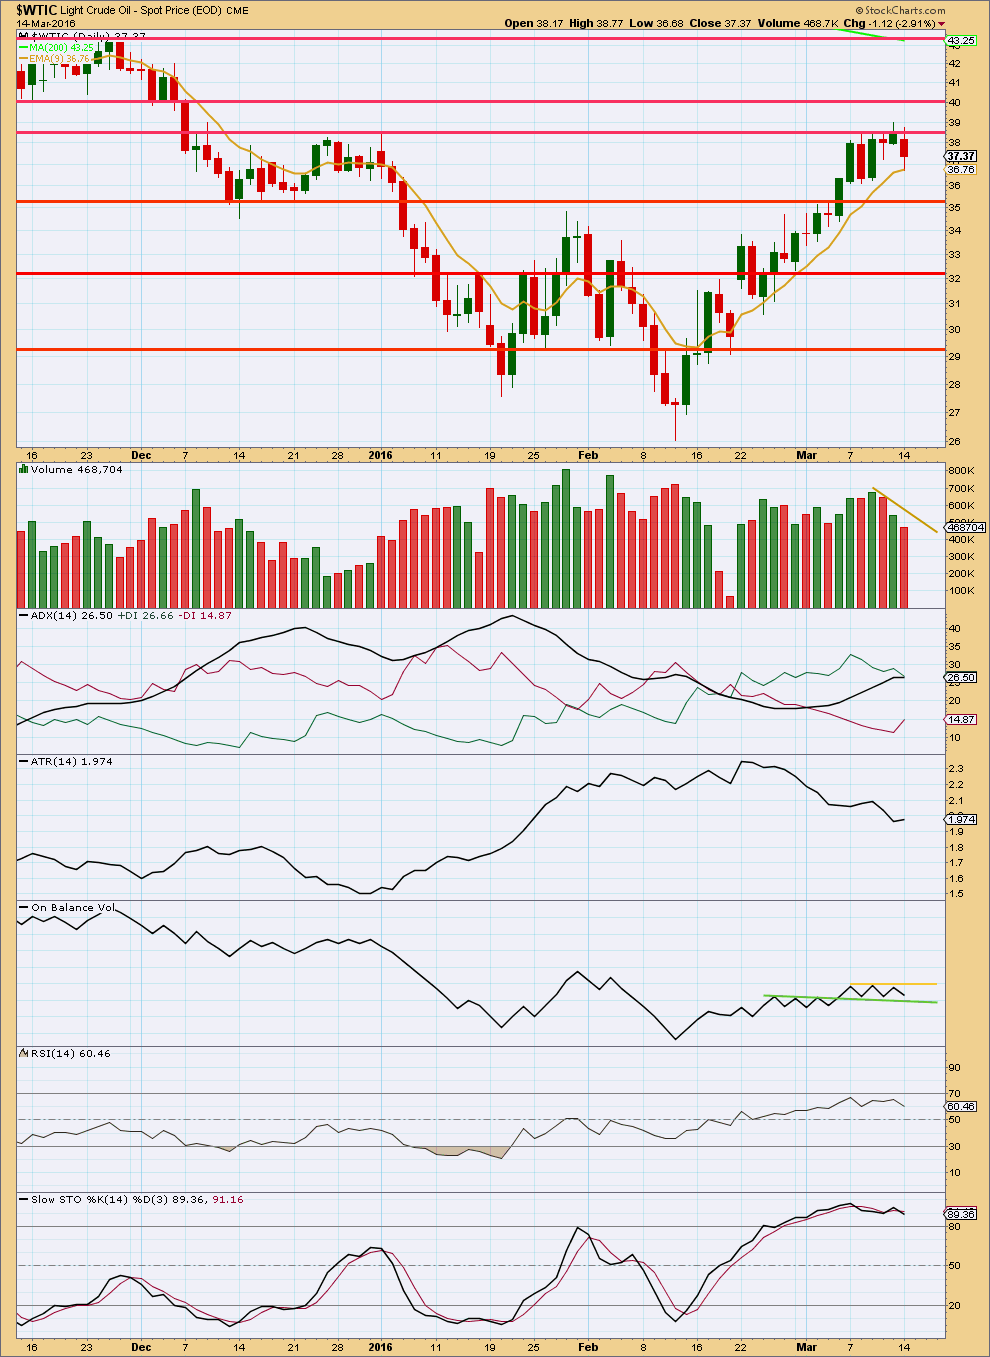
Price has found resistance about the horizontal line about 38.50, and is so far finding support about the 9 day exponential moving average.
Volume for the last high on 11th March came with reasonably low volume. The rise in price was not supported by volume, so is suspicious. It looks like this upwards movement is weak. There was also slight divergence with the high of 11th March and RSI. RSI did not make a new high while price made a new high. This indicates weakness in upwards movement.
ADX is overall still increasing, although it looks like today it may be beginning to flatten off. If this continues, then the market will no longer be indicating a trend. The trend is still most likely intact for now and it is up.
ATR is overall declining. If this upwards movement is the start of a new bull market for US Oil, then ATR should not be declining and should be increasing or at the very least flat. This supports the idea that the upwards movement in price is a bear market rally and not the start of a new bull market.
RSI has not yet reached overbought. Stochastics has reached overbought, so the rally should end here or soon.
Watch the two close trend lines on On Balance Volume over the next few days. A break out of this small zone may precede a movement in price and may indicate the direction for price to break out. A break above the yellow line would indicate upwards movement for price. A break below the green line would indicate downwards movement by price. OBV has been sideways while price has been moving higher. This indicates further weakness in price.
This analysis is published @ 01:43 a.m. EST on 15th March, 2016.
its in the channel 36.88 to 43.58 for 2 months then it will test the 26.05 low twice with a hump in the middle of 34.82. what do you think Lara? Is there any chance of this happening?
Of course, there is a chance of that happening.
Top may be in? No confirmation though.
Also, on Stockcharts, reversal at 200MA on high volume
target $43.33 would be double the distance from the right bottom to the top of the hump x 2, maybe
Daily chart
And Stockcharts has already rolled to the May futures, showing the close at 41.67
*RSI is just entering overbought
*Volume is increasing, but still very low for the last 3 days
*ADX is showing a strong upwards trend
As Lara stated below, Oil is at a critical crossroad and April futures will roll to May on Monday after the close, although some sites may rollover sooner as we saw last month. With May futures +1.46 versus April, unless Oil sells off in the next two days, it will gap over the resistance line and move higher, which will necessitate an EW count revision.
A possible top HnS in 4 hour period for US oil.
LS at 37.80 and RS at 37.80 now trading at.
Neckline Ax 36.18,
Oil is at a critical juncture.
A little patience, waiting to see what it does next, should be rewarded.
I do not think this is a good time to enter short or long. I’m waiting on the sidelines.
Lara: ” If that line is properly breached by a full daily candlestick below and not touching it, then minute wave c may be incorrectly labelled and may be over. ”
As of close today Mar 15 oil close below lilac line and not touching. Throw back is too high. Thus minute wave c may be over.
And yet we have a new high.
Price had two candlesticks below the lilac line, now a third is underway.
Price is slightly overshooting the maroon line.
This may be the corrective structure for minor 2 over here. Or something else may be happening.
I want to see Oil move away from that maroon line. It should hold if the bear count remains valid.
I’ll be waiting and watching for another day or two at least before I have confidence in what Oil is up to right now.
Oh I have lost ton of money waiting for that last wave that never comes. Not this time. Keeping short, despite a last move up which is expected based on this count.
There is no guarante that a wave count will be completed, and after the fact it always comes an alternative count that no one saw before.
I gues once you get close to critical level you should act, even if the wave count is not complete. Close to complete is good enough.
Elliott Wave has its virtudes but also its limitations. Understanding them is the key. Specially the limitation part.
Cheers
EW analysis, done correctly the way Lara does it, understands that we often don’t know exactly where we are in the development of wave structures. Thus the need for alternate wave counts.
But once in a while the fog lifts, clarity shines brightly for a brief moment, and the thoughtful analyst can forecast with a high degree of confidence what almost certainly must happen next.
Since 29th Feb the main daily count has been expecting upwards movement. At that stage the target was 37.81 when price was back below 34.
So I’m not quite sure what the problem here is.
Price is going up as expected. It kept finding support at the lilac line. Today we have what looks like possibly the final move up to a throwback of the lilac line.
A rational trading approach would be to either step aside and wait (because this is still a counter trend rally until proven otherwise), or to have a short term long position entering each time price touched support. Which I pointed out.
Any short term longs may be exited now or set with a trailing stop in case I’m wrong and price keeps going up.
At this stage a rational trading approach would be to step aside and wait for some confirmation of a trend change back to down. Then find an entry.
Yes, the wave count changed after 15th February when price invalidated the old count above 33.60.
Since price moved above 34.82 the Elliott wave count has become clearer for the short term.
If you’re still holding shorts through a whole month when the wave count changes that much then I cannot help you.
And if you expect me to never make a mistake, the market to never throw us a curve ball, and me to always have the one correct wave count, then I cannot help you. It is impossible.
Analysis and trading is an exercise in probability. We need to be flexible and change our approach as the market changes. Within that we also asolutely need to manage risk, it is the single most important aspect to trading profitably. Which means not holding onto losing positions if our analysis indicates we were wrong.
I can understand criticism when I get it wrong. But the last two weeks price is behaving exactly as expected, so I’m bemused as to why you have a problem with that.
Perhaps this analysis service is not suited for you.
Not from a month ago. I enter short two days ago at 37. Before I was long from 32 to 37.
I was kind of kicking myself for not selling at 39.
But never mind.
Good analysis.
Trying to pick a high does not often end well.
Waiting for confirmation is a wise idea. That’s why I provide confirmation lines and price points.