
A new Elliott wave count resolves the problems with last week’s analysis of US Oil.
Summary: The monthly chart remains clear: US Oil needs to move lower to complete a large zigzag structure at Super Cycle degree. In the short term, the new wave count expects another second wave correction is unfolding upwards, which would be confirmed with a new high above 37.75.
New updates to this analysis are in bold.
MONTHLY ELLIOTT WAVE COUNT
Click chart to enlarge.
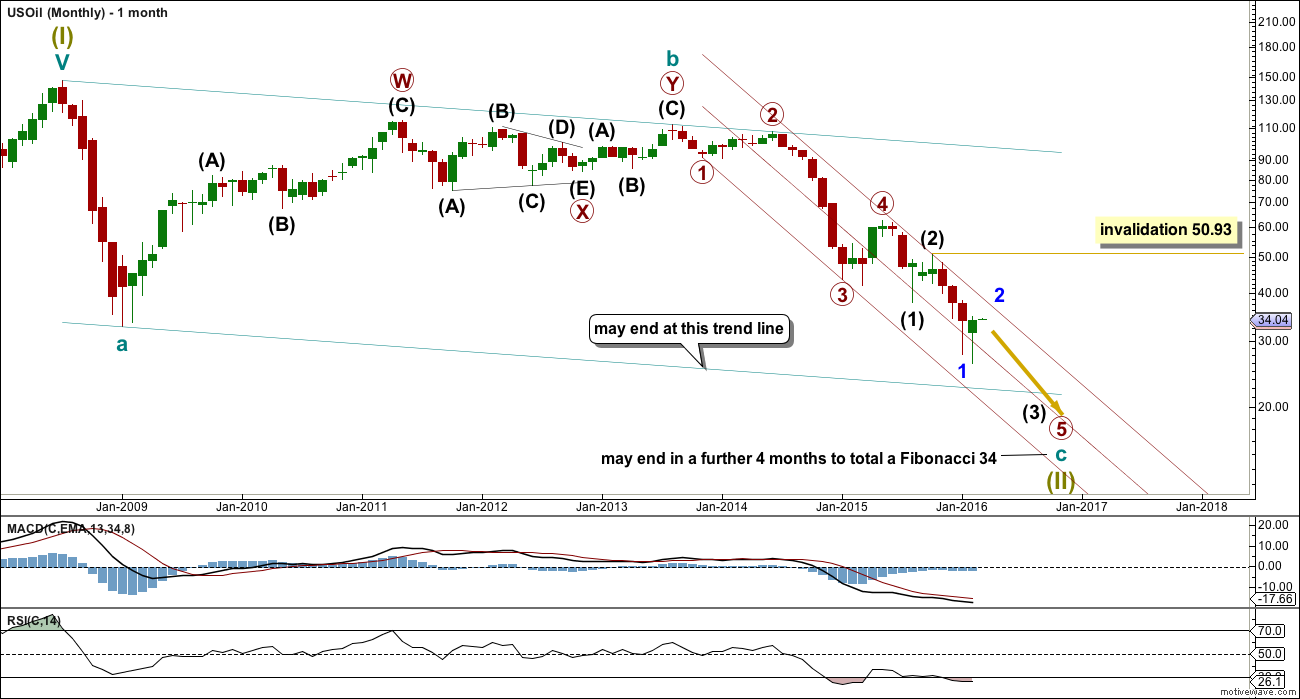
US Oil has been in a bear market since August 2013. While price remains below the upper edge of the maroon channel drawn here and below the 200 day simple moving average it must be accepted that the bear market most likely remains intact.
The structure of cycle wave c is incomplete.
This wave count sees US Oil as within a big super cycle wave (II) zigzag. Cycle wave c has moved below cycle wave a at 32.70 avoiding a truncation. At this stage, as soon as the structure for cycle c could be seen as complete an alternate wave count expecting an end to the Oil bear market would be published. That cannot be done yet because the structure is incomplete. Primary wave 5 has to unfold lower and must complete as a five wave structure. Within primary wave 5, intermediate waves (4) and (5) should show up clearly on the monthly chart.
When the structure is complete and an alternate bull wave count is published, then it would come with the strong caveat that it is an alternate until there is technical confirmation of a trend change. That confirmation would be a breach of the maroon channel or a break above the 200 day moving average, or both.
Within cycle wave c, primary wave 5 is expected to be extended which is common for commodities.
No second wave correction may move beyond the start of its first wave above 50.93 within intermediate wave (3).
Draw a channel about this unfolding impulse downwards. Draw the first trend line from the lows labelled primary waves 1 to 3, then place a parallel copy up not the high labelled intermediate wave (2), so that all movement is contained. Add a mid line. Copy the channel over to the daily chart.
The wider teal green channel is drawn about this whole correction. Cycle wave c may end when price finds support at the lower edge of this channel. But sometimes these channels are breached by C waves, particularly if the C wave has a swift strong extended fifth wave to end it. How price behaves when it gets to the lower teal trend line, and how complete the structure is at that stage, will indicate if price may stop there or if it would continue.
MAIN DAILY ELLIOTT WAVE COUNT
Click chart to enlarge.
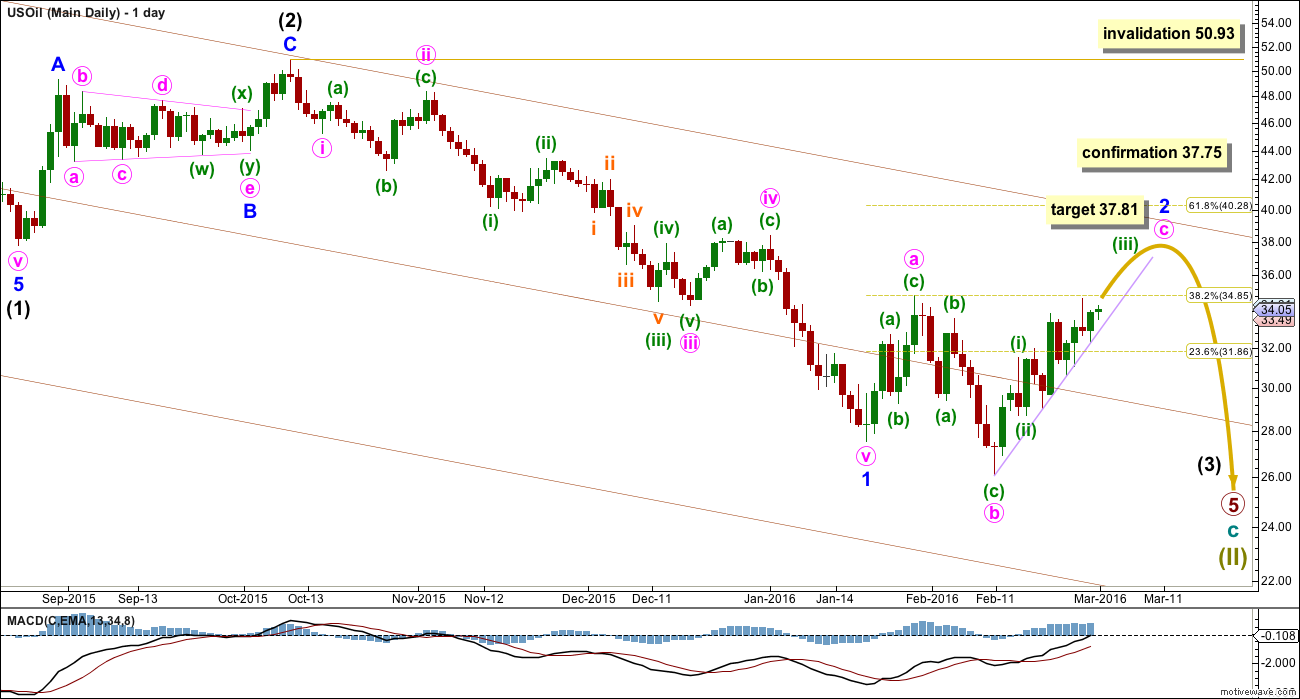
This new wave count resolves the problems last week’s analysis had with momentum and proportion.
Intermediate wave (3) should exhibit stronger momentum than intermediate wave (1). So far it has not. If only minor wave 1 is complete, then the lack of an increase in momentum makes sense.
This wave count would expect primary wave 5 to be extended. This is typical for commodities, so this wave count follows most common tendencies. It should have a higher probability for that reason.
Within primary wave 5, this wave count expects that intermediate wave (3) will be extended. Intermediate wave (5) may or may not be extended.
Within intermediate wave (3), so far minor wave 1 may be complete as an impulse lasting 72 days (no Fibonacci number). Within minor wave 1, there is perfect alternation between the deep expanded flat of minute wave ii and the shallow zigzag of minute wave iv. Minute wave v is the strongest wave, typical of commodities.
Ratios within minor wave 1 are: minute wave iii is 0.82 short of 2.618 the length of minute wave i, and minute wave v has no Fibonacci ratio to minute waves i or iii.
Minor wave 2 may be unfolding as an expanded flat correction. Within minor wave 2, minute wave b is a 1.21 length of minute wave a, within the common range of 1 to 1.38. At 37.81 minute wave c would reach 1.618 the length of minute wave a.
Minor wave 2 should find resistance at the upper edge of the maroon channel which is copied over here from the monthly chart.
Within minute wave c, so far there is too much overlapping for minuette wave (iii) to be complete. This expects that upwards movement will continue so that the structure of minuette wave (iii) can be resolved as an impulse. So far corrections along the way up are finding support at the lilac trend line, which is likely to continue.
Minute wave c is extremely likely to make at least a slight new high above the end of minute wave a at 34.82 to avoid a truncation and a very rare running flat. Price needs to continue higher for this wave count in the short / mid term for the structure of minute wave c to resolve.
When minor wave 2 is complete, then this wave count expect US Oil to move very strongly lower. Minor wave 3 within intermediate wave (3) within primary wave 5 should be the strongest part of downwards movement within the bear market for US Oil.
ALTERNATE DAILY ELLIOTT WAVE COUNT
Click chart to enlarge.
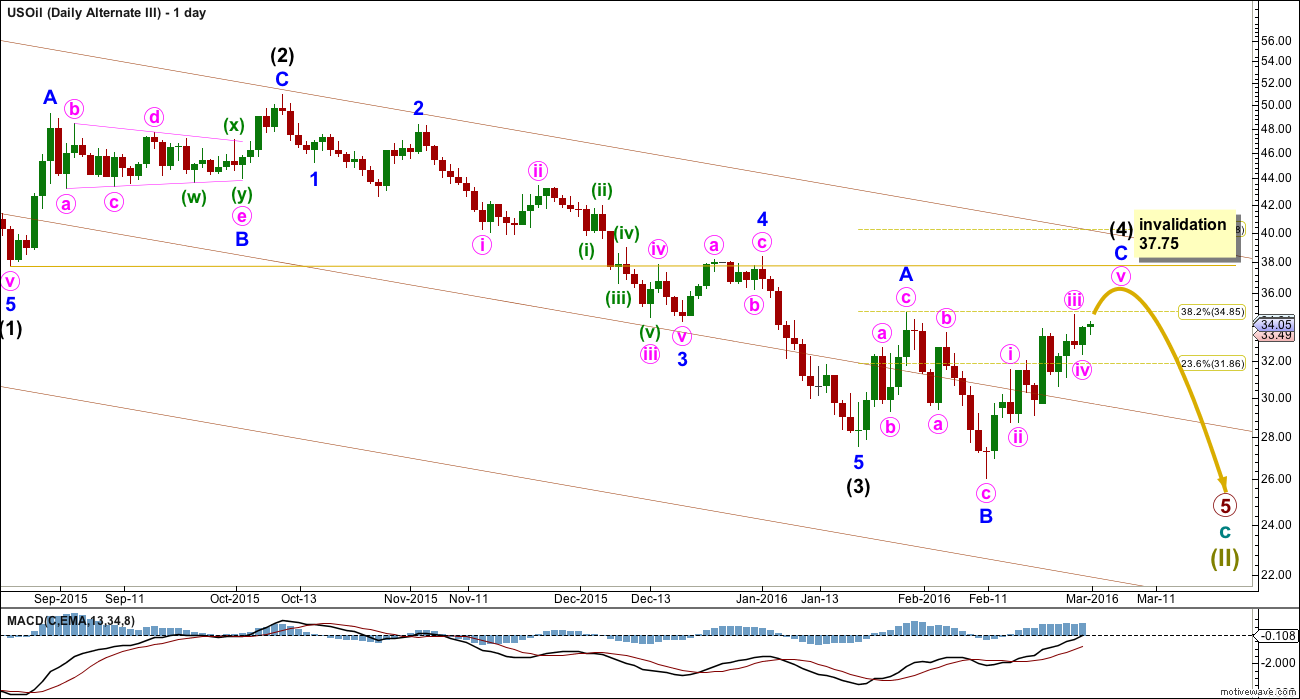
Last week had three alternate wave counts at the daily chart level. This week I will publish only one, because the others all suffer from too many serious problems for consideration at this stage.
This alternate wave count expects that intermediate wave (3) is complete as an impulse and upwards movement is intermediate wave (4) as an expanded flat.
Intermediate wave (3) shows weaker momentum than intermediate wave (1). This could be acceptable, but only if intermediate wave (5) shows weaker momentum than intermediate wave (3). Although this is a guide to the wave structure and is not an Elliott wave rule, a third wave should not only not be the shortest but should also not be the weakest.
Intermediate wave (2) was a relatively deep 0.55 zigzag. Intermediate wave (4) may be exhibiting alternation as a relatively shallow expanded flat correction.
Intermediate wave (2) lasted exactly a Fibonacci 34 days. Intermediate wave (4) so far is in reasonable proportion; so far it has lasted 29 days and the structure is incomplete.
Intermediate wave (4) may not move into intermediate wave (1) price territory above 37.75.
The biggest problem with this wave count (apart from momentum) is the structure within minor wave C. I have labelled minute wave iii as complete. But this structure should be an impulse. It can be forced on the hourly chart to fit as an impulse, but the proportions of the second and fourth wave corrections within it are too great for a good fit. There is not enough room left for upwards movement within minor wave C for the structure to resolve and not be invalidated.
This wave count has a low probability.
TECHNICAL ANALYSIS
DAILY CHART
Click chart to enlarge. Chart courtesy of StockCharts.com.
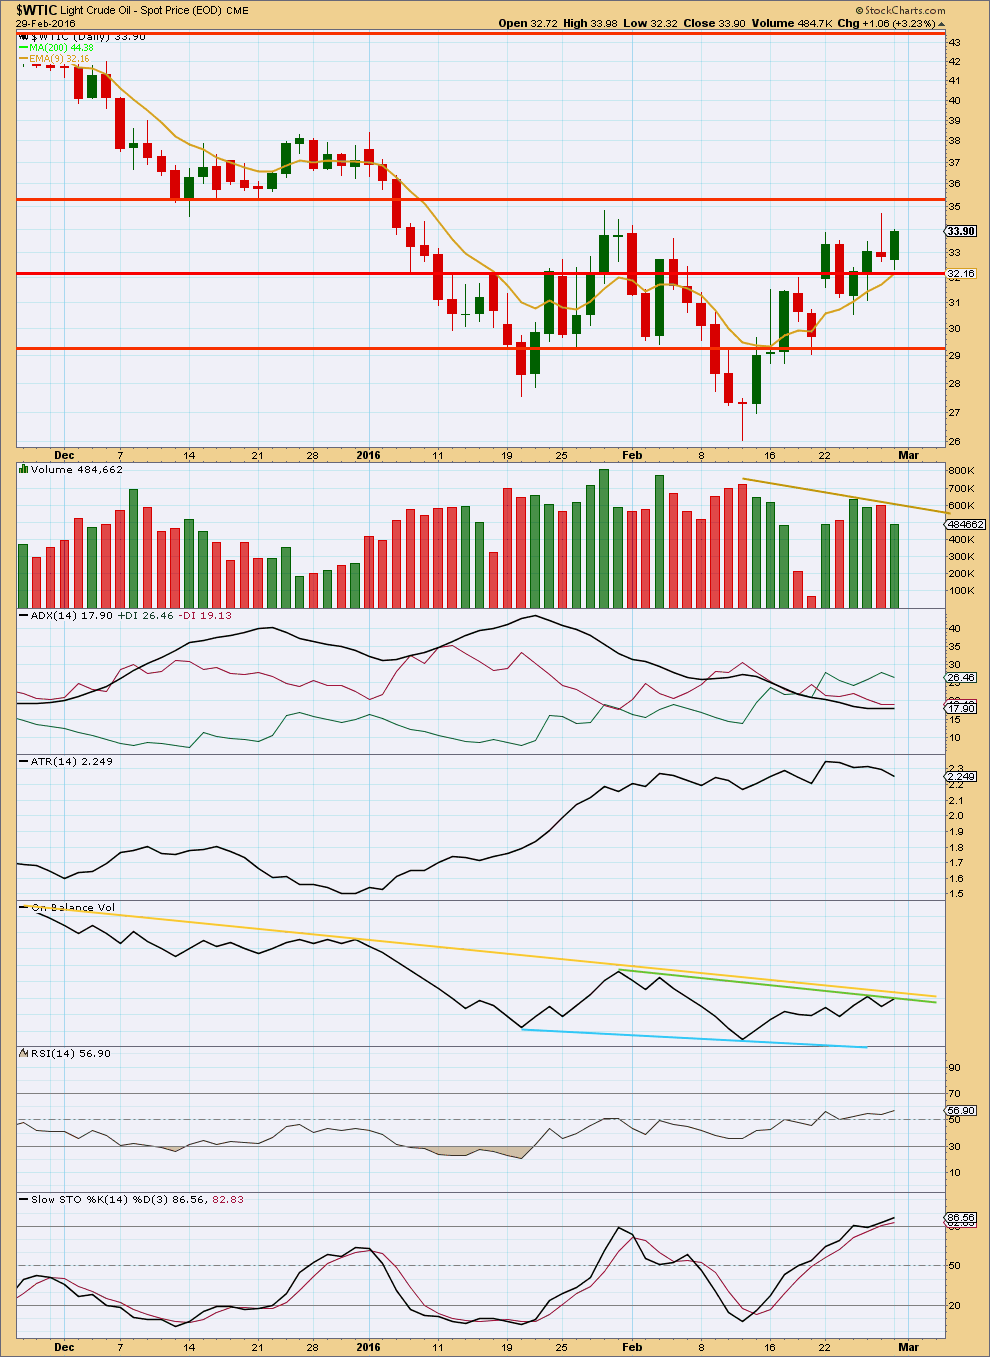
The breakout last week of the lower consolidation zone has resolved into another consolidation, slightly higher. Price is now finding support about 32; the next line of resistance is about 35.40.
Overall, volume continues to move lower as price consolidates. Importantly, the rise in price for 24th and 25th February did not come with an increase in volume, so movement for the last week looks more like a consolidation than a new trend.
ADX is flat indicating the market is consolidating. ATR is declining, so it agrees.
It should be expected that price may swing from resistance to support and back again. Stochastics may be used with support and resistance lines for price. At this stage, price is close to resistance about 35.40 and Stochastics is just moving into overbought. A little more upwards movement from price would be expected from this range bound approach, to end only when price finds resistance and Stochastics is clearly overbought.
A break above the yellow and green trend lines from On Balance Volume would be bullish.
This analysis is published @ 02:46 a.m. EST on 1st March, 2016.
ALTERNATE DAILY ELLIOTT WAVE COUNT Invalidate?
Lara have you consider doing an analysis on cooper. Cooper is booming, looks like it has lots of pontential. Making a killing on Cooper stocks like FCX, also Oil stocks like UWTI?
No. I haven’t considered it.
I’ll look to see if I have COMEX data for copper.
Lara, any validity to this count? What about the triangle from Jan 2016 to Feb, will that possible fit into your count?
That is not a valid wave count. It breaches rules in Frost and Prechter:
It has a first wave subdividing as a three, but it’s not a first wave in a diagonal.
It has a third wave which is not an impulse (and it’s not a third wave within a diagonal, the only structure where a third wave may be anything other than an impulse).
The whole move down is labelled as some kind of B wave down… which makes no sense given the larger picture…
Do not follow this persons work. That is not Elliott wave.
And that possible triangle?
Technically you could see a triangle there. But it looks forced, it looks wrong.
I just can’t look at that chart anymore. It really is nonsensical.
Minute c (main wave count) has now made a new high above minute a.
It could end here, but I still see too much overlapping. I expect it needs to go higher to resolve the structure of minute c. It has to be a five, and this five is an impulse not a diagonal. So within the impulse the third wave has to unfold, and then the fourth wave corrections must remain above first wave price territories.
So the overlapping has to be interrupted by a stretched out middle, and then more overlapping to finish it as the fourth waves unfold.
So far price keeps finding support at the lilac line. That should hold while upwards movement continues.
If that line is breached then minute wave c may be over. A breach would need to be at least one full daily candlestick below the line and not touching it. Although, a strong overshoot would be an early strong warning.
The target remains the same. If price gets up that high look for resistance at the upper edge of the maroon channel. Draw that on monthly and daily charts on a semi-log scale (not arithmetic).
Hi Lara, thank you very much for this highly valuable update.
Looks like the main wave count is unfolding
Thanks
Lara: Main wave count minute wave c is trading at 34.45 which is below minute wave a (34.85). What does this indicate for wave count?????
It means minute wave c isn’t done.
US Oil moved higher than 34.82 to 35.08 and now at 34.75.
Lara:”Minute wave c is extremely likely to make at least a slight new high above the end of minute wave a at 34.82 to avoid a truncation and a very rare running flat.”
If oil closes below 32 (wave i) is that mean wave 2 complete????
Another reversal candle doji at high. Now to break the lilac trend line price has narrowed to 33.00 and below.
I do not expect oil price to go too much below 28.
US oil may consolidate here for months till the monthly 9 ema is close to the current price on a monthly basis.
Adityaji reminded me too look at the monthly.
very time oil price has dropped to far below monthly 9ema price has consolidated for months and then resumed the drop.
Attached chart tracks monthly 9ema and oil prices.
Once oil crosses 32.75 look for support at 30.
Oh right, finally a wave count I agree with. Although I expect it to reach the 40 dollar price target or higher.
Cheers
It could get up to the 0.618 Fibonacci ratio at 40.28. My only problem with that (and why I didn’t use it as a target) is that would require the long term maroon channel to be breached or overshot.
US oil at critical support and resistance line. Also price point to break down below lilac line is now narrowed to below 33.87. Friday wad a reversal candle on daily.
A second back test of breakout at 34.60.
Once oil breaks below lilac line at 33.87 (expected by Lara) oil should move down.
Thanks for Update
Monthly oil has doji candlestick pattern.
From monthly chart perspective you are correct it is a reversal candle ; doji.
Price has moved far low from 9ema on monthly basis. Oil needs to consolidate side ways for 9ema to catch up with current price.
9ema has provided resistance in the past. on monthly chart. So for many months oil will be in consolidation till monthly 9ema comes close to the current price.