
Last week’s analysis of US Oil expected upwards movement for the week, which is what happened.
A new high above 37.75 invalidated the alternate and confirmed the main Elliott wave count.
Summary: The monthly chart remains clear: US Oil needs to move lower to complete a large zigzag structure at Super Cycle degree. In the short term, more upwards movement is required to complete the structure of this correction. Look for price to find resistance at the upper edge of the big maroon channel.
New updates to this analysis are in bold.
MONTHLY ELLIOTT WAVE COUNT
Click chart to enlarge.
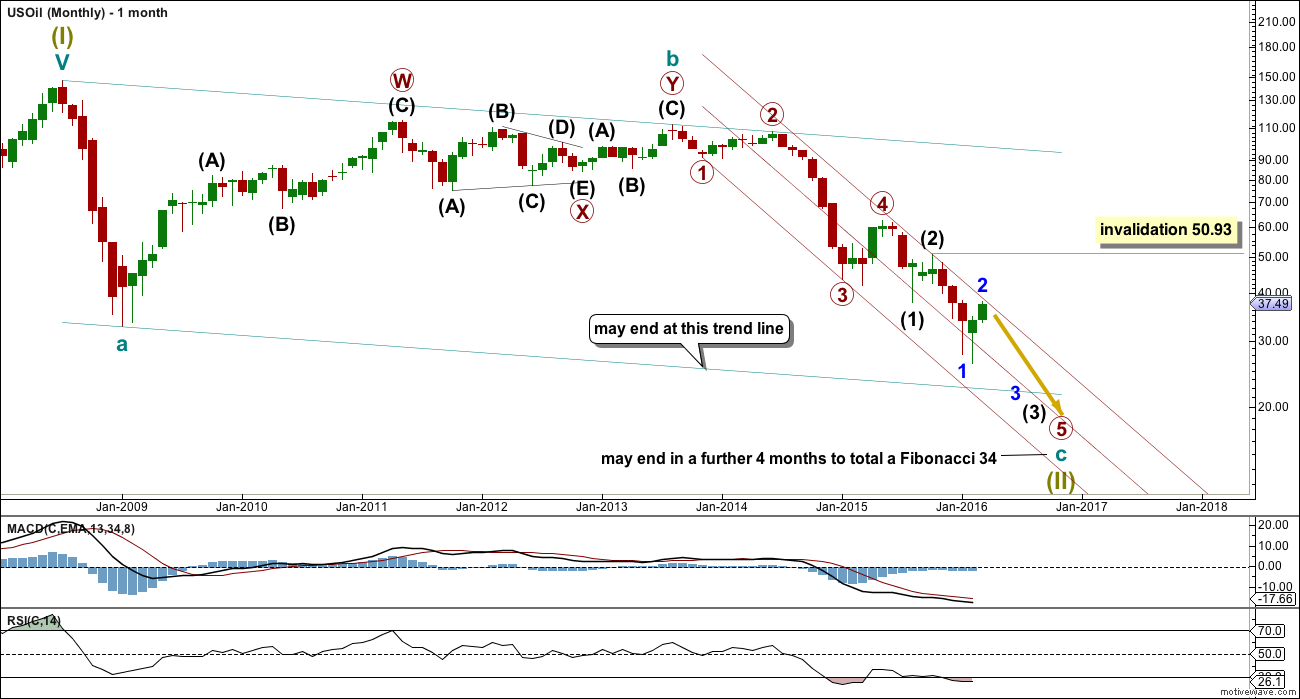
US Oil has been in a bear market since August 2013. While price remains below the upper edge of the maroon channel drawn here and below the 200 day simple moving average it must be accepted that the bear market most likely remains intact.
The structure of cycle wave c is incomplete.
This wave count sees US Oil as within a big super cycle wave (II) zigzag. Cycle wave c has moved below cycle wave a at 32.70 avoiding a truncation. At this stage, as soon as the structure for cycle c could be seen as complete an alternate wave count expecting an end to the Oil bear market would be published. That cannot be done yet because the structure is incomplete. Primary wave 5 has to unfold lower and must complete as a five wave structure. Within primary wave 5, intermediate waves (4) and (5) should show up clearly on the monthly chart.
When the structure is complete and an alternate bull wave count is published, then it would come with the strong caveat that it is an alternate until there is technical confirmation of a trend change. That confirmation would be a breach of the maroon channel or a break above the 200 day moving average, or both.
Within cycle wave c, primary wave 5 is expected to be extended which is common for commodities.
No second wave correction may move beyond the start of its first wave above 50.93 within intermediate wave (3).
Draw a channel about this unfolding impulse downwards. Draw the first trend line from the lows labelled primary waves 1 to 3, then place a parallel copy up not the high labelled intermediate wave (2), so that all movement is contained. Add a mid line. Copy the channel over to the daily chart.
The wider teal green channel is drawn about this whole correction. Cycle wave c may end when price finds support at the lower edge of this channel. But sometimes these channels are breached by C waves, particularly if the C wave has a swift strong extended fifth wave to end it. How price behaves when it gets to the lower teal trend line, and how complete the structure is at that stage, will indicate if price may stop there or if it would continue.
DAILY ELLIOTT WAVE COUNT
Click chart to enlarge.
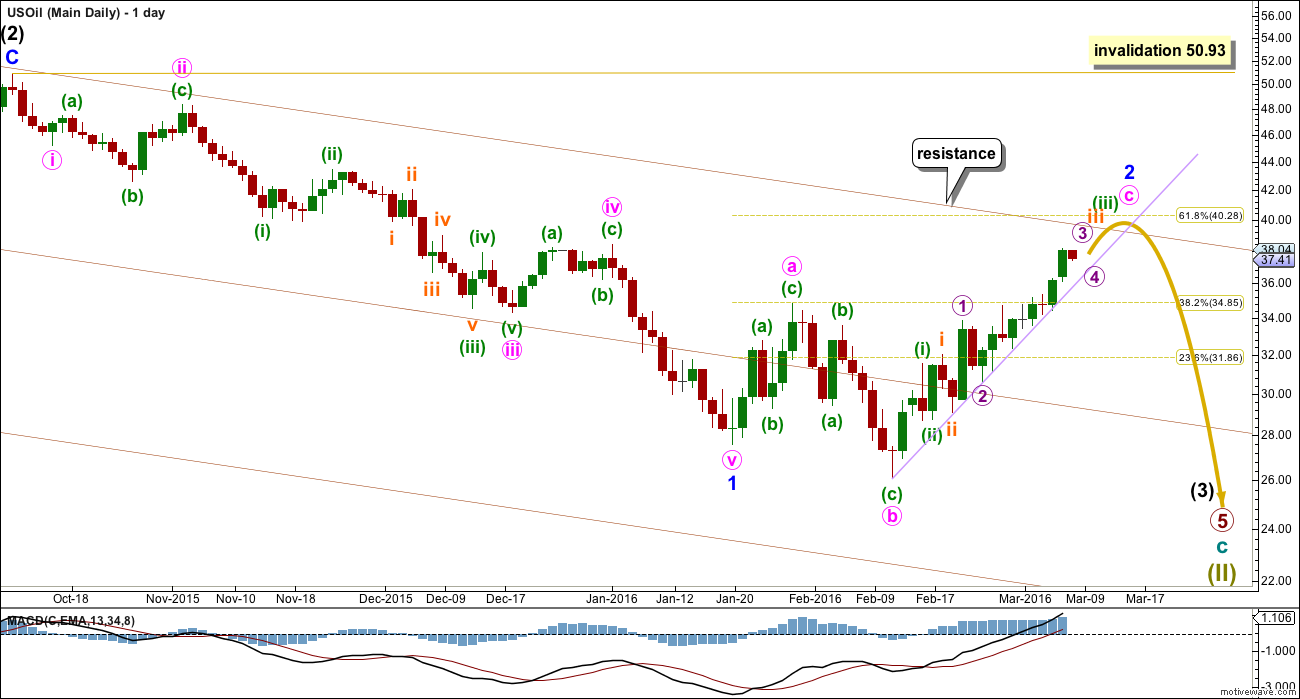
Intermediate wave (3) should exhibit stronger momentum than intermediate wave (1). So far it has not. If only minor wave 1 is complete, then the lack of an increase in momentum makes sense.
This wave count would expect primary wave 5 to be extended. This is typical for commodities, so this wave count follows most common tendencies. It should have a higher probability for that reason.
Within primary wave 5, this wave count expects that intermediate wave (3) will be extended. Intermediate wave (5) may or may not be extended.
Within intermediate wave (3), so far minor wave 1 may be complete as an impulse lasting 72 days (no Fibonacci number). Within minor wave 1, there is perfect alternation between the deep expanded flat of minute wave ii and the shallow zigzag of minute wave iv. Minute wave v is the strongest wave, typical of commodities.
Ratios within minor wave 1 are: minute wave iii is 0.82 short of 2.618 the length of minute wave i, and minute wave v has no Fibonacci ratio to minute waves i or iii.
Minor wave 2 may be unfolding as an expanded flat correction. Within minor wave 2, minute wave b is a 1.21 length of minute wave a, within the common range of 1 to 1.38. Minute wave c has passed 1.618 the length of minute wave a and the structure is incomplete. The target was inadequate. The next Fibonacci ratio in the sequence at 2.618 would see minute wave c end about 45, but this target looks too high because it would require a substantial breach of the maroon channel. That channel should provide very strong resistance.
Use the maroon channel. When price comes up to touch it, then the correction may be over. This may see minor wave 2 end close to the 0.618 Fibonacci ratio at 40.28. If it reaches that target, then the maroon channel may be overshot. An overshoot is acceptable, but a full breach is not.
Minor wave 2 should find resistance at the upper edge of the maroon channel which is copied over here from the monthly chart.
Within minute wave c, so far there is still too much overlapping for minuette wave (iii) to be complete. This expects that upwards movement will continue so that the structure of minuette wave (iii) can be resolved as an impulse.
Within minute wave c, the middle of the third wave of micro wave 3 cannot yet be seen as complete at the hourly chart level. There is still too much overlapping. At this stage, it looks like this is being resolved with upwards movement and shallow corrections.
So far corrections along the way up are finding support at the lilac trend line, which is likely to continue.
Minute wave c has made a slight new high above the end of minute wave a at 34.82, avoiding a truncation and a very rare running flat.
When minor wave 2 is complete, then this wave count expect US Oil to move very strongly lower. Minor wave 3 within intermediate wave (3) within primary wave 5 should be the strongest part of downwards movement within the bear market for US Oil.
TECHNICAL ANALYSIS
DAILY CHART
Click chart to enlarge. Chart courtesy of StockCharts.com.
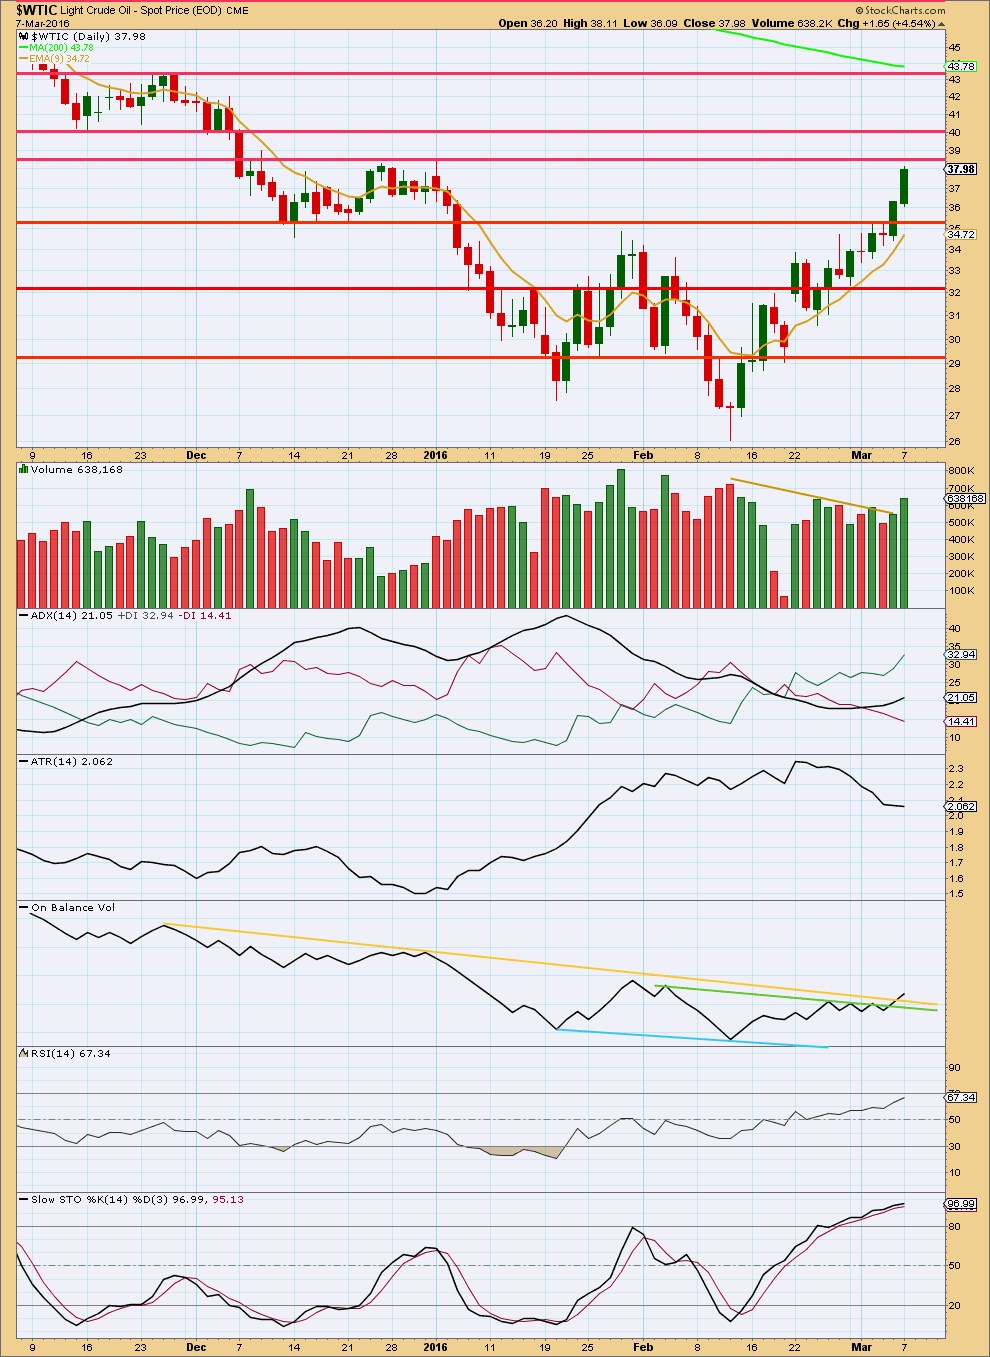
Price has broken out of a consolidation above 35.30 for two days with upwards movement on increasing volume. This is a bullish breakout. The next line to offer some resistance would be at 38.50. Thereafter, at 40.00 and 43.40.
ADX is above 15 and increasing; the +DX line is above the -DX line. ADX indicates the market is trending and the trend is up.
ATR disagrees as it is flat to declining.
RSI is not yet overbought. There is room for the trend to continue. Only when RSI exhibits divergence with price would an end to the trend be indicted by RSI. In a trending market RSI may remain extreme for periods of time.
Stochastics is also overbought, but in a trending market this oscillator may remain extreme for significant periods of time. Stochastics shows no divergence with price today.
The break above the yellow line is bullish from On Balance Volume.
This analysis is published @ 10:00 p.m. EST.
Will wait for a throw back to sell crude
Out, out of longs in oil today. I could have sold a lot higher friday, but I was expecting a little more higher prices base on Elliott Wave. I guess the wave count analysis didn’t allow me to saw what was obvious.
Close all my longs and open shorts today in oil. Despite whatever the wave count may suggest. I’m sure in the future it will appear a way to count the recent rise in oil over.
We had a bearish abandon baby pattern on USO (OIL ETF) today. A very reliable pattern.
http://www.investopedia.com/terms/b/bearish-abandoned-baby.asp?layout=infini&v=4C&adtest=4C
Here is the chart.
Looking forward to see Lara’s analysis today.
I think minor wave 3 of intermediate wave 3 of primary wave 5 have begun.
Cheers
I think US oil has broken the lilac trend line at 37.53.
crude made a bottom (or maybe a double bottom with the right bottom being lower) with the macd histo divergence. Crude exceeded the hump between the two bottoms. Now it seems to be in a trading range.
Epic short squeeze helps launch historic gains in oil stocks
http://www.marketwatch.com/story/epic-short-squeeze-helps-launch-historic-gains-in-oil-stocks-2016-03-04?link=TDheadline_4
The Perfect Storm in Oil Prices Will Hit in the Ides of March
What really happened in February was a little consolidation, as both oil and stock caught their breath after a long first leg down in prices, but the worst pressures that I’ve been predicting were never set to come in February, but to start in March.
http://thegreatrecession.info/blog/perfect-storm-in-oil-prices/
Good posts. Thanks!
US Oil option 2 chart Head and shoulder possibility.
There are two possibilities for oil.
1) Oil just bounced off the major 2003 support at $26. A multi year Head and shoulder with left shoulder at $ 39.90 and right shoulder at $40eesh. Neckline at $25 to 26 across. Once it puts in the RS it will go thru the NL to final target of $17 or $10.
2) US oil has final bottom at $26 and has changed the multi year trend. A bottom HnS with RS at $34. to be formed. BUT Lara: “The structure of cycle wave c is incomplete.”
So option 2 has low probability.
Thank you very much for this looks good
Lara, what do you think of the wave count I’m posting below, is the same as yours on the monthly time frame, but slightly different on the daily and hourly time frame. I still expect that we are in minor wave 2 of intermediate wave 3 down, but I’m counting it a little different based on what I saw form Kennedy’s Wave Count. I don’t agree with his count also, but I agree with some things.
I basicly expect minor wave 2 to end soon around $40 or $41 dollars in the next few trading days.
I’m first posting the daily chart, and latter zooming in on the last part with an hourly chart.
Thank you for you comments and input.
And here I’m zooming in on the daily wave count I posted earlier.
Cheers
US Oil current daily count has expanded flat wave c near completion????
Wave a was $7.32 in length. Wave c is $11.52 in length.
Fib of wave c to wave a is 11.52/7.32= 1.57 == 1.60??
Maximum can be for wave c is 2.0 of wave a.
Posting some screenshots of EWI’s J Kennedy’s wave count from the video link below posted by Johno. This will make it easier for us to keep an eye on this possible count.
Daily
360 minute
Excellent! Thanks
So, the trend line/ resistance to upward movement is about $39.50 to $40.
Sorry difficult to see on my chart.
Thanks Lara
Lara
Good bounce today… is the structure of oil looking clearer now..???…what should me expect nxt…
More upwards movement.
Expect it to keep going up until the lilac line is breached.
EWI on Crude.
The link below should take you to a free video by Jeffrey Kennedy of EWI. Crude Oil segment starts at 6:30 min.
The count is substantially different from Lara’s. Kennedy is not the EWI energy specialist but he is certainly an experienced Elliotician. Any comments?
http://www.gannglobal.com/webinar/2016/March/16-03-EWI-Video3.php?inf_contact_key=b17185bd13a511a628650a7e66c875872f926d356f067faa4f4228c8e85b48c9
It will be interesting to read what Lara has to comment on this.
His wave count calls for $34 level. If that happens oil will have broke thru lilac trend line and according to Lara oil to accelerate down.
Yes need to watch how far oil will drop below $34.
Thanks for sharing.
I don’t know why he’s counted the fourth wave (red) as a zigzag in that way. With that count the B wave within it is a very rare running flat.
The count I have for that movement avoids a running flat and places the last low as a B wave zigzag within a larger expanded flat, which is an extremely common structure.
I can see the larger picture later on in the video.
I see that he’s got a third wave complete and a big fourth wave (primary degree?) continuing.
that’s possible of course, but the third wave has a very strong three wave look to it on the monthly chart. Now Oil could certainly do that, typical of commodities it has impulses that look like threes at higher time frames. BUT it does that when the fifth wave is swift and strong, forcing the fourth wave just before it to be very brief and shallow. His curved three wave look for wave 3 is because the fourth wave is much longer in duration that the second, not the normal vice versa.
I’ll stick with my own wave count thanks.
But I will chart Kennedy’s count and take a closer look, only because he’s very experienced and knows what he’s doing. If I think it has a good enough probability maybe I’ll publish as an alternate.
Thanks Lara.
Thanks Johno for the post and thanks Lara for the review. It’s always good to keep other credible ideas in mind.
We will need to take this count very seriously with a full breach of Lara’s maroon trend line and/or 40.28 (.618 retracement).
My thinking exactly.
If I’m wrong then this may well be a viable alternate.
Lara: May be US oil has bottom at multi year support @ $26??
Normal mean for the ratio is 15.
Gold to oil ratio chart had blow off to 45 the highest level in years.
The line chart indicates it is building a possible top HnS .
It is a concern that if gold is in bull trend and oil has still to complete cycle wave down to $11 the ratio will be much higher !!!!!!
Yes as lara said..she cant see micro 3 completed..so it is advisable to just stay away from oil…it has good chances of breaching last day high before falling..
Still look for support at the lilac trend line.
If that line is breached by a full daily candlestick then minute c and so minor 2 may be over.
That would be earliest indication that a third wave within a third wave, within an extended fifth wave, may be just beginning.
The next wave down for Oil should be a good one!
If / when the lilac line is properly breached then look for price to throw back to that line.
If price behaves like that it will be offering a low risk entry opportunity for a short trade on Oil. Stops may be money management stops, or set just above the maroon line or just above the lilac line. Or at the last high.
On daily chart US oil showing a bearish reversal candle : Dark cloud.
Expect oil to move down or side way .
Looks like minuete wave 4 of minute wave c have already started. Lets hope it doesn’t gets too deep. It might even be over.
Still expecting the $40 dollar mark to get out of longs and into shorts.
Cheers
This may be submicro (4).
When I look at the structure of the middle of this third wave on the hourly chart I’m struggling still to see micro 3 complete.
Ruppu
On daily chart Lara has waves in circle 1,2,3,4 and 5. Wave 5 in circle is noted at the bottom instead of at the top above wave 4.
Do know if this is misplaced?
Papudi
That 5 is of primary degree…the colour is different…That i dont think is misplaced…but yaa minutte 5 label is missing…
Lara :On your daily wave count chart is not far back to August 24 @ 37.98 eesh where minor wave (1) ended.
Current oil price has moved into the wave (1) price????? Does it have any significance??
Rule says wave 4 cannot enter wave 1..we are in interwave 3…
Alt count was invalidated due to the same reason..
Thanks Ruppa. It is wave 4 not to enter the wave 1.
I have to remember that.
Yes, it means this upwards movement cannot be a fourth wave correction.
That was last weeks alternate and it’s now invalidated.
This upwards movement looks like another second wave correction.
Which means the middle of primary wave 5 is extending.
Lara : Is duration of ending wave c or wave minor 2 within the fib?
Also what price the maroon line Is to be expected??
A look at monthly chart suggest that oil needs to come close to monthly 9ema as resistance. Current 9ema is at 41.96.
I don’t know what you mean by “within the fib”.
Although it looks like price may come up to touch the 9 month moving average, it does not have to.
To see what price point will touch the maroon trend line you’ll have to draw it on the daily chart and watch it. At this stage it looks like that may be about 39.3
Hi Lara you say: “The target remains at 37.81, but if this target is wrong it may not be high enough.” But then in your Stock chart it is already at 37.98?
Can you please clarify, thanks?
Sorry Ursula. I should have deleted that.
I will be using the 0.618 Fibonacci ratio and the maroon trend line for a target.
so what is the target to then return south?
Sorry, should have left that on this chart.
11.98 for intermediate (3) to end.
I can’t calculate a target for minor 3 within it until minor 2 is over and I know where minor 3 starts.
Agreed a 100%, I expect oil to go up to the $40 to $43 dollar level, where I plan to get out. $40 is the 0.618% fibonacci retracement, and $43 is where the 200 day moving average lies.
Thanks