
The main Elliott wave count expected downwards movement, which is what happened.
The short term target on the hourly chart was 1,228 and a bounce was expected from there. The bounce came at 1,229.17.
Summary: A new low below 1,209.08 would confirm the main wave count and invalidate the alternate. Unfortunately, there is no upper confirmation / invalidation point. The target for this correction to end is still 1,131, which may be reached in about two weeks. The market is still range bound and the main wave count may still change in terms of short term expectations; there are still at least three structural options open for intermediate wave (2). In the short term, a third wave down may be unfolding to either 1,211 or 1,190.
New updates to this analysis are in bold.
Last published weekly chart is here.
MAIN DAILY ELLIOTT WAVE COUNT
Click chart to enlarge.
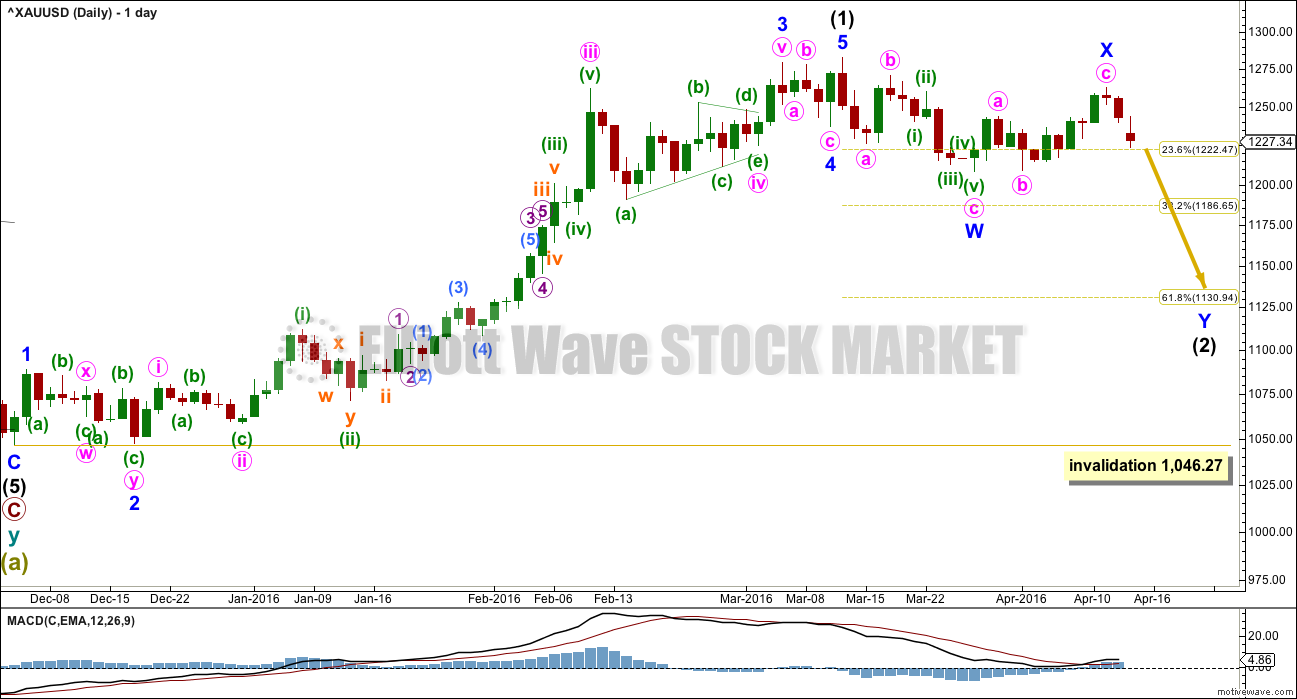
Intermediate wave (1) is a complete impulse. Intermediate wave (2) has begun and is most likely incomplete.
The first movement down within intermediate wave (2) fits as a zigzag.
At this stage, it looks like intermediate wave (2) may be unfolding as a double zigzag. Minor wave X may be a zigzag within the double.
Within double zigzags, the second zigzag exists to deepen the correction when the first zigzag does not move price deep enough. Here, minor wave W ends just below the 0.236 Fibonacci ratio fitting the description of “not deep enough” for a second wave correction. The second zigzag in the double should be expected to deepen the correction; minor wave Y may end about the 0.618 Fibonacci ratio at 1,131.
To achieve the purpose for the second zigzag to deepen the correction the X waves of double zigzags are normally shallow.
Intermediate wave (2) may be still be a flat correction although today this looks highly unlikely. If upwards movement continues to 1,275.24. At that stage, upwards movement would be 0.9 of the prior zigzag down, so the structure may be relabelled minor waves A-B with C down to unfold. Within flat corrections, the B wave is most commonly from 1 to 1.38 times the length of the A wave, so this gives a normal range for minor wave B of 1,282.68 to 1,311. There is a risk that upwards movement is not over while price remains above 1,209.08.
A new high does not invalidate this main wave count. The most common type of flat is an expanded flat which would require wave B to be 1.05 of wave A or longer. The price point for this would be at 1,286.40.
There is no rule stating a limit for a B wave within a flat nor an X wave within a combination. There is an Elliott wave convention that states when the possible B wave is twice the length of the A wave the probability of a flat unfolding is so low it should be discarded. That price point is at 1,357.04.
This is the risk to the wave count today.
Intermediate wave (2) may not move beyond the start of intermediate wave (1) below 1,046.27.
MAIN HOURLY ELLIOTT WAVE COUNT
Click chart to enlarge.
Both hourly charts will look at movement from the last high. Movement prior to that is seen subdividing in the same way for both wave counts.
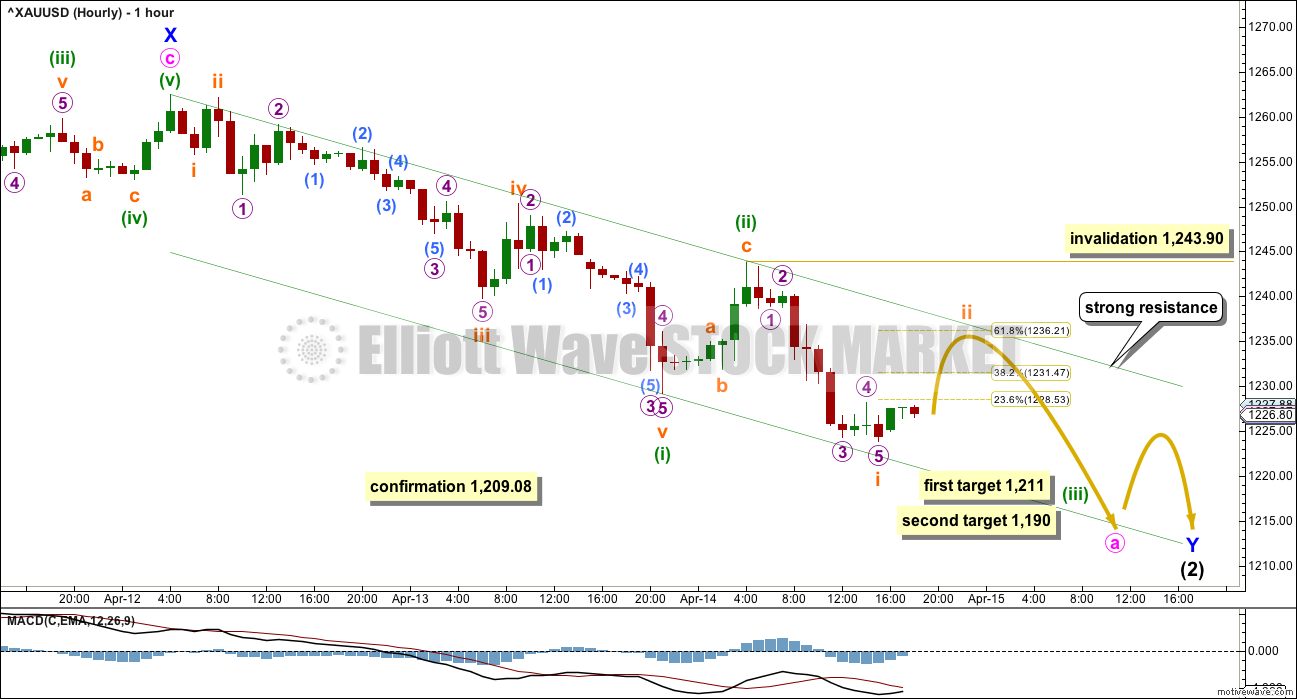
Intermediate wave (2) is incomplete and should still move lower. It may be either a double zigzag (more likely) or a double combination (less likely). This first hourly chart should be used until invalidated. This first hourly chart looks at intermediate wave (2) as a double zigzag.
A double zigzag should have a clear downwards slope and would most likely end about the 0.618 Fibonacci ratio at 1,131. Minor wave Y would be a zigzag which should subdivide 5-3-5.
So far an impulse is complete downwards for minuette wave (i). This was followed by a shallow zigzag for minuette wave (ii).
Draw a base channel about this unfolding impulse: draw the first trend line from the start of the first wave to the end of the second wave, then place a parallel copy on the end of the first wave. The upper edge of this base channel should provide strong resistance for upwards corrections along the way down. If you choose to trade this downwards wave, then each time price touches the upper edge it is an opportunity to join the trend. Remember to carefully manage risk; this wave count could be wrong: intermediate wave (2) could be a combination and minor Y could be a flat or triangle. The hourly chart would be invalidated if that is the case.
If the next correction for subminuette wave ii touches the base channel, then it may correct to the 0.618 Fibonacci ratio of subminuette wave i at 1,236. It does not have to be this deep; it may only reach the 0.382 Fibonacci ratio at 1,232.
When subminuette wave ii is complete, then a low degree third wave within a third wave down should unfold. Downwards momentum should increase.
The final fifth wave to end minuette wave (iii) may be particularly swift and strong. To end its impulses on a sharp movement is common for Gold, particularly its third waves. Look out for surprises to the downside.
Subminuette wave (ii) may not move beyond the start of subminuette wave (i) above 1,243.90.
ALTERNATE HOURLY ELLIOTT WAVE COUNT
Click chart to enlarge.
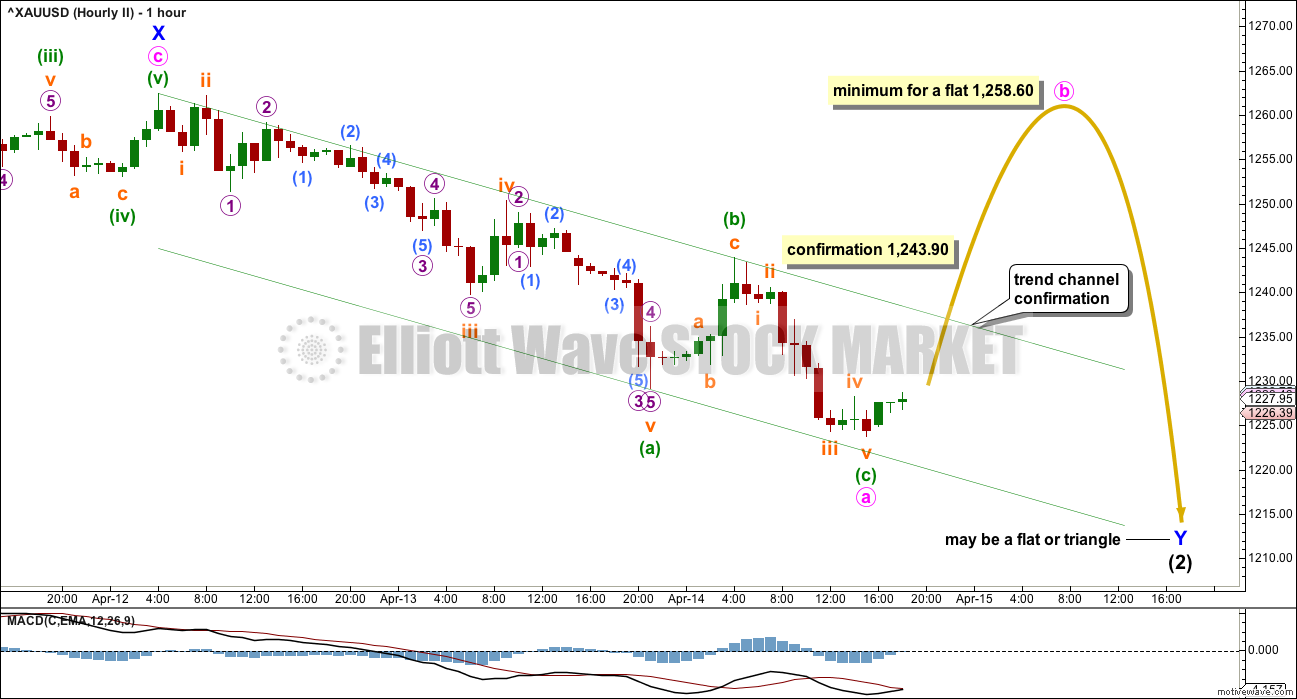
A double combination should have a sideways look, so the second structure in the double should end about the same level as the first. Minor wave W ended at 1,208.32. The second structure in a double combination would be either a flat or triangle for minor wave Y.
Because this would see intermediate wave (2) much more shallow than second wave corrections commonly are, particularly the first big second wave correction of a new trend, this possibility has a very low probability. But it is possible, so that is the risk to trying to trade this correction at this stage.
So far there is a 5-3-5 downwards complete. If minor wave Y is to be a flat or triangle, then minute wave a within it should be a three wave structure. It may now be a complete zigzag.
If minor wave Y is to be a flat correction, then minute wave b within it must make a minimum 0.9 retracement of minute wave a and so must reach to 1,258.60 or above. The normal range for a b wave within a flat is from 1 to 1.38 times the length of the a wave, which gives a normal range for minute wave b of 1,262.47 to 1,277.17. A new high would not invalidate this wave count.
If minor wave Y is to be a triangle, then there is no minimum requirement for minute wave b within it. Minute wave b must be a corrective structure, most likely a zigzag.
Minor wave Y would overall be a choppy overlapping sideways movement to last about two weeks, ending close to 1,208.32.
This alternate wave count should only be used in the unlikely even that the main hourly wave count is invalidated.
ALTERNATE DAILY ELLIOTT WAVE COUNT
Click chart to enlarge.
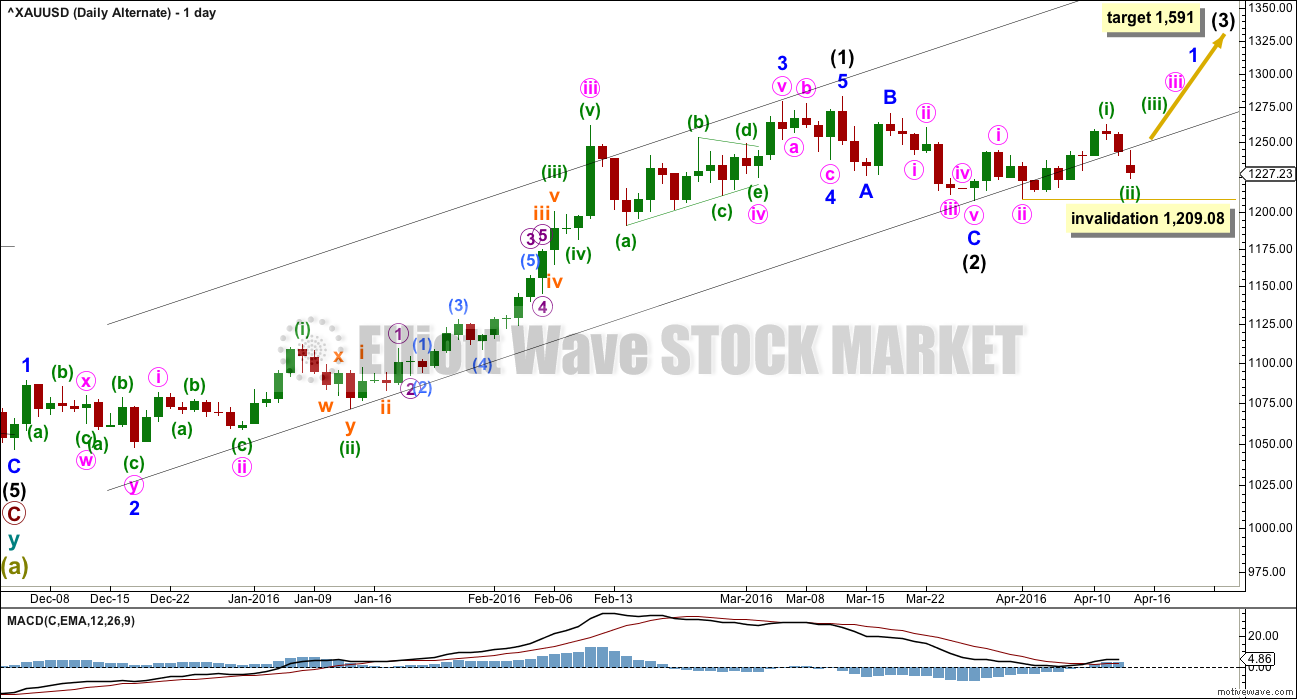
It is technically possible but highly unlikely that intermediate wave (2) is over. This wave count requires confirmation with a five up on the hourly chart for confidence. A new high is not confirmation of this wave count.
If intermediate wave (2) is over, then it is a very brief and shallow 0.31 zigzag lasting only eleven days (intermediate wave (1) lasted 69 days). The probability of this is very low.
At 1,591 intermediate wave (3) would reach 1.618 the length of intermediate wave (1).
Minuette wave (ii) may not move beyond the start of minuette wave (i) at 1,209.08.
I adjusted the best fit black channel about this upwards movement. This contains all except the end of minute wave ii within intermediate wave (1). It is very common for the ends of third waves to overshoot channels as they are the strongest movement within a trend.
It is indicative that the lower edge of this channel is now being breached. If a big third wave up has begun, price should be finding support at the lower trend line. For this reason today with a full daily candlestick below the line I will no longer publish an hourly chart. That would give this alternate too much weight. There is not enough bullish indication at this stage to have confidence that a third wave up is underway.
TECHNICAL ANALYSIS
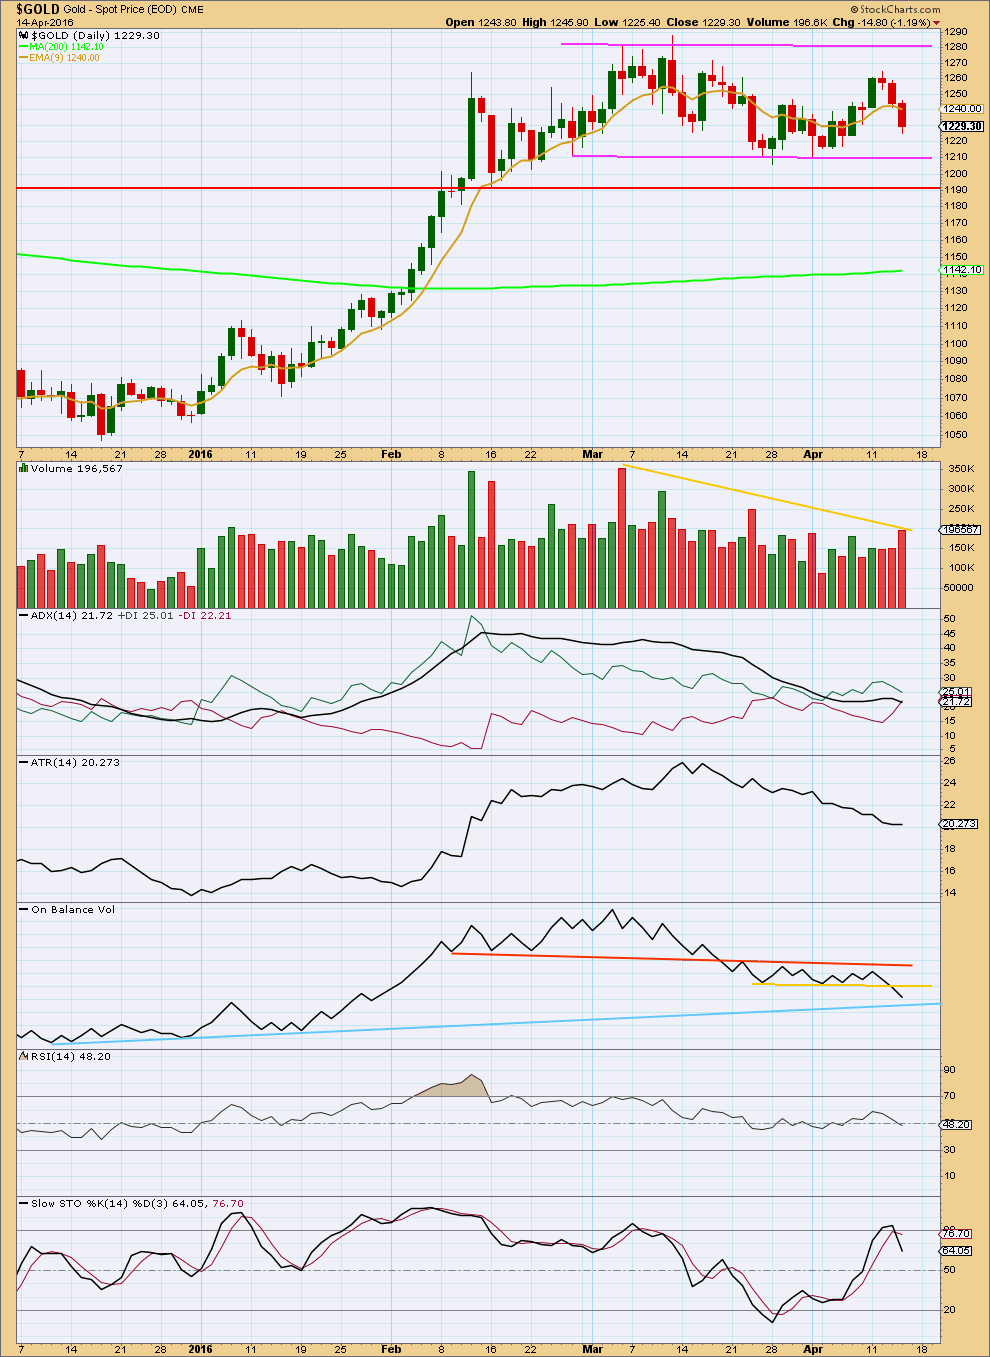
Click chart to enlarge. Chart courtesy of StockCharts.com.
A downwards day with a reasonable increase in volume supports the Elliott wave count short term. There was support for the fall in price. Overall, however, volume is still declining as price moves sideways and the bottom line remains that there has been no breakout from a zone of consolidation.
Price is still range bound between resistance about 1,280 and support about 1,210. A breakout is required for confidence in the resumption of a trend. A downwards breakout would be supported by a day with higher volume, but for a downwards breakout this is not necessary. The market can fall of its own weight.
ADX today is declining indicating the market is still consolidating. The +DX line is still above the -DX line, so this indicator is not yet indicating a trend change.
ATR is declining to flat. It agrees with ADX; there is currently no trend.
On Balance Volume is my favourite early indicator. When used with trend lines it will often breakout and show the direction for price before price breaks out. OBV today is giving a reasonable bearish signal with a break below the yellow line. This signal is reasonable because the break is so strong and the line is horizontal. However, that line is short held and only tested twice. A stronger bearish signal from OBV would come with a break below the blue line.
Also, OBV today gives some support for the main Elliott wave count at the daily and hourly chart levels.
RSI is neutral. There is room for price to rise or fall.
Stochastics touched overbought and is returning. A range bound trading approach may now expect a downwards swing about here; it looks like price was not able to quite reach resistance. Downwards movement may be expected to continue until price finds support and Stochastics is oversold.
Trading a range bound market is much more risky than trading a clearly trending market. If you are not a very experienced trader, then it is the trades you don’t take and the times of uncertainty in the market that you do not enter which will reduce risk and preserve your account. This membership has a wide range of market experience. If there is one lesson I could give, which would be the most valuable to new traders, it would be to manage risk.
This analysis is published @ 08:16 p.m. EST.
I’m slightly concerned that this small second wave is showing up on the daily chart as a small green candlestick and has breached the base channel. At the daily chart level it looks like this is minuette (ii), one degree higher.
I think my analysis of minuette (i) down may be wrong.
The impulse of minuette (i) could have been over at the last low.
The 0.382 Fibonacci ratio would be a t1,238.56.
The 0.618 Fibonacci ratio would be at 1,247.69.
This would be minuette (ii), not subminuette ii one degree lower.
Because it shouldn’t be too time consuming it’s likely to be over either now or on Monday.
The invalidation point must move up to 1,262.47. Unfortunately.
The short term trend remains down.
I don’t think this correction is over yet. Monday should see price move a bit higher, maybe to end at 1,239.
Ok Lara, I just went in for a little DUST and I’ll let it ride, since you say it may end at 1,239 and over now or Monday and the short term remains down. I was thinking of leaving it in until intermediate wave (2) bottom
TOS GOLD DAILY just gave a MACDTwoLines sell Tuesday and DMI went bearish and Scalper just gave a sell so those are good sell signs to hold DUST.
Looks like we will close today with a green daily candle on low volume. This is likely a correction, but it is a higher degree than subminuette. I think this correction may actually be minuette wave 2. Lara will just rework the count.
Or the move up is the alternate hourly. Both main and alternate hourly counts still in play.
Dreamer good guess.
“it looks like this is minuette (ii), one degree higher.”
?
No ,we are not in alternate wave up . We are in begining of small third wave of this wave 2 down. However since it is Fiday with only a little over an hour to go, and since it is a nice Spring weekend coming up , a lot of New York and Boston traders are taking off early for the Cape and Islands and are also reluctant to hold positions one way or the othjer over the weekend. So patience is the watchword . 1190 gold coming up next week. IMHO Stephen C. New London CT.
I have some doubts that this is subminuette ii…time consuming and Fibo are much more then minuette ii and it has breached the channel……Maybe the downward movement from the top is an abc for a wave and from the min is developping a b wave within Y wave……as alternate Lara’s count
It appears that subminuette 2 is an ABC. I think it is finishing the fourth wave of C and the fifth wave would put us nearer to 1236. My best guess is 1236.49, the 0.618 Fib.
We may try to short gold there, but I am a bit apprehensive now. It seems that nobody wants to do it. NUGT rose quite a bit when price rises but DUST appears to languish.
Any other views please.
$1,235.96 at 12:03 pm is high of the day so far on pmbull
I think subminuette ii ended there.
1236 was the top of Alan’s three choices for subminuette ii to end.
EMA/SMA indicator 5 minute time frame just moved to a buy DUST sell NUGT at 1:34 pm
DUST MACDTwoLines indicator 5 minute signaled a Buy at 12:50 pm same time NUGT signaled a Sell
Gold MACDTwoLines 15 minute time frame signaled a Sell just now.
GDX MACDTwoLines 15 minutes signaled a sell at 12:50 pm
I did just buy some DUST.
Richard. I looked at a 5-minute timeframe, and subminuette 2 stopped at 1235.96. You’re right.
The current movement looks like a slow descent. I will short it on a rise.
NUGT 5 minutes DMI Oscillator went bearish at 1:30 pm
DUST 5 minutes DMI Oscillator went bullish at 1:15 pm
GDX 15 minutes DMI oscillator went bearish at 1:00 pm
I only bought a little DUST.
Follow Lara’s rules of caution on trades.
Richard, that’s good to hear.
The move is against the main bull trend. And, DUST is moving very sluggishly. My estimate is that the next major resistance level is at 2.88.
Good morning Tham. Does this mean you have changed your view of price being in hrly II (minute b wave) to the main hrly (finishing subminuette ii)? Just wondering about your perspective
Good morning, dspropering.
That’s true. I am seeing price as being in Minute A, now undergoing the third of a third down in Minuette 3 Subminuette 3.
Alan, what changed your mind? — if anything in particular – because I’m starting to think gold’s gonna bounce us around in a-b-c – back to the shallow intermed 2 concept.
Hi dsprospering. I’m following Lara’s main count. It looks good until invalidated, when price > 1244. But, if price rises above 1236, I may consider bailing out of my short positions.
understood. judging by macd on 3hr/4hr time frame XAU I’m hesitant to wait for confirmation. guess this is where patience is required. Got so much to do today, really wanted an easy “get in or get out” signal. That’s Friday for ya.
I closed 90% of my small Dust yesterday for profit. 2.17 entry still good. Suppose I’ll ride this one out and wait for re-buy.
Best of trading to everyone. 🙂
We just finished subminuette ii at 1237.60 (nr.61.8%)on GCM6, heading lower in iii now?
Lara, if you have time please confirm, thanks for excellent analysis
I think you are right as I had gold topped at 12:03 pm at 1235.96 on http://www.pmbull.com 1 minute.
WAS long but now short at 1235 looking for at least 1190 in june futures , but depends on time frame.Iif we get to 1190 next week then we could go to Lara’s 1131 or so by the end of April when seasonal index ends .( Also look out for SPX topping to co-incide with gold bottoming. IMHO Stephen C
Narrow range inside day so far, I hope we don’t get a surprise to the upside!
Hey lara..
Got a mail that subscription got suspended..
Any technical issue..??..
I had dropped a mail to ceasar please reply..
Thank u.
Ruppuu 🙂
Cesar has received your email. You’ve resolved the problem?
Am in it with a short and remains to be seen if Gold price can break below 1225 to test a break below 1215. Appears Gold price is looking to bottom.
It looks like subminuette ii may be over here. If it continues higher there’s not much room for it to do that, the base channel is pretty close by now. It looks like another relatively shallow second wave correction.
I’m now expecting a third of a third wave down; but remember, the risk is the alternate may be correct. Price could keep rising from here.
I have entered a small short on Gold, I’m only risking 1.3% of my equity on this one trade. I’m keeping risk low because the market is still range bound.
I’ve put my stop at 1,238.8; just above the 0.618 Fibonacci ratio of subminuette i, and above the base channel. If there is an overshoot which is that big and deep then I would be very concerned that the alternate hourly wave count may be correct and so I would want to exit a short there.
My target is 1,131. If this unfolds as expected I’d prefer to just hold on through minute b to close when minute c is complete. Even if the position fluctuates, I’d rather not be in and out. Just in case minute b is quick and shallow.
Lara, if it is too early to post a weekly update, would you be willing to put the weekly cyan and magenta trendlines on the daily charts (maybe gray or something for weekly lines), so we can view the price progress? (my chart’s a mess)
Sure. Will do.
Thanks so much. Looking forward to it.
If the main Gold EW count is confirmed, the attached chart shows some possible targets for GDX and also some estimates for NUGT and DUST. If GDX hits target 1, then based on where Gold is, we should have an idea if GDX target 2 is possible. Good luck trading!
Thanks Dreamer!
Here it is.
Dreamer, Thank you for your two excellent charts, which help clarify possible price targets for GDX, NUGT and DUST if gold reaches 1,131 for intermediate wave (2).
I was wondering that myself this week. Two weeks may shock and awe a lot of investors good and bad.
Could you please clarify what is target 1? Is that 1,190 in Gold?
These targets are simply based on Fib retracements and are typical targets for the entire correction. I think it’s highly likely that the first target is hit. When we get there, if the gold correction has much more to go, then there is a good likely hood that the second target is hit.
Gold H&S pattern target agrees with EW target