
A little more upwards movement was expected to end about 1,248.
Price reached up to only 1,241.55 before turning down.
Summary: A new low now below 1,223.78 would provide confidence that downwards movement should continue. A new low below 1,209.08 would confirm the main wave count and provide more confidence in the target at 1,131. It is still most likely that a large second wave correction is incomplete and will move price lower.
New updates to this analysis are in bold.
Last published weekly chart is here.
MAIN DAILY ELLIOTT WAVE COUNT
Click chart to enlarge.
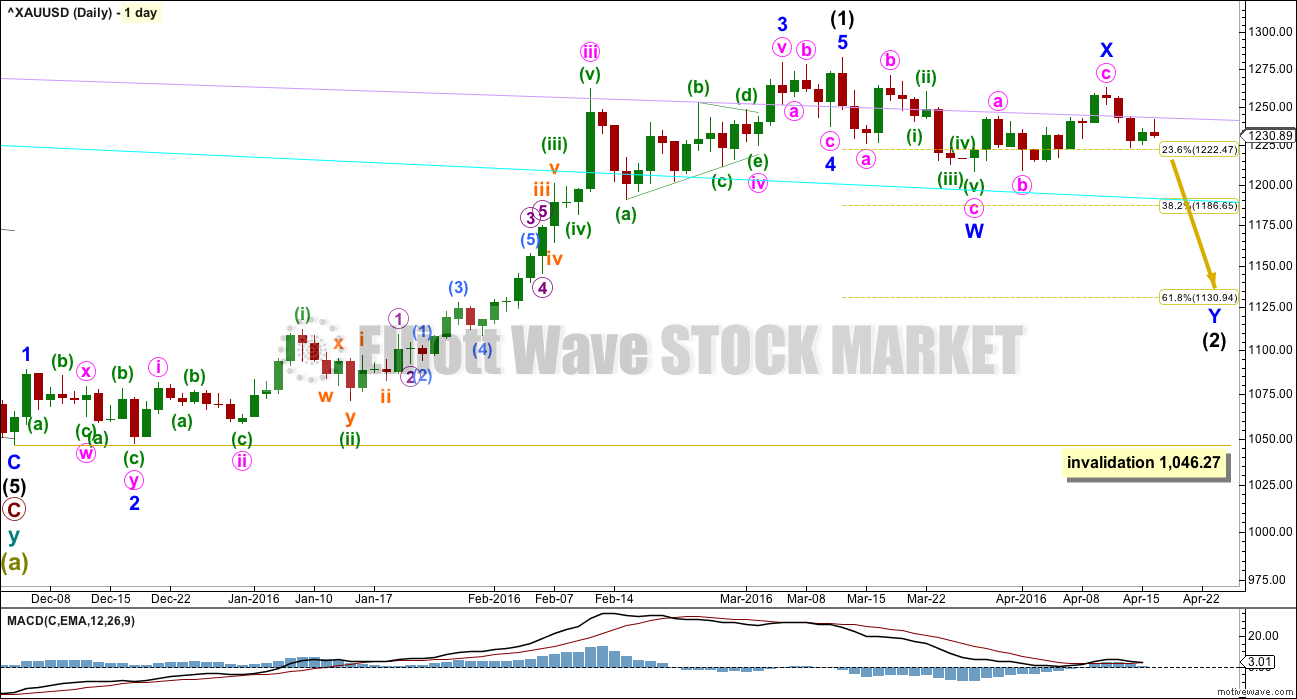
Intermediate wave (1) is a complete impulse. Intermediate wave (2) has begun and is most likely incomplete.
The first movement down within intermediate wave (2) fits as a zigzag.
At this stage, it looks like intermediate wave (2) may be unfolding as a double zigzag. Minor wave X may be a zigzag within the double.
Within double zigzags, the second zigzag exists to deepen the correction when the first zigzag does not move price deep enough. Here, minor wave W ends just below the 0.236 Fibonacci ratio fitting the description of “not deep enough” for a second wave correction. The second zigzag in the double should be expected to deepen the correction; minor wave Y may end about the 0.618 Fibonacci ratio at 1,131.
To achieve the purpose for the second zigzag to deepen the correction the X waves of double zigzags are normally shallow. Here, minor wave X is a 0.73 length of minor wave Y which is not shallow. For this reason, a combination is considered in the alternate hourly wave count. It is still more likely that intermediate wave (2) will be a double combination so that it is deeper.
Intermediate wave (2) may be still be a flat correction although today this looks extremely unlikely. If upwards movement continues to 1,275.24. At that stage, upwards movement would be 0.9 of the prior zigzag down, so the structure may be relabelled minor waves A-B with C down to unfold. Within flat corrections, the B wave is most commonly from 1 to 1.38 times the length of the A wave, so this gives a normal range for minor wave B of 1,282.68 to 1,311. There is a risk that upwards movement is not over while price remains above 1,209.08.
A new high does not invalidate this main wave count. The most common type of flat is an expanded flat which would require wave B to be 1.05 of wave A or longer. The price point for this would be at 1,286.40.
There is no rule stating a limit for a B wave within a flat nor an X wave within a combination. There is an Elliott wave convention that states when the possible B wave is twice the length of the A wave the probability of a flat unfolding is so low it should be discarded. That price point is at 1,357.04.
This is the risk to the wave count today.
Intermediate wave (2) may not move beyond the start of intermediate wave (1) below 1,046.27.
The lilac and cyan trend lines are copied over from the weekly chart (both weekly and daily charts are on a semi log scale). Upwards movement may have found resistance today at the lilac line. If this wave count is correct, then price should move lower from here.
MAIN HOURLY ELLIOTT WAVE COUNT
Click chart to enlarge.
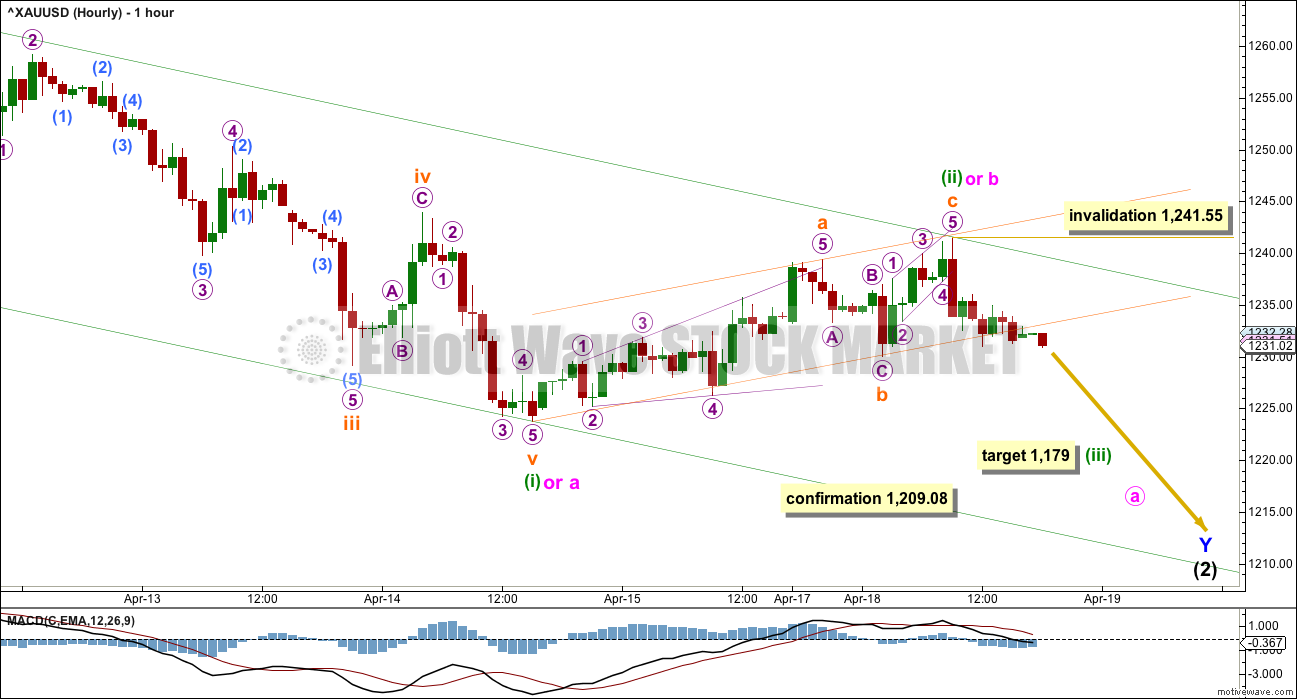
Intermediate wave (2) is incomplete and should still move lower. It may be either a double zigzag (more likely) or a double combination (less likely). This first hourly chart should be used until invalidated. This first hourly chart looks at intermediate wave (2) as a double zigzag.
A double zigzag should have a clear downwards slope and would most likely end about the 0.618 Fibonacci ratio at 1,131. Minor wave Y would be a zigzag which should subdivide 5-3-5.
So far within minor wave Y, minute wave a may be a complete impulse or this may only be minuette wave (i) within minute wave a. Either way the target and invalidation point would be exactly the same.
The correction for minute wave b or minuette wave (ii) looks to be a complete zigzag. There is no Fibonacci ratio between subminuette waves a and c. Subminuette wave a fits as a leading expanding diagonal and subminuette wave c fits as an ending contracting diagonal.
Within minute wave c or minuette wave (iii), the rule for a second wave correction is the same: it may not move beyond the start of the first wave above 1,241.55.
A small orange channel is drawn about the zigzag upwards of minute wave b or minuette wave (ii). This small channel is now breached by some downwards movement giving earliest indication that the upwards zigzag is most likely over. Minute wave b or minuette wave (ii) is a 0.46 correction of minute wave a or minuette wave (i). This is deeper than the 0.382 Fibonacci ratio but not deep enough to meet the 0.618 Fibonacci ratio. It is not too shallow now to be complete, and the proportion in terms of duration looks right.
At 1,179 minuette wave (iii) would reach 1.618 the length of minuette wave (i). This target may be met in about two days time.
The green downwards sloping channel is a base channel about minuette waves (i) and (ii), or a corrective channel about minute waves a and b (they’re drawn in the same way): draw the first trend line from the high of 12th April (just off to the left of this hourly chart now) to the high labelled minuette wave (ii) or minute wave b. Place a parallel copy on the low labelled minuette wave (i) or minute wave a. Along the way down, upwards corrections should find resistance at the upper edge of the channel. If the channel is breached by downwards movement, that shall be confirming downwards movement is a third wave, so then this movement would be labelled only minuette waves (i) – (ii) – (iii). The target would be most likely.
If price moves above 1,241.55 short term, then my labelling of minuette wave (ii) or minute wave b as over may be premature. The alternate below would slightly increase in probability, but a variation of this main wave count which sees minute wave b or minuette wave (ii) as moving higher in a double zigzag would still be more likely.
ALTERNATE HOURLY ELLIOTT WAVE COUNT
Click chart to enlarge.
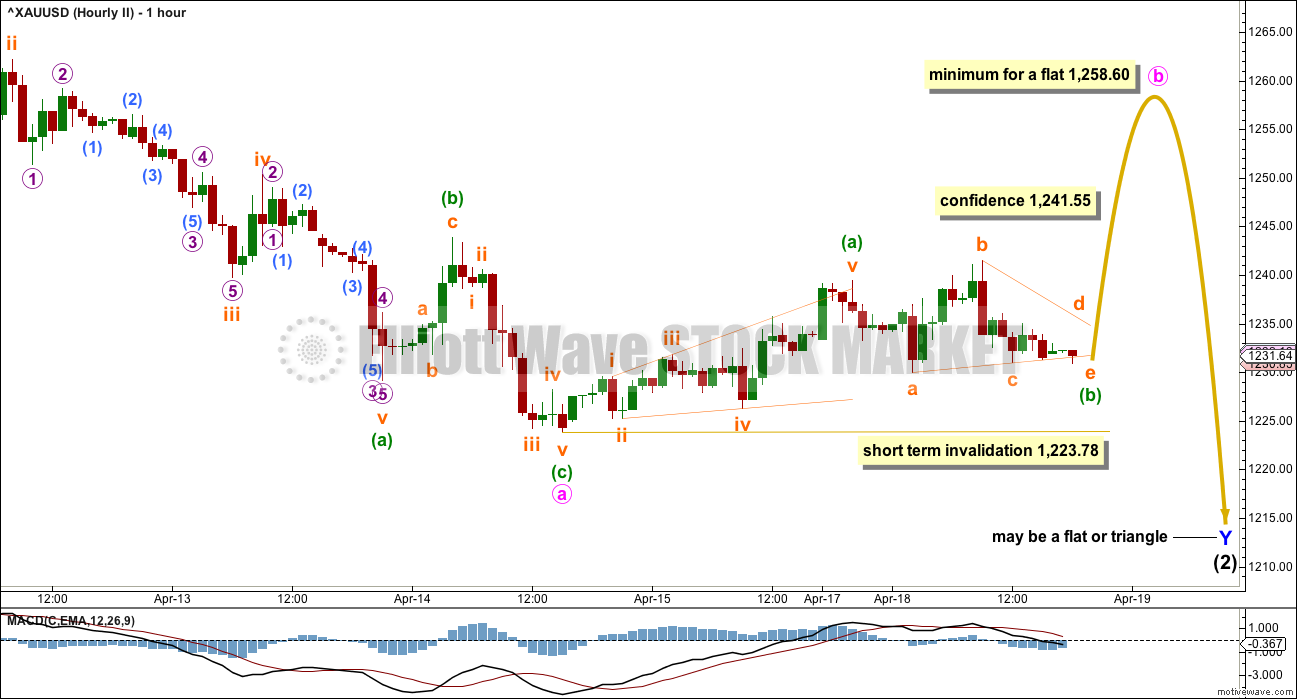
This alternate hourly wave count looks at a possible double combination for intermediate wave (2).
A double combination should have a sideways look, so the second structure in the double should end about the same level as the first. Minor wave W ended at 1,208.32. The second structure in a double combination would be either a flat or triangle for minor wave Y.
Because this would see intermediate wave (2) much more shallow than second wave corrections commonly are, particularly the first big second wave correction of a new trend, this possibility has a very low probability. But it is possible, so that is the risk to trying to trade this correction at this stage.
If minor wave Y is to be a flat or triangle, then minute wave a within it should be a three wave structure. It may now be a complete zigzag.
If minor wave Y is to be a flat correction, then minute wave b within it must make a minimum 0.9 retracement of minute wave a and so must reach to 1,258.60 or above. The normal range for a b wave within a flat is from 1 to 1.38 times the length of the a wave, which gives a normal range for minute wave b of 1,262.47 to 1,277.17. A new high would not invalidate this wave count.
If minor wave Y is to be a triangle, then there is no minimum requirement for minute wave b within it. Minute wave b must be a corrective structure, most likely a zigzag.
Minor wave Y would overall be a choppy overlapping sideways movement to last about two weeks, ending close to 1,208.32.
This alternate wave count today illustrates the risk in trying to trade during this consolidating market. Because there are multiple corrective structures (as compared with just two motive structures), the number of possibilities is too great for certainty during a correction.
In the short term, within minute wave b upwards, the structure looks like it may be a zigzag. Within the zigzag, minuette wave (b) may not move beyond the start of minuette wave (a) below 1,223.78.
In the short term, a new high above 1,241.55 would add some confidence to this wave count.
ALTERNATE DAILY ELLIOTT WAVE COUNT
Click chart to enlarge.
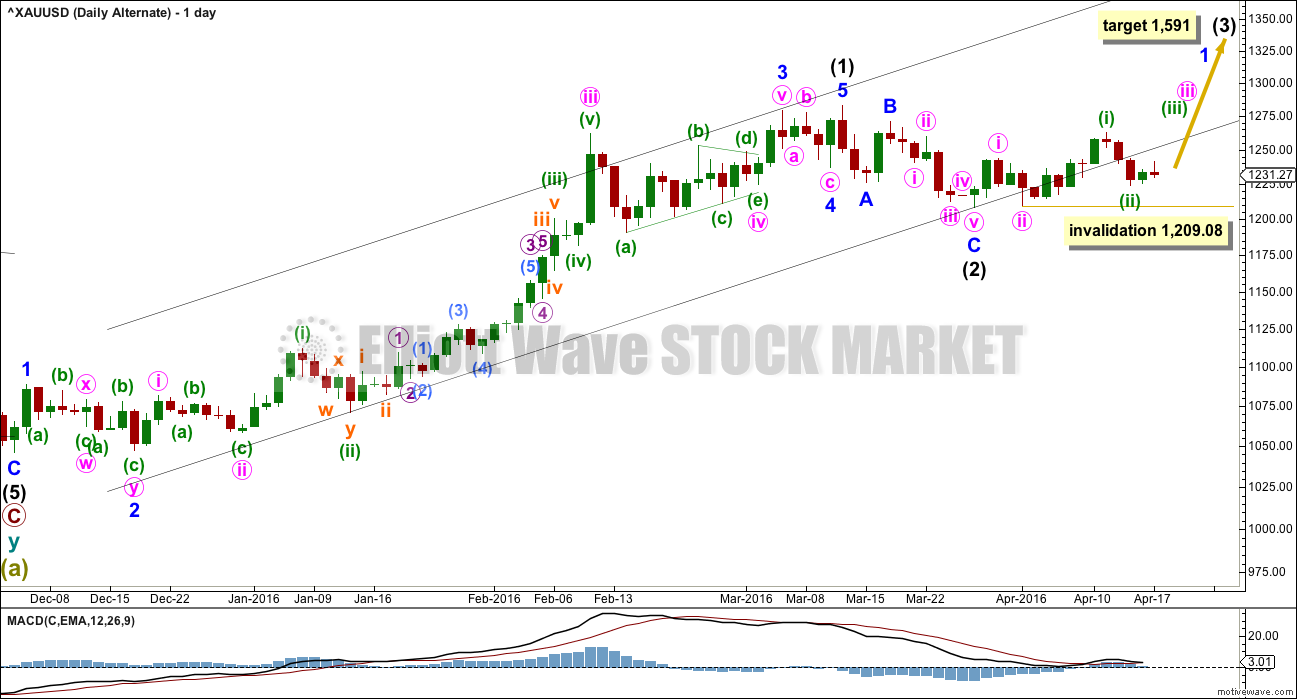
It is technically possible but highly unlikely that intermediate wave (2) is over. This wave count requires confirmation with a five up on the hourly chart for confidence. A new high is not confirmation of this wave count.
If intermediate wave (2) is over, then it is a very brief and shallow 0.31 zigzag lasting only eleven days (intermediate wave (1) lasted 69 days). The probability of this is very low.
At 1,591 intermediate wave (3) would reach 1.618 the length of intermediate wave (1).
Minuette wave (ii) may not move beyond the start of minuette wave (i) at 1,209.08.
The best fit black channel about this upwards movement contains all except the end of minute wave iii within intermediate wave (1). It is very common for the ends of third waves to overshoot channels as they are the strongest movement within a trend.
It is indicative that the lower edge of this channel is now being breached. If a big third wave up has begun, price should be finding support at the lower trend line. For this reason today with now two full daily candlesticks below the line I will no longer publish an hourly chart. That would give this alternate too much weight. The breach of the channel is now very clear. This has further reduced the probability of this wave count.
TECHNICAL ANALYSIS
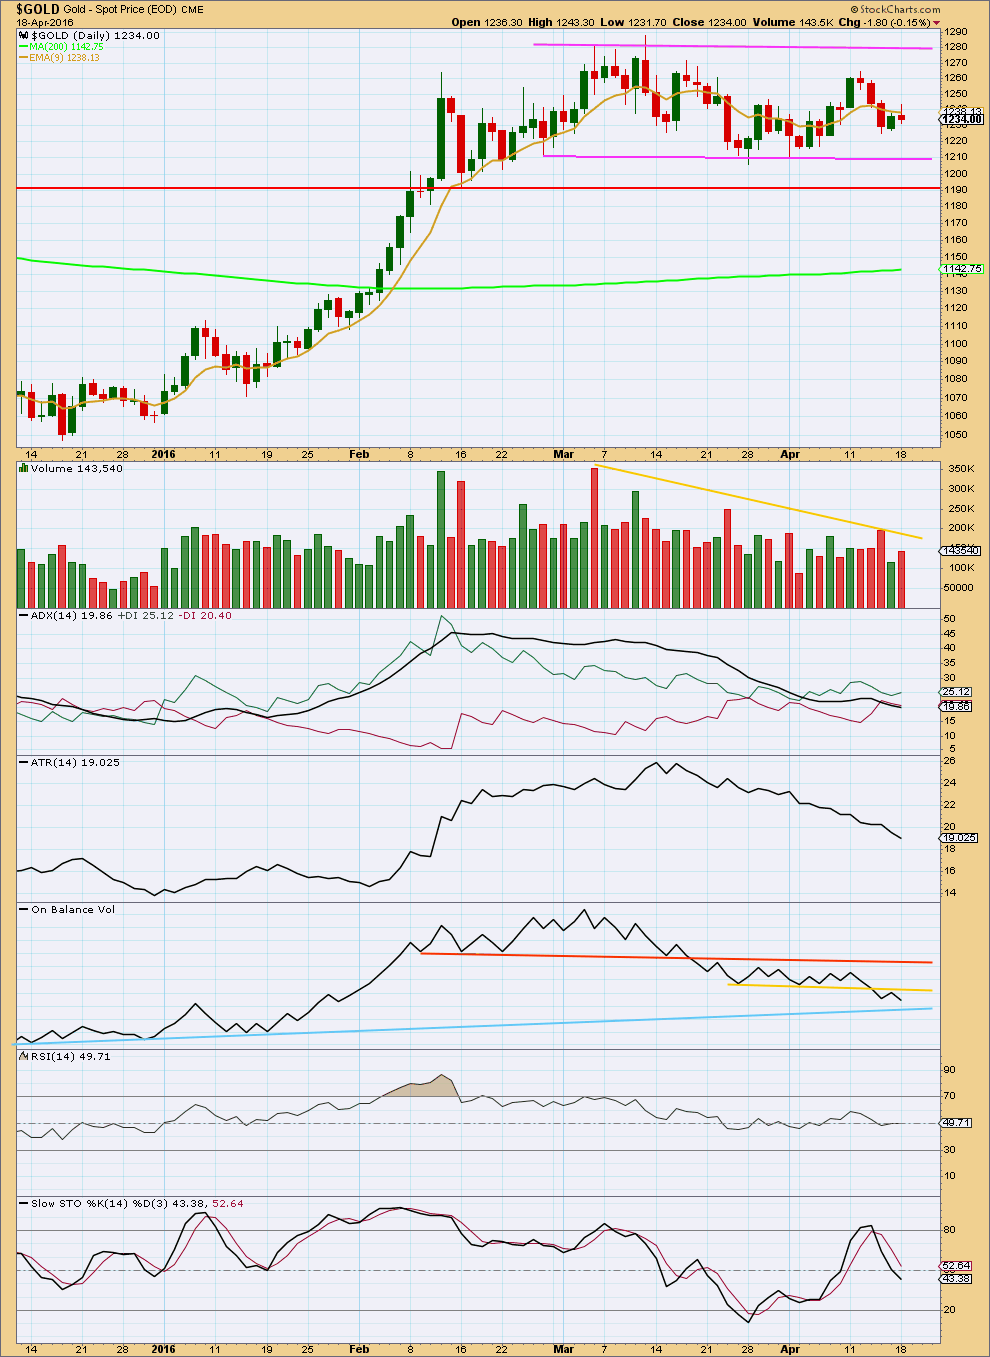
Click chart to enlarge. Chart courtesy of StockCharts.com.
A small red daily candlestick comes with an increase in volume. With volume for Friday’s upwards day very light and volume for downwards days (of the last five days) stronger, this supports the Elliott wave count short term which expects more downwards movement from here.
Price is still range bound between resistance about 1,280 and support about 1,210. A breakout is required for confidence in the resumption of a trend. A breakout would be supported by a day with higher volume, but for a downwards breakout this is not necessary. The market can fall of its own weight.
ADX today is declining indicating the market is still consolidating. The +DX line is still above the -DX line, so this indicator is not yet indicating a trend change.
ATR is declining. It agrees with ADX; there is currently no trend.
On Balance Volume is my favourite early indicator. When used with trend lines it will often breakout and show the direction for price before price breaks out. OBV today is giving a reasonable bearish signal with a break below the yellow line. This signal is reasonable because the break is so strong and the line is horizontal. However, that line is short held and only tested twice. A stronger bearish signal from OBV would come with a break below the blue line.
OBV turned upwards slightly to find resistance at the yellow line and has now moved away again from that line. The strength of the yellow line is reinforced. This indicates that upwards movement is over for price.
OBV may find some support at the blue line before it breaks through (if it does) or it could just move straight through it. A break below the blue line would be a strong bearish indicator. This may come before price breaks below support. If it does, then a downwards breakout from price would be highly likely.
RSI is neutral. There is room for price to rise or fall.
Stochastics touched overbought and is returning. A range bound trading approach may now expect a downwards swing about here; it looks like price was not able to quite reach resistance. Downwards movement may be expected to continue until price finds support and Stochastics is oversold.
Trading a range bound market is much more risky than trading a clearly trending market. If you are not a very experienced trader, then it is the trades you don’t take and the times of uncertainty in the market that you do not enter which will reduce risk and preserve your account. This membership has a wide range of market experience. If there is one lesson I could give, which would be the most valuable to new traders, it would be to manage risk.
This analysis is published @ 08:07 p.m. EST.
China is one step closer to global gold-price domination
Apr 19, 2016 5:29 p.m. ET
Analyst: Shanghai Gold Fix marks ‘start of a new global gold market’
http://www.marketwatch.com/story/china-is-one-step-closer-to-global-gold-price-domination-2016-04-19
This upwards movement fits so far reasonably well as a five. it will also fit as a three, but with a very short A wave. So a five has a better look.
This means I expect it is fairly likely to be over at todays high, but that is not going to be confirmed until price makes a new low below 1,209.08 unfortunately.
I’ll have two wave counts today.
The last wave down to the low for 14th April will subdivide as a three or a five. So both must be considered.
If it is a three then the alternate outlines what should happen; upwards movement could continue and may move above 1,262.47.
If it is a five then it is minute wave b of minor Y for the main wave count. Minute a would be seen as a five wave impulse, minute b a zigzag. Minute b may not move above the start of minute a at 1,262.47.
The bottom line: Gold remains range bound. This is a correction. It is intermediate (2) and the structure is incomplete.
Either sideways movement for a few more days, maybe just over a week now.
Or downwards movement to 1,131 to end it. Which is still more likely at this stage.
Is today’s alternate a follow-through on yesterday’s — being a flat– or is it some other structure now? (got a pic yet?)
Actually, I think I got it. You are pretty clear here. Think I’m perturbed about the sideways possibility for a few more days. Not at my patient best right now.
Thanks for the timely analysis today.
You’re welcome.
I know consolidations are exasperating.
Patience is the key.
And my job is to present as many alternates as I can see (within reason, if the probability is too low I don’t publish) and rank them in order of probability.
When that happens and price is in a correction it means the short term expectation is unclear.
DUST and JDST are becoming worthless as GDX is bought up fast at every daily low and and averaging up, now new high of $23.44 at gold $1252.
DUST lost 91% of it’s value of $1.86 at January high of $20.66.
Even if gold dropped for 2 weeks DUST may not end up higher if GDX is bought up heavily at daily lows.
DUST even loses value today when gold drops $5 and GDX is bid up again a few times.
Any counts..??
Yes. The alternate.
May 1256.75 at 10:11 am end up being the high of the day or does gold still have to reach a minimum of 1258.60 or have one more wave up?
The fact of the matter is that the Chinese pegging the yuan to gold DOES MATTER. It wiill matter even more when the Chinese and Russians and Saudi Arabia and Maylasia etc. start pusing to value oil in YUAN instaed of dollares, and even more when the US FED announces a SWAP of treasury debt (bonds) for gold in Ft. Knox . To effect a devaluation of the US dollar . This will mean an even greater rise in gold well beyond the previous high. Lara please consider that the B wave we MAY be in already occurred and thaty the last low at 1045 in December was a C wave bottom , and we are now in the next 5 wave cycle up . Stephen C BNew London CT>
start” pushing” (correction)
A pro trader who is on a Gold council in China said about the Yuan and gold.
“I don’t think China has any influence on Gold market. Their gold price will most likely follow US and London market.”
Does the Yuan-Gold Benchmark Matter? – Analysts
By Sarah Benali Tuesday April 19, 2016 10:32
http://www.kitco.com/news/2016-04-19/Does-the-Yuan-Gold-Benchmark-Matter-Analysts.html
I am considering that this is primary 3 up, mostly because you requested it.
It is the alternate daily chart.
But when I consider that possibility I must look at the Elliott wave count and make a judgement from an Elliott wave perspective of the probability of that wave count. My judgement is it has a very low probability. Your judgement is that it has a higher probability.
The bottom line is Gold is still range bound. It has not broken out yet.
Just because miners are breaking out upwards does not mean Gold must follow. Gold could yet break out downwards and pull miners lower with it. To see which market leads and which market follows involves a level of mathematics which is not something that I’m able to do.
I move a trailing stop higher as gold goes higher but will definitely add to long positions on a top out of the SPX which should happen soon. (or NOT). Stephen C.
FWIW. i WENT HOME SHORT JUNE GOLD LAST NIGHT , but covered my shorts late at night at and went long when we could not break below 1229. Now holding June long position since 1230 for possible new highs. It would seem that the seasonal index is running out of time for an April low ,as it was SUPPOSED to start in late March and early April. It seems the speculative longs (like me) are pushing the market up (along with China and Russia. This has more to do with currency problems than inflation and the fact that the US has very little gold anymore in Fort Knox, vs. the other major powers in their treasuries. The miners are being held long term by many who ARE NOT SELLING, but adding on any dips. The likelihood of being in a wave 3 UP gets stronger each day with an intermediate wave 2 having completed at 1203 on the June Comex contract . IMHO Stephen C. New London CT>
8:30 am US housing data down and gold up
Hi Laura,
Through June timeframe, it looks like you are bullish on Gdx and bearish on Gold – correct?
Thanks
? no?
I have a downwards target for GDX at 16.78.
Possibly just one more wave up, then down.
I concur. This is same as my supposition below, the modified main count. I could have made a mistake though. Yours count five waves before the end. It should be more accurate.
This concerns me about Hourly II chart. If this is happening?
” The normal range for a b wave within a flat is from 1 to 1.38 times the length of the a wave, which gives a normal range for minute wave b of 1,262.47 to 1,277.17.”
My chart suggests a variation of the main hourly which Lara says is more likely than the alternate hourly. It’s a double zigzag.
Main hourly wave count is invalidated. Alternate is in play.
Silver has a huge breakout to upward. Silver is leading.
Silver to gold ratio has broken out and is very bullish for PM sector.
Chart to follow at the end of the day today.
With price moving higher than 1241.55 (Lara’s feed, 1241.73 in mine), it means that either the alternate is in play, or more likely, minuette 2 of the main count is now a double zigzag 1223.91 – 1241.73 – 1227.77 – ?
If minuette 2 is a 0.618 retrace (1247.92) or SM Y = SM W (1245.59), then upward movement is likely to be over, at 1246.41.
The alternate also yields similar values. We shall wait with patience. The market is not open yet.
Alan
What effect China’s gold fix will have on POG?
Many are waiting for announcement today which may have happen by now by China.
https://www.armstrongeconomics.com/markets-by-sector/precious-metals/gold/chinas-coming-gold-fix-april-19th-2016/
Hi Papudi.
I really cannot say what will actually happen. It depends on your perception of the American investor. Is he knowledgeable of events outside US? I think you are in a better position to decide this, living on American soil. From my infrequent dealings with the average American, I perceived that a significant number are quite ignorant of events happening outside US, some even outside their state. If that is the case, then China’s gold fix will be a non-event.
By itself, my best guess is that the price of gold will drop for a while before rising. The rationale is government manipulation. China is still in the process of accumulating physical gold, and obviously the cheaper the better. When they have enough, the price will be artificially inflated, same as QE, because the Chinese wants to have more value for their hoard.
And on daily chart we can clearly see a zigzag today with todays move as C..
Is it usefull point for bears..??
B wave is taking lot of time i guess….Main hourly count got invalidated once again…
Should we expect now that 1248 is still a barrier for prices and prices will take a U turn from here or alternate count is in play…??.
Elliott Wave Analyst article on Gold
In Chess The Pawns Go First Apr. 18, 2016 11:11 PM ET
http://seekingalpha.com/article/3966097-chess-pawns-go-first
He is leaning towards a target of $1,136 – $1,164.
However there is another wave count that moves up into the $1,300 and $1,400’s.