I have a new alternate Elliott wave count for you.
Summary: If price makes a new low below 1,208.33 on Monday and remains below 1,235.16, then expect overall more downwards movement for another few days most likely to end about 1,131. This alternate is possible but has a very low probability. Low probability does not mean no probability.
New updates to this analysis are in bold.
Last published weekly chart is here.
SECOND ALTERNATE DAILY ELLIOTT WAVE COUNT
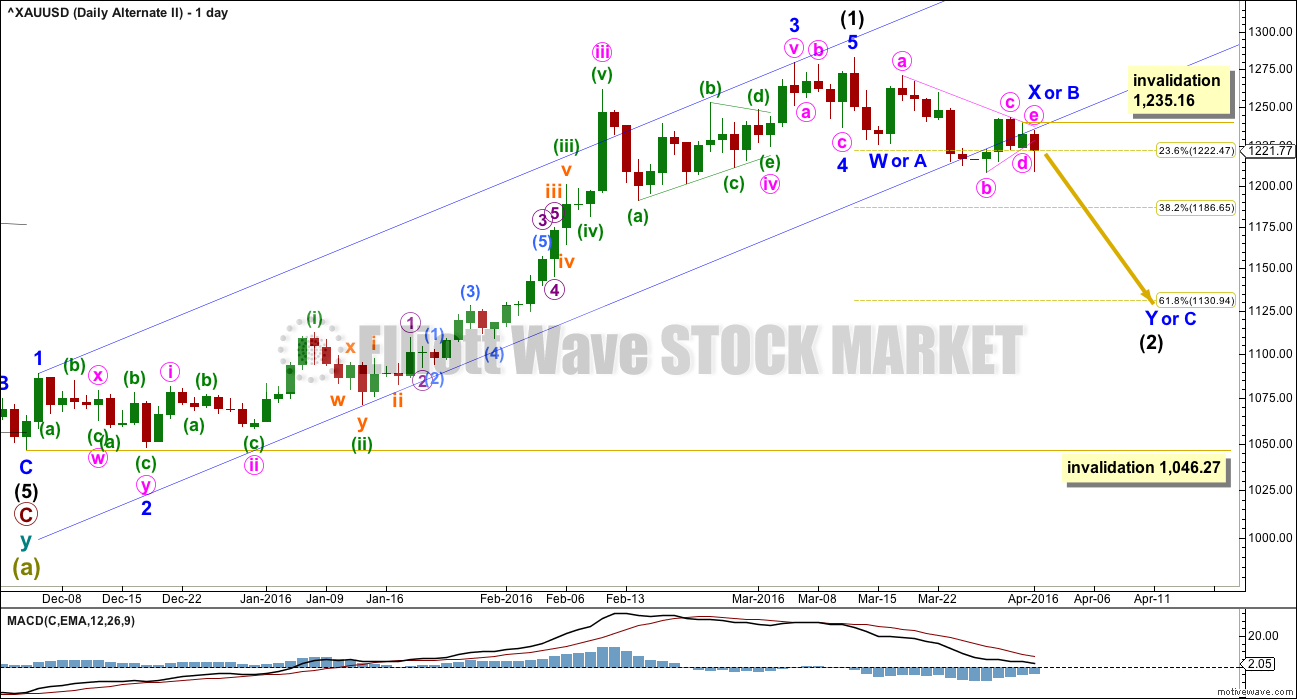
What if the main wave count is wrong? What if price moves lower on Monday? What structure could that be?
This is the best possibility I can see at this stage. And it does not have a very good look.
There are multiple structural possibilities for a second wave. The only structure it may not take is a triangle (although a triangle may be part of a combination). This leaves 17 structural possibilities.
If a triangle is accepted as labelled (and this does not have a good look), then intermediate wave (2) may still be subdividing as a single or double zigzag. A double zigzag has a slightly better look, although both will fit. Minor wave W will subdivide as either a zigzag or an impulse.
The problem with this wave count is minor wave X as a triangle does not have the right look. This part of the wave count looks very forced. This substantially reduces the probability of this wave count, but low probability is not no probability.
If the main wave count is invalidated with a new low below 1,208.33, then this may be an explanation.
At that stage, intermediate wave (2) may be expected to continue lower to reach the 0.618 Fibonacci ratio of intermediate wave (1) at 1,131.
SECOND ALTERNATE HOURLY ELLIOTT WAVE COUNT
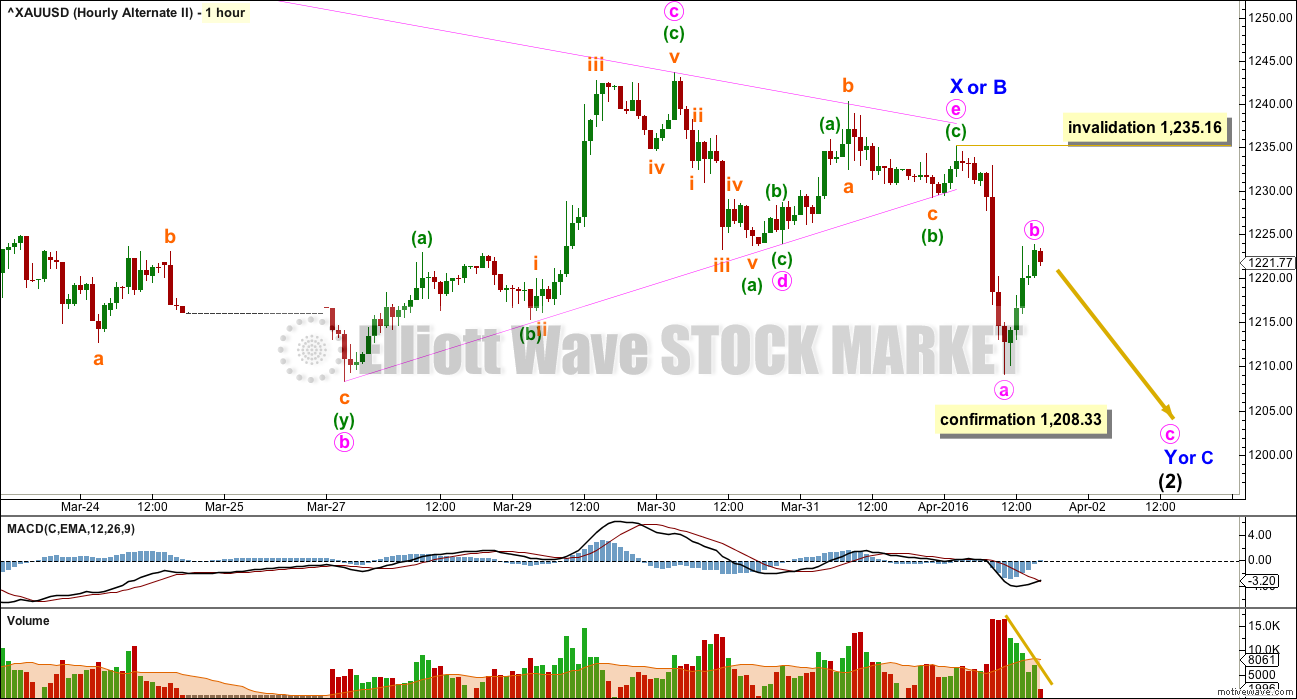
Minor wave X is labelled as a running contracting triangle. The only thing that looks right about this structure is its adherence neatly to the triangle trend lines.
The breakout from triangles is usually swift. This part of the wave count also has the right look.
The upwards movement from Friday’s low is coming on declining volume. This supports this wave count and new lows in the short term. There was no support for that upwards movement from volume, so it is suspicious. That is concerning for the main wave count and one of the biggest reasons for considering this alternate.
Whether the next wave down is a zigzag for minor wave Y or an impulse for minor wave C, the rule for the B or 2nd wave is the same. It may not move beyond the start of minor wave Y or C above 1,235.16.
This analysis is published @ 06:26 p.m. EST on 3rd April, 2016.


Sideways movement doesn’t clarify anything for us today. It just makes everything more confusing.
I’m still considering alternates.
What if this is minor C down of intermediate (2)?
I’ve considered C as an ending expanding diagonal (thanks Alan) and discarded it on the basis that it doesn’t adhere to trend lines. Chart in comments, reply to Alan below.
I’m considering C as an impulse. The only other structural possibility. It would be now in its third wave. The subdivisions fit, but it doesn’t fit with MACD. The first wave would be stronger than the third. And so that looks unlikely.
For the main wave count I’m considering what if minute b is continuing sideways as a triangle? That would explain this small inside day.
The conclusion I have to come to today is the situation is currently unclear. There are so many alternate possibilities I can see, many valid, all with at least one problem. I’ll publish two or three most likely, least problematic options.
Price is still consolidating. It’s range bound. A swing upwards to take price to resistance and Stochastics to overbought should be expected, but price rarely (almost never) does that in a straight line. Which is one reason why trading a consolidating market is so risky and best left to the most experienced traders.
I’m waiting for a breakout, and a trend to resume before entering this market.
Thank you Lara for your erudite analysis and comment. Right now ,in the absence of any probability of over 50% for either a break up ,or down, I am long ,based on pattern recognition and fundamentals. Risky ,yes, but no risk no reward; besides that is what STOPS are for (even though I only use mental stops ,but don’t sleep much at times like these. Stephen C.
Gold so far at 3:41 pm just dropped to 1214.91 only 10 cents above Alan sell point 1214.81. Then TOS GDX 1 minute fired bullish.
Gold just dropped to 1214.69 at 3:50 pm.
I’m out. Didn’t want to chance it overnight.
Got some good gains from shorting oil. So it compensates. Well, we win some, we lose some. That’s the way the world works.
I just sold when gold dropped below 1214.81. Very minor loss.
Gold and GDX both looking bearish at multiple MACD time frames.
I just bought some GDX at day low at 12:40 pm.
Gold at 12:37 pm dropped to 1214.81 only 17 cents above morning low of 1214.64 at 2:00 am
Richard. I think that is a wise move. That was most likely minuette 2 of minute C in the Main Count.
I am targeting 1237, minuette 3 to take profits off my NUGT, bought at the same time as you.
Thanks Alan, good to know that you bought NUGT at the same time. I figured it was a second wave bottom and a low GDX price so a good time to buy for the likely move up higher. Good to know the 1237 as a possible area to take profits for minuette 3. Nowadays I think it is good to take gold profits at important turning points rather that holding all until a questionable top. Then look for another buying opportunity.
There is only one danger, which I am watching. If the alternate I posted below is correct, this could be the start of the final 5th wave down for Minor C of Intermediate 2. I will have confidence in the up move only when price breaks above 1222.69, the last turning point to the downside. I will bail out once price goes anywhere near to 1214.81.
Alan I will watch 1214.81 for a possible sell.
WHEN IN DOUBT. When in doubt about market direction and Elliot wave analysis is giving mixed signals then look at other methods to figure out which direction the market is headed. There is fundamental analysis and technical analysis. Part of fundamental analysis mustbtake a hard look at the world, or international ,,market conditions as they exist NOW ,in respect to gold ie: potential military/political problems in Syria,Iraq, Ukraine, North Korea, International terrorism etc. (Not Good). Potential distrust of currencies and overprinting of paper money by FED in U.S. and by Draghi in E. U. (Not Good) Election situation in US (very Muddled). Now look at the somewhat esoteric semi-technical indicator of market in respect to similar periods in the past ,in other words Chart Pattern Recognition. This is the probable beginning of a third major cycle in gold ; the first being from 1970 to 1980 , the next from 2001 to 2011, and the third from 2015 to ?? The first cycle up move may be compared to the third cycle up move , and indeed we completed a similar 50% correction from the 2011 high at 1920 to the low last December at 1045. This has been pointed out by other analysts. There are other similarities between 1976 and 1977 and now. Another analyst has proposed that this may be another “stealth” bull market ,where corrections are shallow. Some say the COTS are too high in their short position (but when shorts begin to be covered they are a driving force for a bull market). It is possible (maybe for some not probable) that we are in fact in the beginning phase of a third wave up. The strength in the mining stocks is revealing in this regard, and we are getting past the beginning of Spring and March weakness (March is in fact OVER). I am just having this De je vue feeling that i’ve been here before (which ,of course I have) Just my two cents from a guy who spent 10 years in the precious metal mining business (and who jammed with Elvis when he and I were both 21 years old in Mississippi.
thank you Lara for this extra work
You’re welcome.
Clive Maund sees a move up in the USD and a move down in gold.
http://www.gold-eagle.com/article/canadians-switch-out-canadian-dollars-us-dollars-now
You beat me to this post. Thanks.
Gold may have cup-n-handle pattern also???
If gold breaks above $1235 it is going higher to Lara’s target for wave B.
Hello Lara,
I see a pennant forming from the 11th of February to date. What are your thoughts on this providing support for a breakout to the upside?
Many thanks.
I’m not sure that a pennant is forming. While the shape looks pennant like, it’s not supported by clearly declining volume from back on 11th or 12th of February. The majority of pennants should have notably declining volume.
I think it’s also too long in duration to be a pennant. 5 days to 3-5 weeks is about the range. This one is now 7 weeks duration.
So I’d say it looks more like a triangle than a pennant. Which means the breakout could be either direction.
Lara, just want to say I so appreciate your posting this alternate view. Even though you view it as a low probability I, this seems to fit the weekly momentum imo. And I think the triangle as B wave looks great — because triangles are choppy. Anyway, we’ll see.
Thanks for your diligence.
You’re welcome.
I’m not happy with how that triangle looks. I’ll keep looking for a better alternate.
I did a quick look for an alternate and came out with this. Minor C is an ending expanding diagonal. Please see if it is feasible. This count would lead to a drop targeting 1194, the 0.382 retrace for Intermediate 2. Thanks in advance.
Thanks Alan.
I’ve charted it, and while the subdivisions fit the trend lines really don’t.
Diagonals normally adhere well to their trend lines.
Dammit. I thought that would be a great explanation as it does look like currently a small fourth wave triangle is unfolding sideways.
what if price DOES NOT make a new low below 1,208.33 on Monday and BUT remains below 1,235.16?
Thank you.
Sideways?
Well, it has to break out of that zone sooner or later.
If it’s sideways then maybe for my main count minute b isn’t over and could be continuing sideways as a contracting triangle.
Either way, it will break out of this small zone sooner or later, hopefully sooner.