
Upwards movement was again expected, but this is not what happened.
Price moved lower turning just above the invalidation point.
Summary: Price remains range bound. An upwards swing is most likely from about here. The Elliott wave target is at 1,302.
New updates to this analysis are in bold.
Last published weekly chart is here.
MAIN DAILY ELLIOTT WAVE COUNT
Click chart to enlarge.
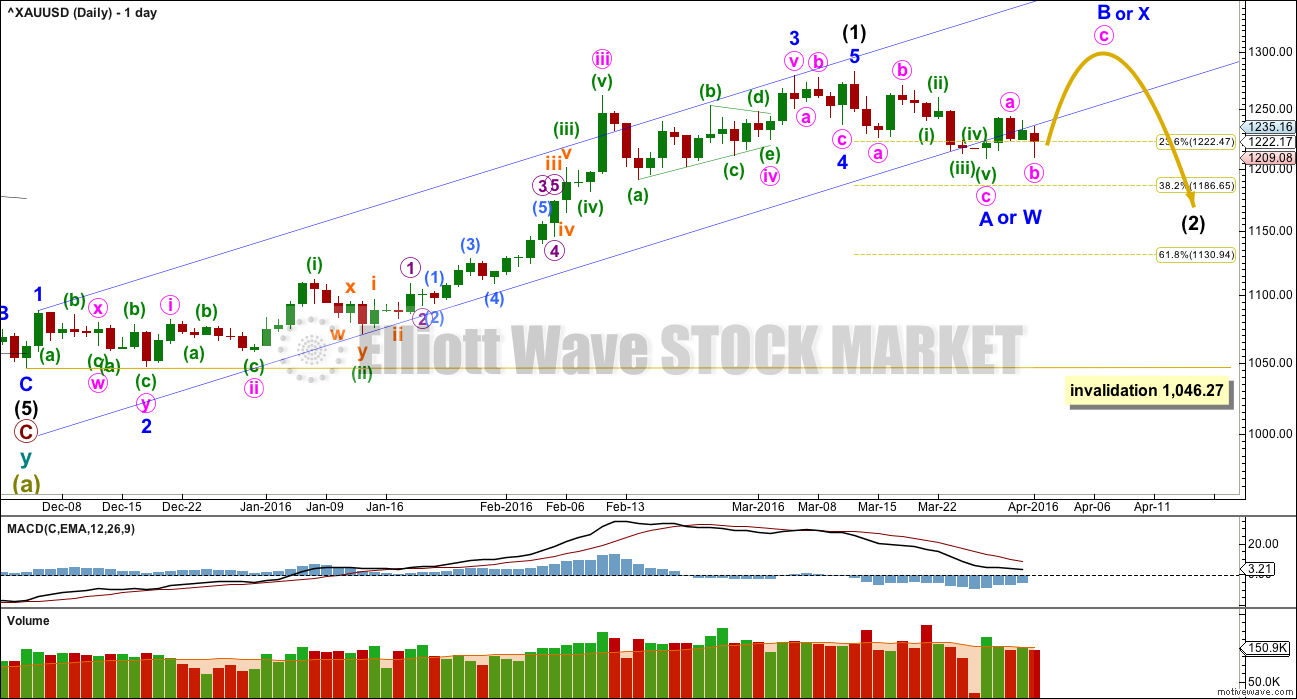
Intermediate wave (1)is a complete impulse. Intermediate wave (2) may have begun. COT supports this wave count; the majority of commercial traders are short (as of 29th March). While this does not pinpoint when price should turn, it does support a larger downwards trend about here.
The first movement down within intermediate wave (2) subdivides as a three, not a five. This indicates intermediate wave (2) is not unfolding as the most common zigzag, so it may be unfolding as a flat, combination or double zigzag. The first three down may be minor wave A of a flat or minor wave W of a double combination or double zigzag.
If the correction up labelled minor wave B or X is shallow, then intermediate wave (2) would most likely be a double zigzag. Double zigzags have a slope against the prior trend; they are not sideways movements. A double zigzag may end close to the 0.618 Fibonacci ratio at 1,131.
If the correction up labelled minor wave B or X is deep and reaches to 1,275.24 or above, then intermediate wave (2) would most likely be a flat or combination. These are both sideways movements. A combination or flat may end closer to the 0.382 Fibonacci ratio at 1,187.
The channel about intermediate wave (1) is today drawn using Elliott’s technique. Upwards movement may find resistance at the lower edge.
This wave count expects the upwards movement to be a counter trend movement. The trend remains down at intermediate wave degree. Minor wave B or X would be likely to look like a three wave structure at the daily chart level.
HOURLY ELLIOTT WAVE COUNT
Click chart to enlarge.
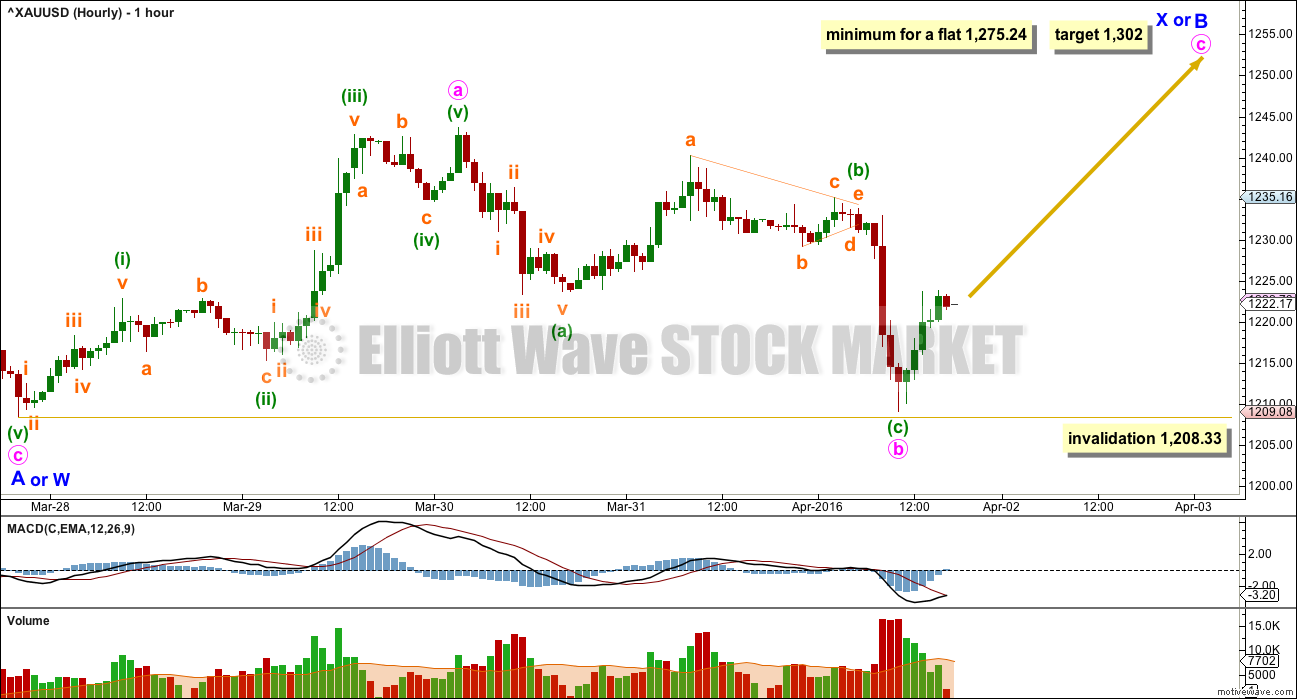
Minor wave A or W subdivides as a 5-3-5 zigzag. This structure is complete.
Minor wave B or X must subdivide as a corrective structure. This may be any one of 23 possible structures. The labelling will change as it unfolds. It is impossible for me to give you a road map for a B wave. They are the most difficult of all Elliott waves to analyse, and usually it is only clear what structure they take at the end. There is too much variety within B waves.
Within minor wave B, so far minute wave a looks best as a five and minute wave b looks best as a three. With a five up and a three down which did not make a new low, this wave count remains essentially the same.
Minute wave c is highly likely to make at least a slight new high above the end of minute wave a at 1,243.69 to avoid a truncation. At 1,302 minute wave c would reach 2.618 the length of minute wave a.
If intermediate wave (2) is unfolding as a flat correction, then within it minor wave B must reach to 0.9 the length of minor wave A at 1,275.24 or above. Minor wave B may make a new high above the start of minor wave A at 1,282.68 as in an expanded flat.
If intermediate wave (2) is unfolding as a double combination, then there is no minimum requirement for minor wave X within it. It must only subdivide as a corrective structure. X waves within combinations are normally deep.
If intermediate wave (2) is unfolding as a double zigzag, then there is no minimum requirement for minor wave X within it; but minor wave X should not be deep, it should be shallow.
ALTERNATE DAILY ELLIOTT WAVE COUNT
Click chart to enlarge.
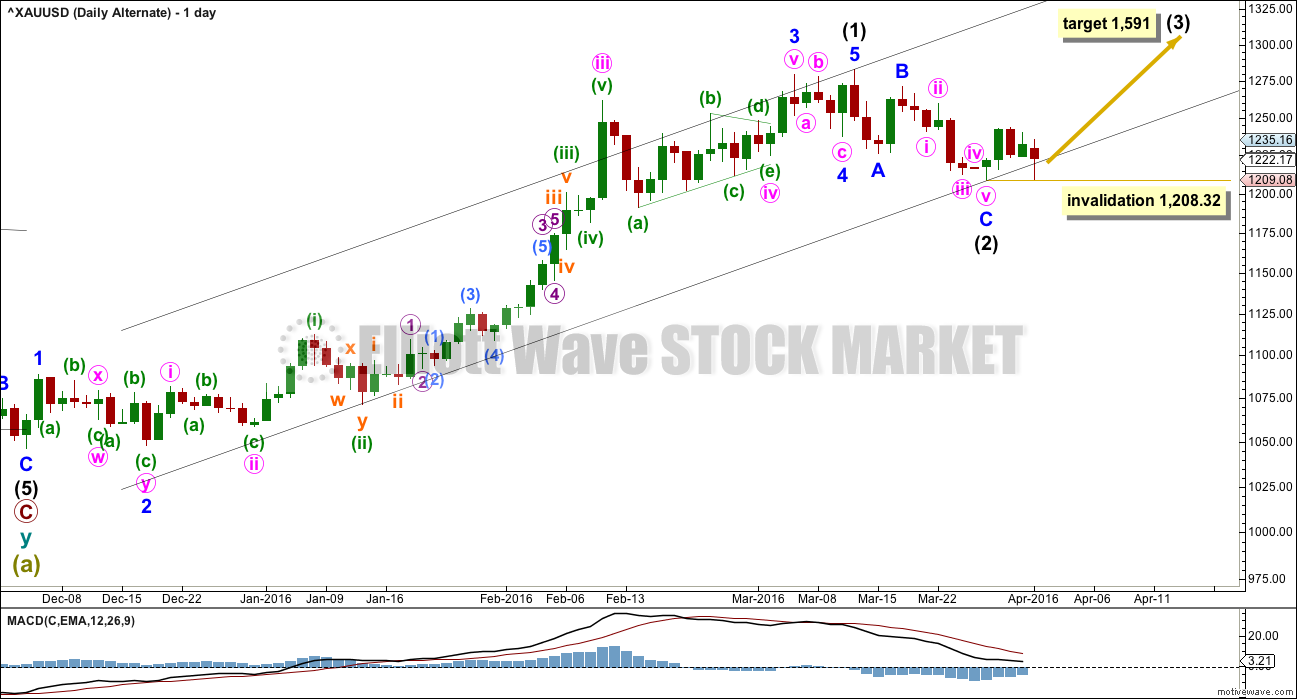
It is technically possible but highly unlikely that intermediate wave (2) is over. This wave count requires confirmation with a five up on the hourly chart for confidence. A new high is not confirmation of this wave count.
If intermediate wave (2) is over, then it is a very brief and shallow 0.31 zigzag lasting only eleven days (intermediate wave (1) lasted 69 days). The probability of this is very low.
At 1,591 intermediate wave (3) would reach 1.618 the length of intermediate wave (1).
Within intermediate wave (3), no second wave correction may move beyond its start below 1,208.32.
I do not want to give too much weight to this alternate by publishing an hourly chart. The subdivisions would be exactly the same as the main hourly chart.
TECHNICAL ANALYSIS
Click chart to enlarge. Chart courtesy of StockCharts.com.
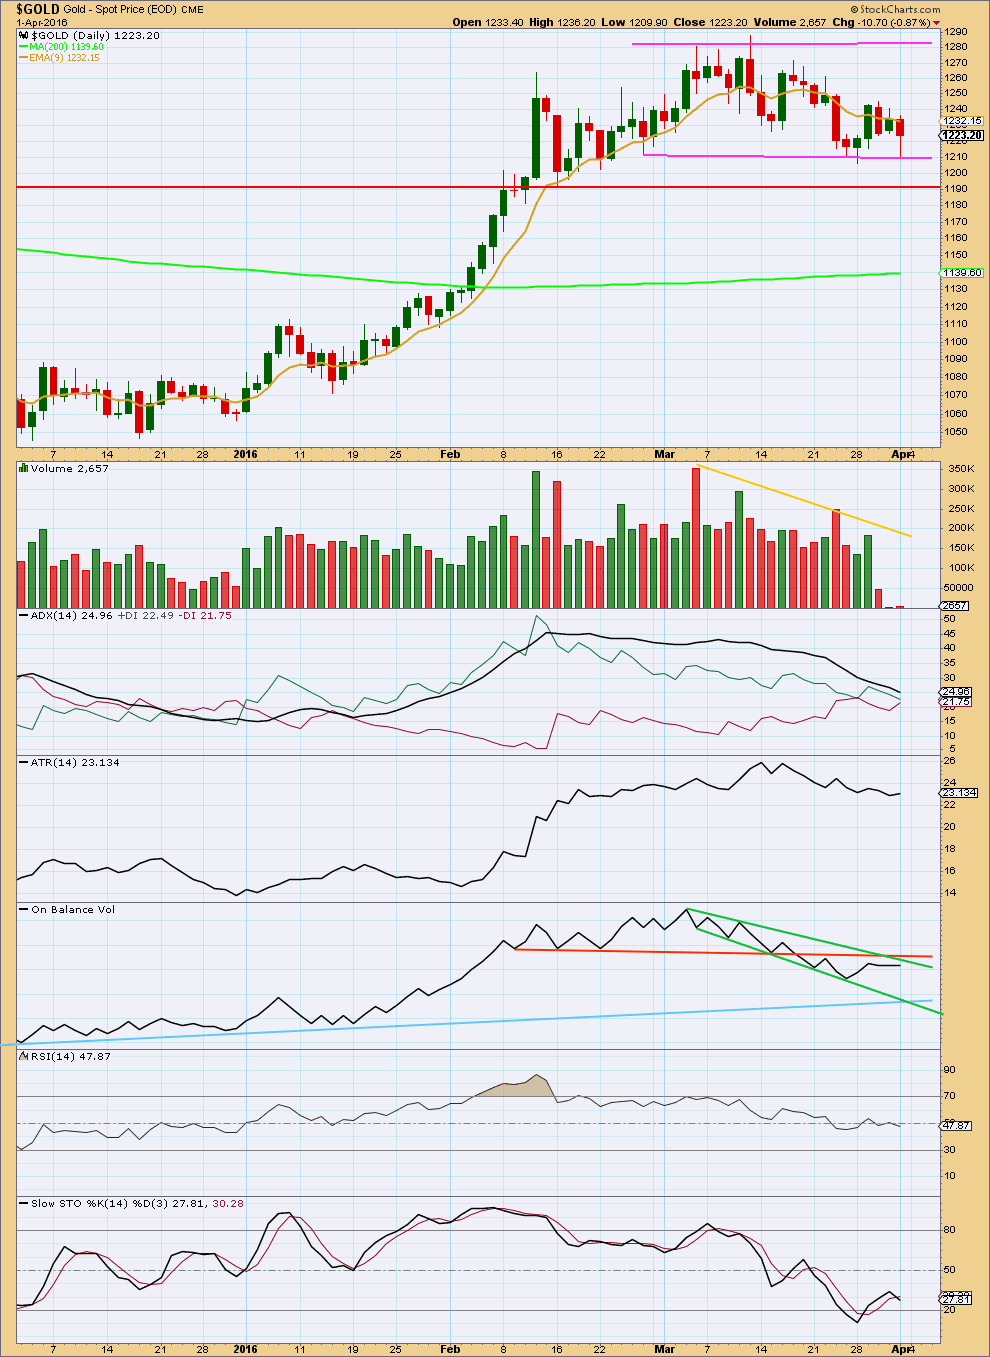
With the last two lows breaking below the prior lower trend line at the lower edge of the consolidation zone, this line was obviously too high and is moved lower. The lower pink trend line has been tested twice now.
Price is range bound between the pink trend lines, moving sideways. The upper edge is about 1,280 and the lower edge is about 1,210. It should be expected that price will swing from resistance to support and back again, eventually breaking out of the range for the next trend. Only experienced traders should attempt to trade this market while price remains range bound. The rest of us should wait for the next trend to emerge and then join it.
Stochastics may be used in conjunction with support and resistance to indicate each swing. At this stage, price has found support and Stochastics is just returning from oversold. An upwards swing should be expected from here until price finds resistance and Stochastics reaches overbought.
Ignoring the Elliott wave count which sees the end of the last wave up on 4th March, it is difficult to accurately state on which day price entered this current sideways trend. It could be as early as 12th February or as late as 14th March. The earlier date seems more reasonable.
If an earlier date is accepted, then during this sideways movement it is a downwards day which has strongest volume. This indicates a downwards breakout is more likely than upwards, which supports the main Elliott wave count.
ADX is declining indicating the market is not trending; it is consolidating. ATR agrees as it too is flat to declining. Overall volume is declining as price moves sideways. All these indicators are in agreement with price: the market is range bound.
RSI is neutral. There is room for price to rise or fall.
This analysis is published @ 11:32 p.m. EST.
i would be surprised if we even go to 1275
goldprice is falling while speculators add more longs. this weakness over the last weeks is very bearish.
the shapr increase by big 4 and 8 over the last weeks also an indicator that price is capped.
we are close to the point where the specs will capitulate.
i would prepare for a big longdrop.
from my perspective still goin long in this situation is suicide.
it s a bit frustrating that there is no alternate count.
does it already have to be a flat or x?
what if we saw a 1-2 1- and 2 developing? not possible?
There is an alternate count. Because members requested it. But now it too points to the same direction short term, up.
If I can see another alternate that says Gold must go down right now then I’ll publish it.
And I have been crystal clear in this analysis. Trading the upside is very risky, because this market is range bound / consolidating.
And from an EW point of view it’s a B wave. Don’t trade B waves.
So I am specifically telling members this market right now is too risky and should only be traded by the most experienced members.
I am specifically not stating anyone should be long here.
Gold’s stocks Spring Rally
As gold stocks’ spring rally soars in May, that is actually the best calendar month of the year for this sector seasonally! May saw average gold-stock gains of 6.9% between 2001 and 2012, exceeding the August, November, and September averages of 6.7%, 6.3%, and 4.8%. Gold stocks enjoy heavy buying in May before their summer doldrums kick in, the seasonal lull in gold-demand spikes in June and July. ….
http://www.321gold.com/editorials/hamilton/hamilton032516.html
Big 3rd wave coming up in april-may, 4th wave in the summer, then huge extended 5th wave starting in the fall. Best time to buy will be in the coming weeks for buy and hold purposes!
I agree. Once in a life time opportunity in PM sector.
Looks like Commercials are not letting up on their short positions. Seems to align well with the main count that Intermediate Wave 2 is not over.
Thanks for the chart. Miss MTSLD’s swaps net short chart.
This is the reason I am not playing the long side. Gold may surprise us to down side. Waiting for int wave complete in seasonal low in April.
Hi Lara,
What consideration would you now give to EWI’s interpretation that we are starting an intermediate wave (B) as part of a primary wave B?
I don’t know what the bigger picture there is, so I don’t know how to fit that idea into the chart. If you know what I mean?
Without a wave count I can’t answer the question.
Hi guys. It’s been a long absence. Hope you still remember me. I went for an eye operation in early December and was given a clean bill of health in March. I couldn’t do any day trading during that period.
What I did was to go for the oil market, which thanks to Lara’s analysis, I had been able to do two intermediate-term trades. Shorted oil in late November with DWTI @ 100+ and took profit in mid-January for a 400% gain. Then long oil with UWTI until mid-March for another 200% gain. At this juncture, oil could be nearing the bottom and I am hesitant to trade it. It could hit the low 20’s again but that’s a big IF. Once it does show momentum to the downside however, I’ll be convinced.
I will now focus on the gold market, and you could hear from me often in this forum. (I also have my eyes on S&P but I reckon the big drop may not come so soon. With the tenacity at which the Fed is molly-cuddling the market, it would take a miracle for the drop to occur. But if it did, TVIX would explode. At just 4+, my money will double when it becomes 8+, treble at 12+. You get the drift).
My thinking about the gold market concurs with Lara’s. There will a short push up followed a sizeable drop in Minor C pretty soon. Many external signs point to that: dollar could reverse pretty soon as it is very near strong support; the big jump in COT shorts in March; renewed interest in stocks due to the Fed chickening out from raising rates. What I fear is that the gold market can bias towards the bear, and maybe even embrace it. But let’s take it one step at a time. I’ll still go long. In fact, I bought NUGT when the gold price reversed off 1208.98 yesterday. My target is 1255, the 0.618 retrace for Minor B. If it gets there and there’s no sign of a slowdown, then I’ll consider the flat pattern. (But if it reaches Lara’s 1302, then Minor C would drop even more because Intermediate 2 becomes an expanded flat).
Good luck everyone, and have a nice weekend.
Good to hear from you again! Your thoughts on the markets have been missed. Look forward to reading many more. Glad to hear you are doing well in health and your trades!
Thanks Dreamer. It’s always good to feel the camaraderie of good friends. You are doing quite well too. I’ve read through some of the past postings in the forum just now and you have acquitted yourself very well.
Great to have you back Tham! We have missed your input for a while.
What you had to go through is a reminder of what we take granted for on a daily basis and instead what we should be thankful for.
Thanks Shahab for your kind words.
Alan- Welcome back. Missed your inputs and ideas on markets. Wish you good recovery from your surgery.
I agree gold still needs to go higher to complete wave B per Lara’s wave count.
In your opinion What is the target for int wave (2)?
Thanks Papudi for your kind words.
It is too early to tell where Intermediate 2 will end. We need to contend with the finish of Minor B first.
If Minor B ends at 1255 thereabouts as I suggested, then Intermediate 2 should end anywhere between 1179 (Minor C = Minor A) and the start of Intermediate 2 at 1046.
If Minor B ends at 1302 as Lara surmised, then Intermediate 2 becomes an expanded flat, and Mnor C could end at either the 1.618 ratio (around 1178) or the 2.618 ratio (around 1102).
Hope this gives a rough idea where we could be heading.
Alan Tham,
Welcome back. Really great to hear from you again. Very wise of you to focus on your eye health and succeed at that. Most important to see clearly in life and especially in trading. I’d thought you went solo and made tons of profits. You did go solo and actually hit the jackpot with your oil profits. I’d like to trade some oil when there is a trend again.
I’m looking forward to some of your intra day insight on gold and miners.
I just bought bought my favorite beer in the world, Mill Street Brewery’s Organic Lager to celebrate the Canadian ‘Junos’ Music Awards on at 7 pm EST tonight. http://junoawards.ca/
I’ll also be giving cheers to you Alan on your clean bill of health on your eyes, your huge jackpots 400% then 200% profits in trading oil the last 5 months, and your return to Lara’s comments section with your insight and counts. Hip, hip, hooray Alan. Cheers buddy. LOL
Thanks Richard. You have always been very kind. I wish you the very best in your trades also. It has been nice talking to you, and I am sure we will have many more such discussions in the future. Cheers.
Welcome back Alan! Happy to hear you have recovered.
Thanks Lara. It is always a pleasure to gain insights from your fabulous and tireless commitment to your work. Keep it up.
Don’t be daunted by the occasional sneers and derision of your wave count. Many do not understand that it is extremely difficult to give paint an accurate picture of very short term price movements. There are just too many possibilities, at least mathematically. But many do realise that we are talking in terms of probabilities, not absolutes. And, I do hope that these sensible folks will be your driving force to excel in the face of fogginess in the way ahead.
Cheers Alan.
Although I do get a little frustrated with some comments from time to time, overall the experienced traders here are adding so much value. I’m learning too.
Hi Alan, welcome back!
Just to be clear on your gold view, you see Lara’s main wave count playing out with a short X wave to 1255 ish followed by another zig-zag to give a double for Int 2. Is this correct?
Thanks
Thanks Johno for your welcome.
That is precisely what I have in mind. It is just that I feel 1302 @ 2.618 retracement is a bit steep. I am going for the conservative 1.00, and play it by ear from there.
THAM !!!! Good To Have You Back!!
Did I miss your statement when you took leave? Because I’d been thinking you had canceled your subscription and weren’t coming back its been so long. Some valued names seemed to have disappeared.
Gosh its good to see you here. And I’m very glad you are recovered from the eye operation.
I decided to try Lara’s S&P while you were gone. I’ve only done one trade there, very successful, but, 7 out of my 8 trades since you were gone are winners. (I’m gettin better!)
Nothing compared to the masters here of course.
Look forward to our chats in the future. Welcome back. 🙂
Thanks dsprospering for your very warm welcome.
I have not been able to leave a note that I will be away for some time. It was an abrupt decision to have the operation.
I’m so glad that you are getting better at trading. S&P is currently a very difficult market to trade. Like I said, I am sitting on the sidelines until the smoke clears. There is too much manipulation by the Fed. Every time price looks set to fall, some soothing dovish remarks will be made and the artificial life support will again kick in. But if you must trade, I will suggest very small bites of the cherry. Just go with the flow. Follow the most recent intra-day trend and use tight stops. Exit at the end of the day latest.
It will be very pleasant to have further chats with you again, in the days to come.
Great analysis Lara. Both your main count and your alternate really help explain something that I was puzzled about in a few of the miners that I trade, in which I have been expecting (and hoping for) a big correction. Instead, what I am seeing is compelling indication of a fourth wave developing, with a fifth wave on deck. A big imminent B wave in gold explains that very nicely.
Conversely, I’ve noticed over the years that action in the miners often anticipates movement in gold, so what I am seeing I think helps confirm your analysis.