
Downwards movement was expected from the main Elliott wave count.
Summary: A new low below 1,223.77 would provide strong confirmation for the main wave count as both alternates would then be invalidated. A new high above 1,262.47 would confirm the alternate hourly wave count which expects more sideways movement before an upwards breakout. The alternate daily, which expects a big third wave up is just beginning, remains valid but still has a low probability. The bottom line: Gold is still range bound; there has still not been a breakout. There are multiple Elliott wave corrective structures which may be unfolding at this time. It is impossible to tell with certainty which one will complete, so it is best to avoid trading this market at this time when price is range bound and the Elliott wave picture uncertain.
New updates to this analysis are in bold.
Last published weekly chart is here.
MAIN DAILY ELLIOTT WAVE COUNT
Click chart to enlarge.
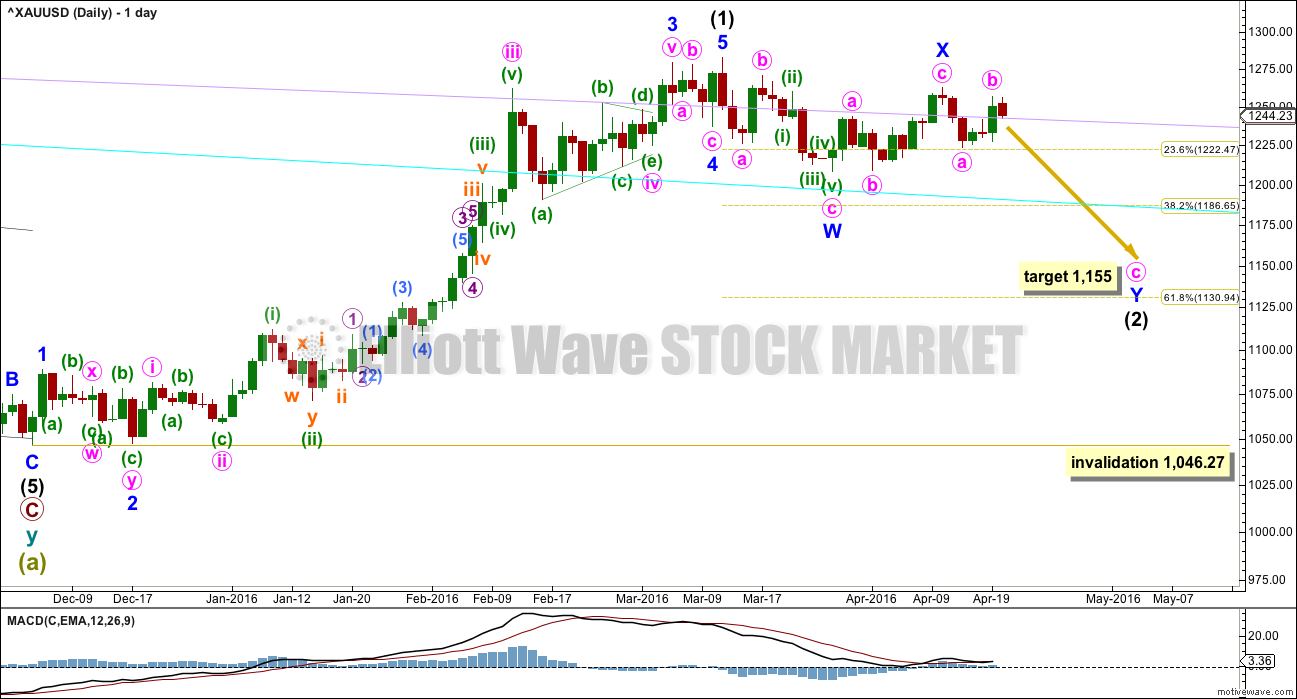
Intermediate wave (1) is a complete impulse. Intermediate wave (2) has begun and is most likely incomplete.
The first movement down within intermediate wave (2) fits as a zigzag.
At this stage, it looks like intermediate wave (2) may be unfolding as a double zigzag. Minor wave X may be a zigzag within the double.
Within double zigzags, the second zigzag exists to deepen the correction when the first zigzag does not move price deep enough. Here, minor wave W ends just below the 0.236 Fibonacci ratio fitting the description of “not deep enough” for a second wave correction. The second zigzag in the double should be expected to deepen the correction; minor wave Y may end about the 0.618 Fibonacci ratio at 1,131.
To achieve the purpose for the second zigzag to deepen the correction the X waves of double zigzags are normally shallow. Here, minor wave X is a 0.73 length of minor wave Y which is not shallow. For this reason, a combination is considered in the alternate hourly wave count. It is still more likely that intermediate wave (2) will be a double zigzag so that it is deeper.
Intermediate wave (2) may be still be a flat correction although today this looks extremely unlikely. If upwards movement continues to 1,275.24. At that stage, upwards movement would be 0.9 of the prior zigzag down, so the structure may be relabelled minor waves A-B with C down to unfold. Within flat corrections, the B wave is most commonly from 1 to 1.38 times the length of the A wave, so this gives a normal range for minor wave B of 1,282.68 to 1,311. There is a risk that upwards movement is not over while price remains above 1,223.77.
A new high does not invalidate this main wave count. The most common type of flat is an expanded flat which would require wave B to be 1.05 of wave A or longer. The price point for this would be at 1,286.40.
There is no rule stating a limit for a B wave within a flat nor an X wave within a combination. There is an Elliott wave convention that states when the possible B wave is twice the length of the A wave the probability of a flat unfolding is so low it should be discarded. That price point is at 1,357.04.
This is still the risk to the wave count today.
Intermediate wave (2) may not move beyond the start of intermediate wave (1) below 1,046.27.
The lilac and cyan trend lines are copied over from the weekly chart (both weekly and daily charts are on a semi log scale). Upwards movement has closed above the lilac line and is today finding support there. If it breaks below the line, then it should find resistance.
MAIN HOURLY ELLIOTT WAVE COUNT
Click chart to enlarge.
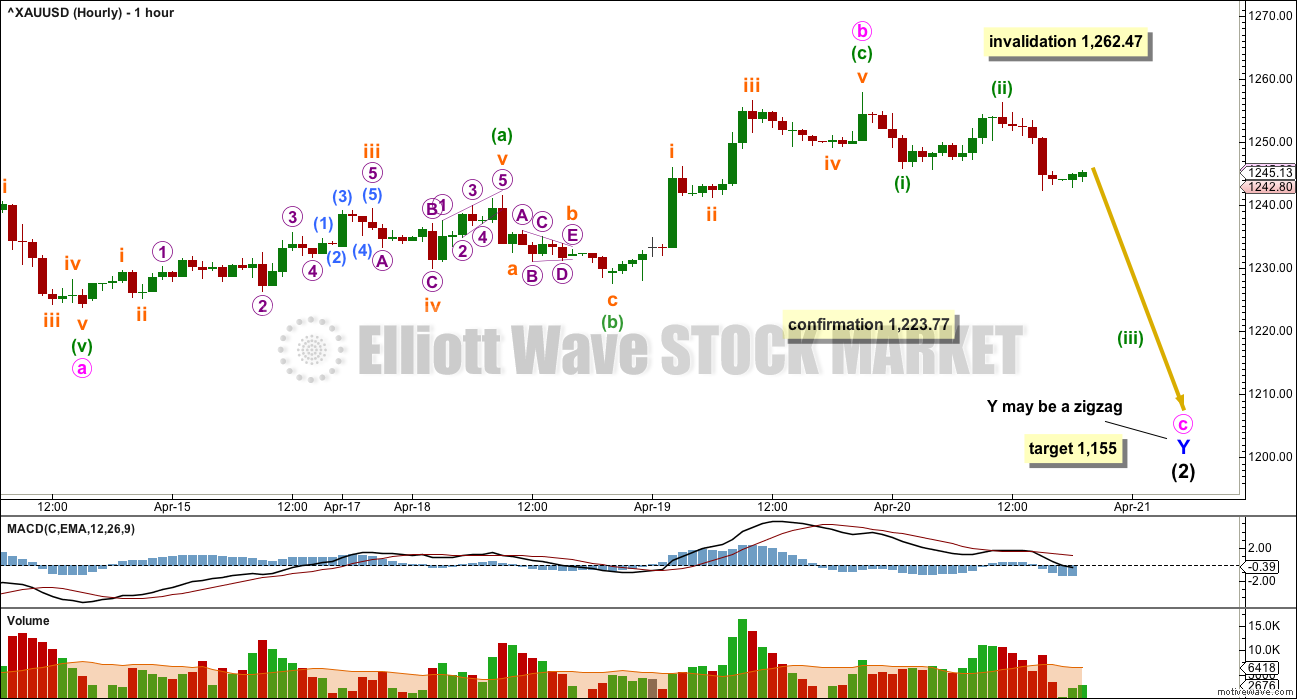
This first hourly chart looks at intermediate wave (2) still as a double zigzag. This structure would allow intermediate wave (2) to move substantially lower and be a more normal deeper second wave correction.
Within the second zigzag of minor wave Y, minute wave a is seen as a five wave structure. This downwards wave will subdivide as either a five wave impulse or a three wave zigzag (alternate hourly chart), so both options must be considered.
If minor wave Y is to be a zigzag, then within it minute wave a must be a five wave structure. Minute wave b must be a corrective structure and may not move beyond the start of minute wave at above 1,262.47.
At 1,155 minute wave c would reach 2.618 the length of minute wave a. If this target is wrong for this wave count, then it may not be low enough.
Along the way down, a new low below 1,223.77 would at this stage invalidate the alternate hourly wave count and the alternate daily wave counts below. This would provide confirmation of this main wave count and confidence in the expected direction and the target.
ALTERNATE HOURLY ELLIOTT WAVE COUNT
Click chart to enlarge.
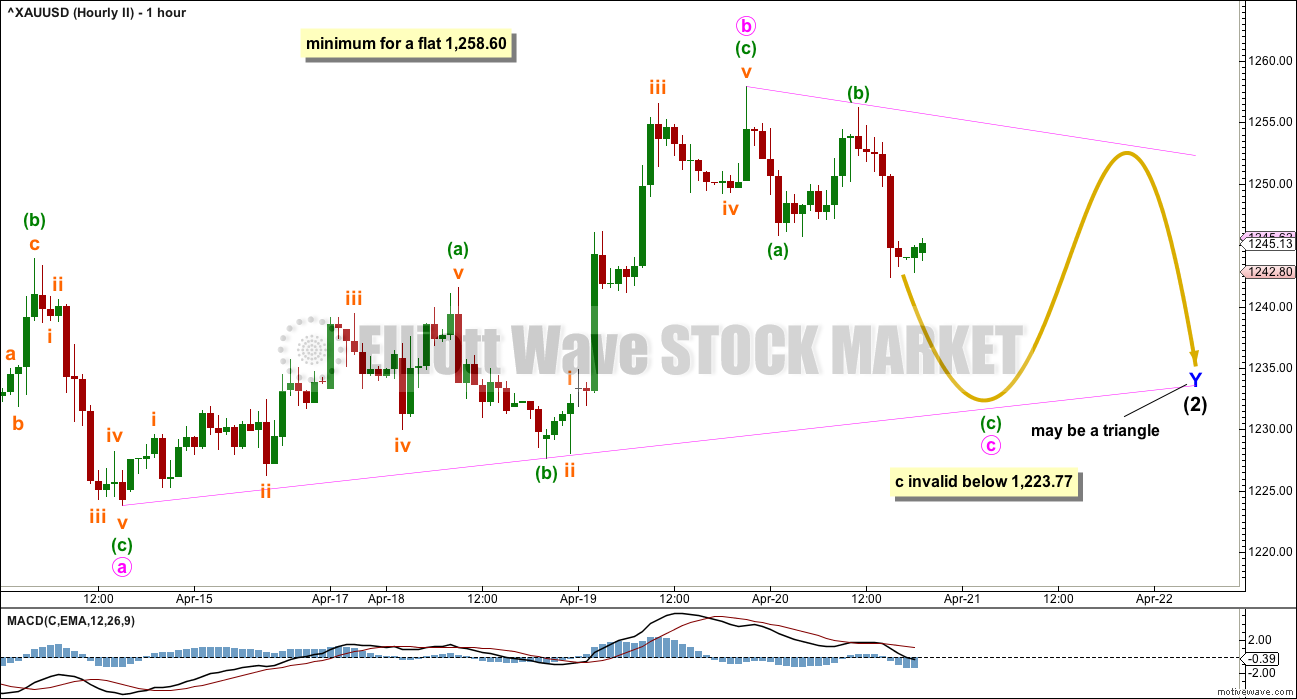
Intermediate wave (2) may be a double combination. The first structure in the double was a zigzag labelled minor wave W. The double is joined by a three in the opposite direction, a zigzag labelled minor wave X. The second structure in a combination may be either a flat correction or a triangle labelled minor wave Y.
Within both a flat or triangle, minute wave a must be a three wave structure. Minute wave a is seen here as a zigzag.
If minor wove Y is to be a flat correction, then within it minute wave b must correct a 0.9 length of minute wave a, so it must end at or above 1,258.60. At this stage, this price point has not quite been met. It remains possible that minute b could move higher as a double zigzag to reach 1,258.60 or above though, so a flat is still possible for minor wave Y.
If minor wave Y is to be a flat correction, then the normal length for minute wave b within it would be 1 to 1.38 the length of minute wave a, between 1,262.47 and 1,277.17. There is no rule stating a maximum limit for a B wave within a flat, but there is a convention that states when the potential B wave is more than twice the length of the A wave the probability of a flat is so low it should be discarded. This price point would be at 1,301.16.
If minor wave Y is to be a triangle, there is no minimum (nor maximum) for minute wave b within it. The only requirement for minute wave b of a triangle is it must be a corrective structure. If minor wave Y is a triangle as labelled today, then within it minute wave b may now be a complete zigzag. Minute wave c downwards should unfold as a corrective structure and may not move beyond the end of minute wave a below 1,223.77. If this price point is passed prior to a new high above 1,258.60, then this alternate wave count would be invalidated.
The only reason why this alternate has a lower probability than the main wave count is it would see intermediate wave (2) at its end a very shallow correction, falling short of the 0.382 Fibonacci ratio of intermediate wave (1). This is possible but must be judged to have a lower probability than a deeper second wave for intermediate wave (2).
ALTERNATE DAILY ELLIOTT WAVE COUNT
Click chart to enlarge.
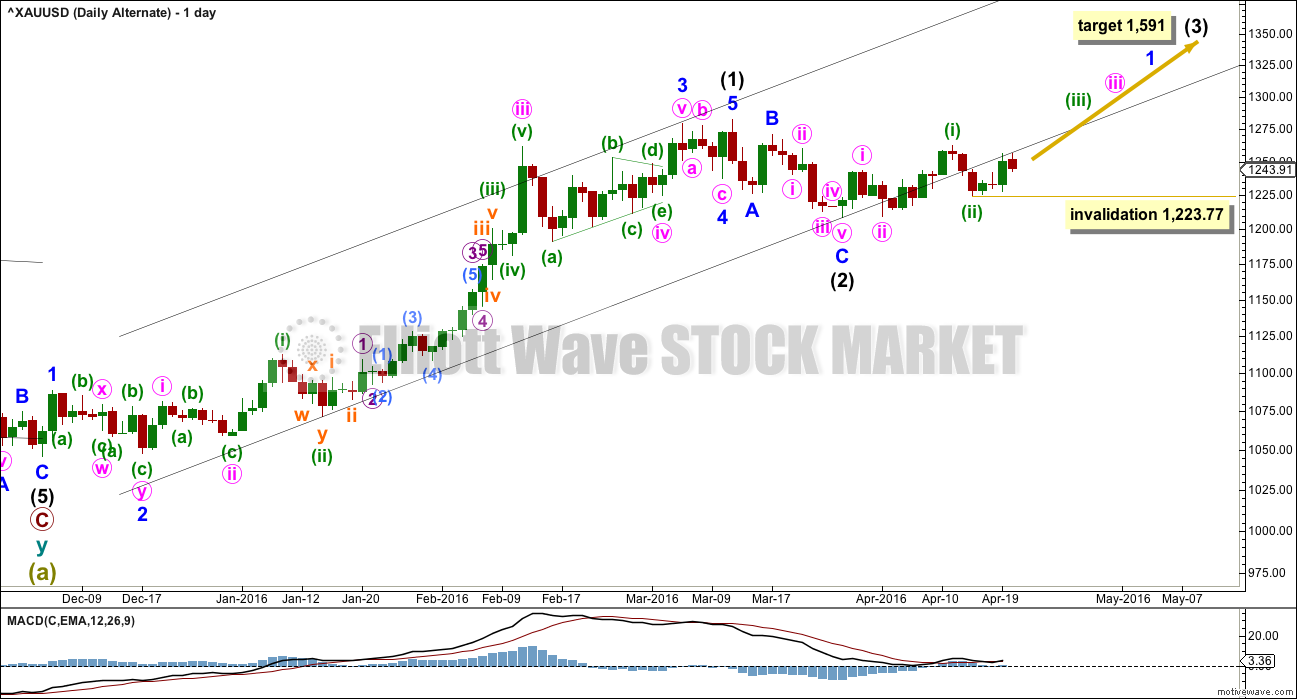
It is technically possible but highly unlikely that intermediate wave (2) is over. This wave count requires confirmation with a five up on the hourly chart for confidence. A new high is not confirmation of this wave count. If price exhibits a classic breakout, a strong upwards day closing comfortably above 1,282.68 on high volume, then this wave count would increase in probability and should be used.
If intermediate wave (2) is over, then it is a very brief and shallow 0.31 zigzag lasting only eleven days (intermediate wave (1) lasted 69 days). The probability of this is very low.
At 1,591 intermediate wave (3) would reach 1.618 the length of intermediate wave (1).
Minuette wave (ii) may not move beyond the start of minuette wave (i) at 1,209.08.
The best fit black channel about this upwards movement contains all except the end of minute wave iii within intermediate wave (1). It is very common for the ends of third waves to overshoot channels as they are the strongest movement within a trend.
It is indicative that the lower edge of this channel is now being breached. If a big third wave up has begun, price should be finding support at the lower trend line. For this reason with now two full daily candlesticks below the line the probability of this alternate wave count at this stage is reduced.
TECHNICAL ANALYSIS
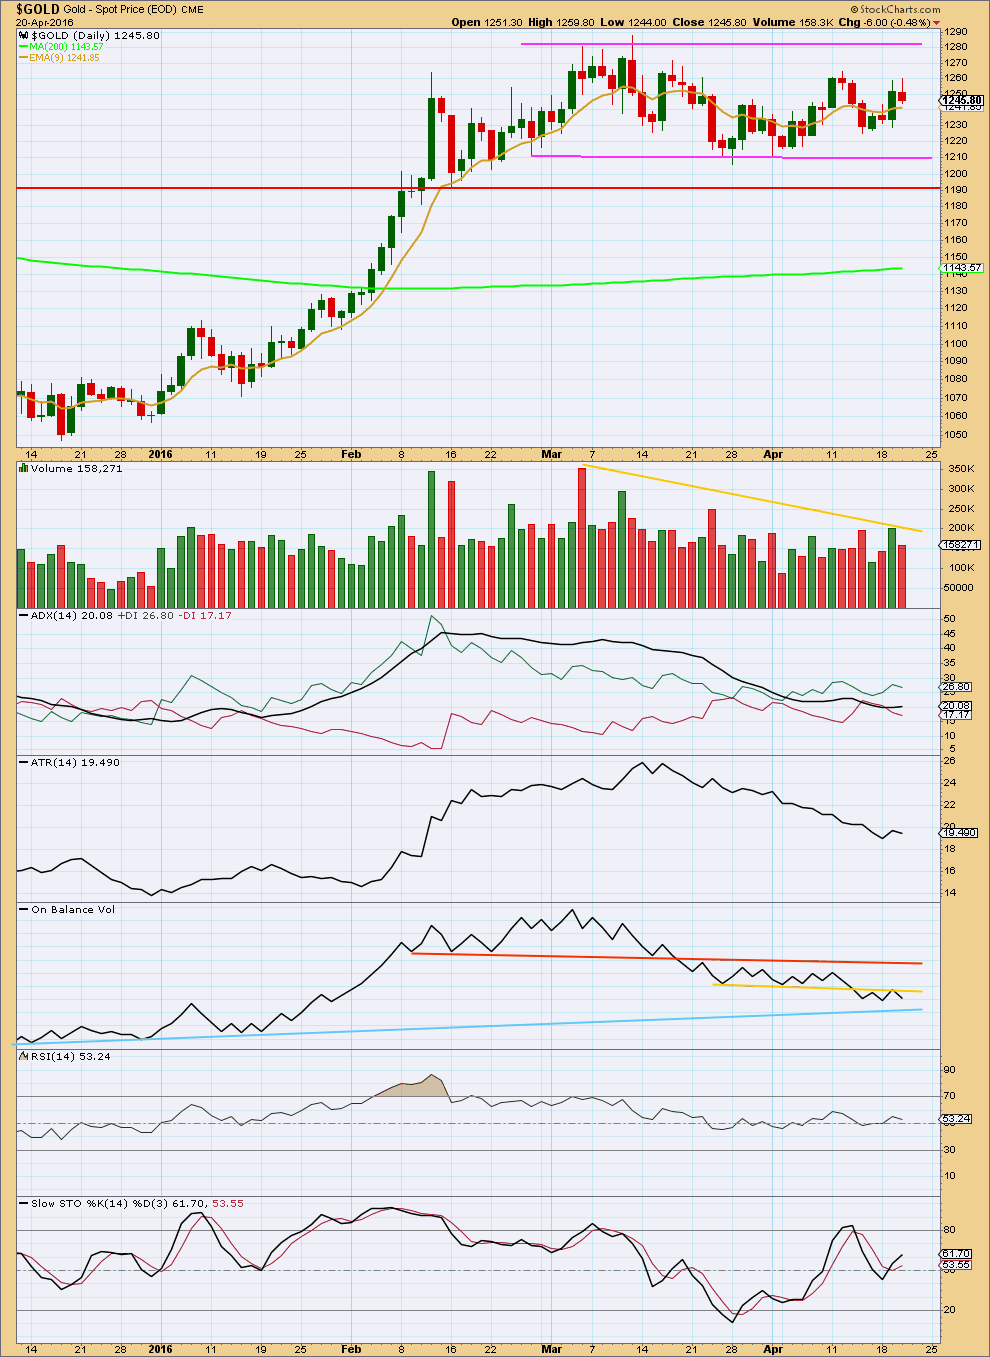
Click chart to enlarge. Chart courtesy of StockCharts.com.
In the short term, the volume profile looks like a little more upwards movement at least may unfold. The upwards day of 19th April shows an increase in volume; the rise in price was supported by volume. The next small downwards day now shows a decrease in volume indicating it is more likely a small counter trend movement.
Price is still range bound between resistance about 1,280 and support about 1,210. A breakout is required for confidence in the resumption of a trend. A breakout would be supported by a day with higher volume, but for a downwards breakout this is not necessary. The market can fall of its own weight.
It is still a downwards day which has strongest volume during this sideways movement. This trick usually is fairly reliable for Gold, which indicates a downwards breakout is more likely than upwards.
ADX today is slightly increasing and is above 15. This may be the earliest indication of a new trend beginning. The trend would be upwards because the +DX line is above the -DX line.
ATR is declining today which puts some doubt on an upwards trend being in place. For confidence both ADX and ATR should be in agreement. At this stage, ATR is flat and may be overall still declining.
On Balance Volume is my favourite early indicator. When used with trend lines, OBV will often breakout and show the direction for price before price breaks out. OBV today is giving a reasonable bearish signal with a break below the yellow line. The yellow line on OBV today has been tested and held again. This line has now been tested four times. With OBV moving lower away from the yellow line, this is a reasonable bearish signal. The signal is now reasonable because the line has been tested four times and is horizontal, but not strong because the line is not very long held. A break below the blue line would provide strong confidence in the main Elliott wave count which expects price to move strongly lower.
RSI is neutral. There is room for price to rise or fall.
Stochastics is neutral. There is room for price to rise or fall.
Trading a range bound market is much more risky than trading a clearly trending market. If you are not a very experienced trader, then it is the trades you don’t take and the times of uncertainty in the market that you do not enter which will reduce risk and preserve your account. This membership has a wide range of market experience. If there is one lesson I could give, which would be the most valuable to new traders, it would be to manage risk.
This analysis is published @ 08:54 p.m. EST.
If this is an expanded flat I have a target at 1,207 for minute c = 1.618 X minute a
Gold marks first decline in five sessions
Apr 21, 2016 3:13 p.m. ET
http://www.marketwatch.com/story/gold-silver-reverse-course-retreat-after-multisession-gains-2016-04-21
As main hour got invalidated…the targets below 1200 no more exists..??
Can we see todays high as X…is there a possiblilty of that lara..??
Incorrect the main DAILY is still valid with target below 1200.
Only main hourly invalidated.
Alan thanks for the retrace target.
“SM2 should target 1241.65, the 0.618 retrace.”
Daniel thanks also.
“61.8 retracement would target just over 1240.”
Move to 1272 should indicate more sideways movement before an UPSIDE breakout . My prior studies in “Risk analysis of Oil and Gas exploration ” as applied to probability of gold moving to the upside is telling me that probability of upside is greater than downside move from here. Stephen C. New London ,CT. USA. IMHO
As Alan said, the main hourly wave count is invalidated.
The alternate hourly now looks at minor Y not as a triangle, but a flat. And it would be an expanded flat.
But the bottom line for Gold is it’s still range bound. There has been no breakout.
I can still see multiple structural options, not just the alternate published here.
It could be the daily alternate as well; intermediate (3) up may be beginning. I still would judge that to have a lower probability due not only to the brevity of intermediate (2) and the shallow depth, but the choppy overlapping nature of the start of intermediate (3). It’s breaching the channel and it’s too hesitant for confidence in the idea.
Still more likely intermediate (2) is some kind of combination or flat. I can see at least two more ideas to chart and publish today.
Gold just dropped $11 in 4 minutes from 1270 to 1259 at 9:19 am EST
Gold jumped on this 8:00 am news.
European stocks lower as Draghi ‘s ECB stands pat on interest rates-
Apr 21, 2016 8:05 a.m. ET
http://www.marketwatch.com/story/european-stocks-wobble-ahead-of-ecb-meeting-2016-04-21
DUST may therefore be a good buy right now for a trade.. Would not be surprised to see finish in green today after yesterdays reversal candle stick.
In addition premarket has not taken out yesterdays low of 1.76.
Daniel that was a precise timing DUST buy call as it was at 1.80 then.
Pre-market low was 1.77. Wednesday low was 1.76. DUST moved up to 1.98 at 10:00 am it’s high today.
Bob Hoye’s Momentum Peak Forecaster has been fairly accurate pin pointing the top in speculation. It was right on money for gold tops in 1979 , 1987, 1998, 2004, 2006 and 2011.
A good read.
Sorry I forgot to include the link :
http://www.321gold.com/editorials/hoye/hoye042016.pdf
With price movement above 1258.60, the main hourly is invalidated. Instead the alternate hourly continues with Minute B as a double zigzag, and Minor Y as a flat, although it is too early to tell whether it is a regular flat or an expanded flat.
The daily alternate is still in play. From my calculations, we are now completing the fifth wave of subminuette 1 of minuette 3.
Both wave counts expect a drop once a high arrives. The alternate hourly targets at least 1223. The alternate daily targets around 1239.
Alan
Thanks for the post. Main alternate invalidation is at 1262.47 per the main hourly chart. Why you are convinced it is invalidated???
What is your view on US Oil wave count??? When this will turn down ???
US president and King meeting ??????
Papurdi
Alan said, ” the main hourly is invalidated.” He didn’t say that about the hourly alternate.
Thanks Richard for the clarification. Technically, the main count is not invalidated. It is just it or the hourly alternate. They cannot both coexist. But since the alternate considers Minute B as completed, it is running into trouble again and again. And unfolding prices are now heavily stacked against a completed B wave.
Hi Papudi. Sorry for the delay as I took a nap before the market begins. I would be scrutinising S&P for signs of a possible top. That would be the most lucrative market to be in for a while.
I think the gold market has answered your question: the rise to 1270.36, and not stopping as yet. For the alternate hourly, an expanded flat is indicated. If it is the correct count, the drop can be significant.
I am still long crude oil. I expect the B wave to be an expanded flat targeting at least 46.45 at a conservative 1.236 retrace (based on FXCM feed, not StockCharts. The two feeds have widely different values). Like gold, the C wave to follow an expanded flat is highly tradeable.
I agree and favor Intermediate 2 as completed and now finishing final fifth wave up of alternate daily. 61.8 retracement would target just over 1240.
Alan, thanks for noting we are in a Flat correction, Minor Y (hrly alternate). Your post was good timing for me. Do you think this a.m. high of 1270.36 is the end of upward movement? Do you have an updated wave count?
Hi dsprospering.
I am still flummoxed by the alternate hourly. Minute C has to drop quite significantly to reach 1155, something like a 2.618 retrace. I’ll have to let price move somewhat, or Lara to say a bit more (she says she’ll be watching the markets today), to be able to get a count.
The alternate daily is more amenable to a count. Minuette 3 began at 1223.91, SM1 at 1270.36, which means SM2 should target 1241.65, the 0.618 retrace. In any case, it is invalidated at 1223.91 (Lara’s 1223.77). So, it should clarify itself quite soon.
I am not too comfortable trading this drop. The larger trend is still up. My strategy is to watch 1223.91. If it drops below that, invalidating the alternate daily, then I will short on the rise after that. Even then, I will be very cautious.
Lara- MACD was over bought and now it has relieved the condition by moving sideways.
MACD now on the rise from below.
That means a break out to upside??????
AFAIK MACD doesn’t signal overbought / oversold. It signals momentum.
It’s not bound.
And returning from positive to neutral doesn’t signal a breakout in any particular direction.