
A new high above 1,262.47 invalidated the main hourly Elliott wave count and confirmed the alternate.
I have three Elliott wave counts for you today.
Summary: Gold is still range bound. There are still at least two valid wave counts for this correction and they encompass four possible structures which may unfold over the next week. This means that short term price swings within the consolidation will be impossible to accurately predict. The safest approach to a range bound market is to wait for a breakout and the resumption of a trend before joining the trend.
New updates to this analysis are in bold.
Last published weekly chart is here.
FIRST DAILY ELLIOTT WAVE COUNT
Click chart to enlarge.
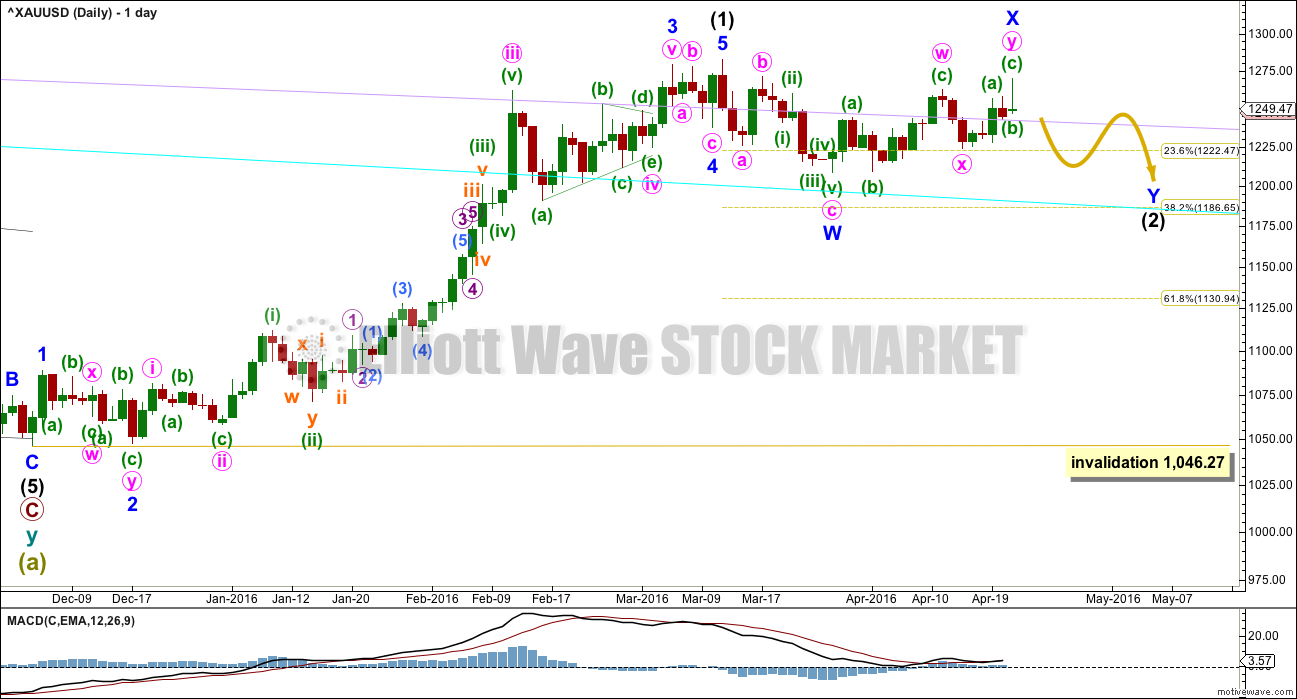
Intermediate wave (1) is a complete impulse. Intermediate wave (2) has begun and is most likely incomplete.
The first movement down within intermediate wave (2) fits as a zigzag.
Upwards movement labelled minor wave X may be a complete double zigzag. Subwaves W, Y and Z within multiples may only be single corrections. The maximum number of corrective structures within a multiple is three. To label W, Y and Z multiples themselves increases the maximum beyond three and violates the rule. But X waves are movements in the opposite direction and are not included in the count of the number of corrective structures, so they may take any corrective form.
Occasionally X waves subdivide as multiples themselves. This may have happened here. All possibilities should be considered.
Minor wave X is a 0.83 length of minor wave W. This may not be a B wave within a flat correction for intermediate wave (2) because it falls short of 0.9 the length of the the first zigzag down labelled minor wave W.
Intermediate wave (2) may be unfolding as a double combination or double zigzag. Because minor wave X is relatively deep, a double combination would be more likely now. Double zigzags more commonly have shallow (and relatively brief) X waves than this one.
If intermediate wave (2) is a double zigzag, then minor wave Y downwards must be a zigzag and must deepen the correction so that the structure has a downwards slope. The most likely point for this to end would be about the 0.618 Fibonacci ratio of intermediate wave (1) at 1,131. This scenario is still possible but today has reduced in probability due to the depth and duration of minor wave X.
If intermediate wave (2) is a double combination, then the first structure in the double is a zigzag labelled minor wave W. The double is joined by a three in the opposite direction, a double zigzag labelled minor wave X. The second structure in the double may be either a flat or triangle labelled minor wave Y. It would most likely end close to the same level as minor wave W at 1,208 so that the whole structure moves sideways. This is now more likely.
Intermediate wave (2) may not move beyond the start of intermediate wave (1) below 1,046.27.
FIRST HOURLY ELLIOTT WAVE COUNT
Click chart to enlarge.
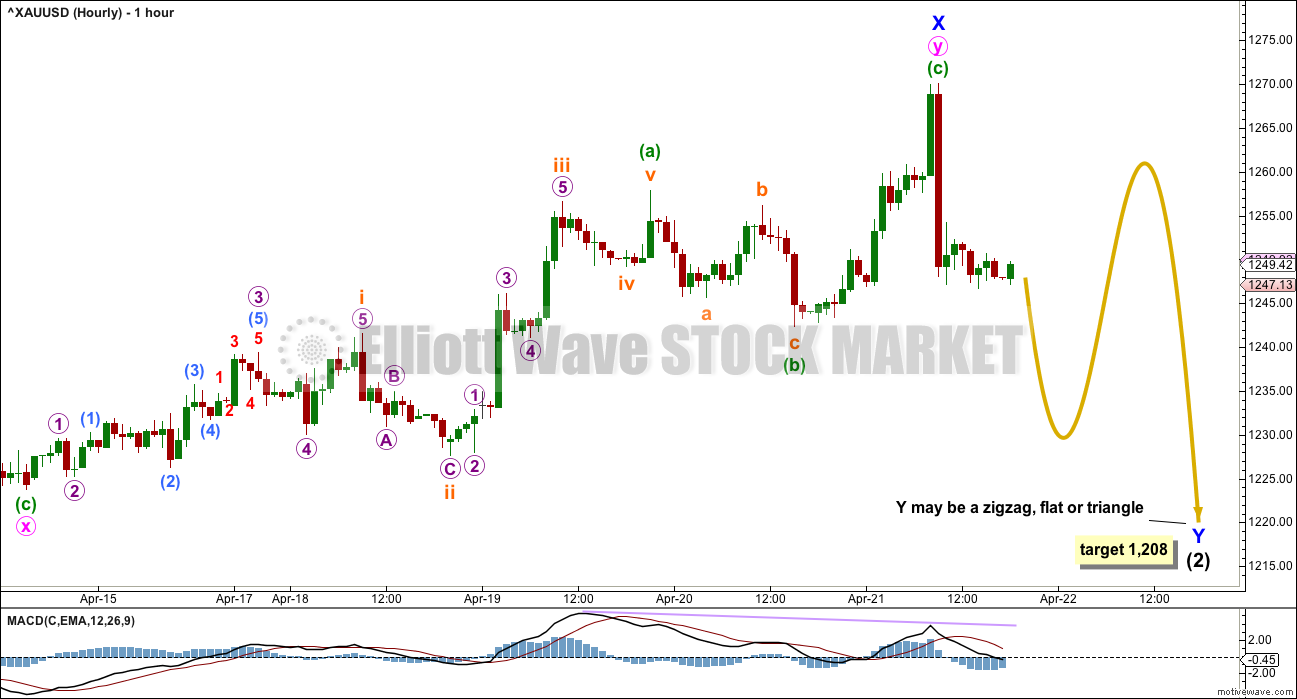
Minor wave Y may be a zigzag if intermediate wave (2) is a double zigzag. Within the zigzag, no second wave nor B wave may move beyond its start above 1,270.08. A new high above this point at any stage would invalidate the idea of a double zigzag.
Minor wave Y is more likely to be a flat or triangle to complete a double combination for intermediate wave (2). Within an expanded flat or running triangle, the B wave may move beyond the start of the A wave which here would begin at 1,270.08. A new high above 1,270.08 may be part of minor wave Y for this wave count and would not invalidate this wave count at this stage.
A flat or triangle for minor wave Y would most likely end about 1,208, so that it ends close to the end of minor wave W.
Both flats and triangles are essentially sideways structures as are double combinations. The purpose of combinations is to take up time. They test our patience.
SECOND DAILY ELLIOTT WAVE COUNT
Click chart to enlarge.
I am labelling these wave counts “one” and “two” rather than main and alternate because it is my judgement that they have a close to even probability.
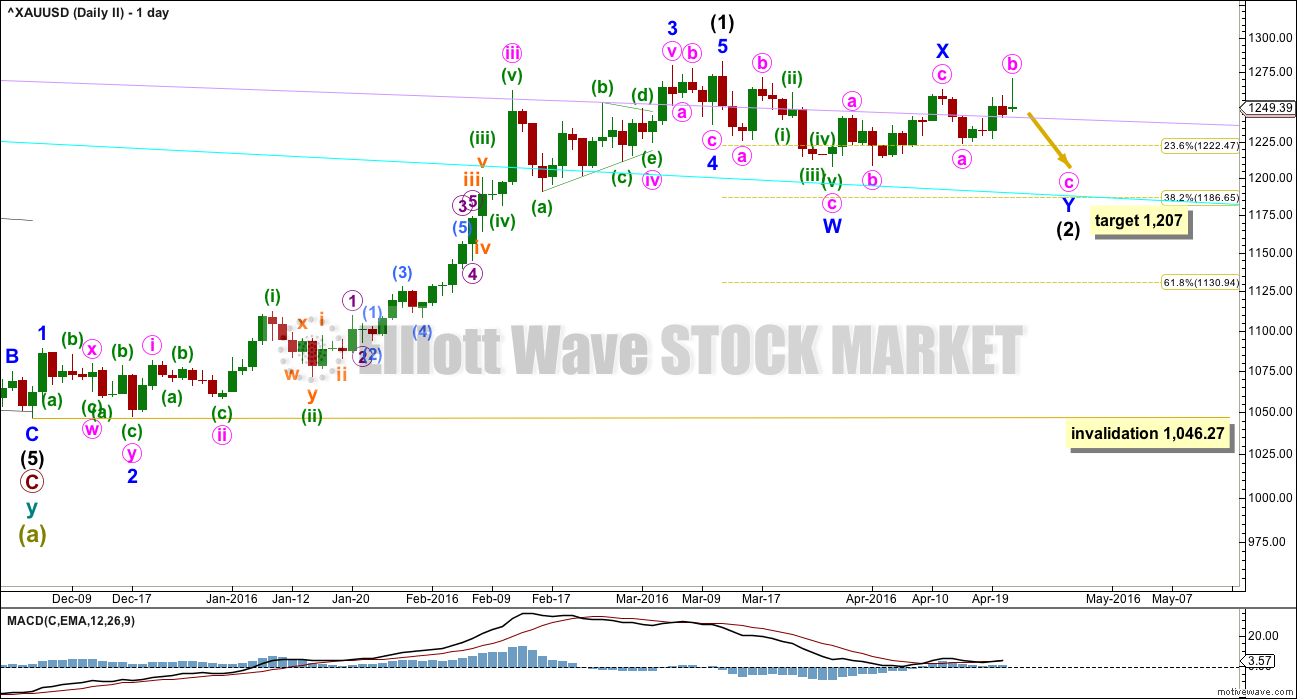
Intermediate wave (2) may be a double combination with minor wave X ending earlier as labelled.
Minor wave W is a zigzag, the first structure in a double. The two structures in the double may be joined by a simple zigzag for minor wave X in the opposite direction.
Minor wave Y may be underway as an expanded flat correction.
At 1,207 minute wave c would reach 1.618 the length of minute wave a within the expanded flat of minor wave Y. This target would see minor wave Y end very close to the end of minor wave W. The whole structure for intermediate wave (2) would have a sideways look, typical of a combination.
Minute wave c downwards must subdivide as a five wave structure.
SECOND HOURLY ELLIOTT WAVE COUNT
Click chart to enlarge.
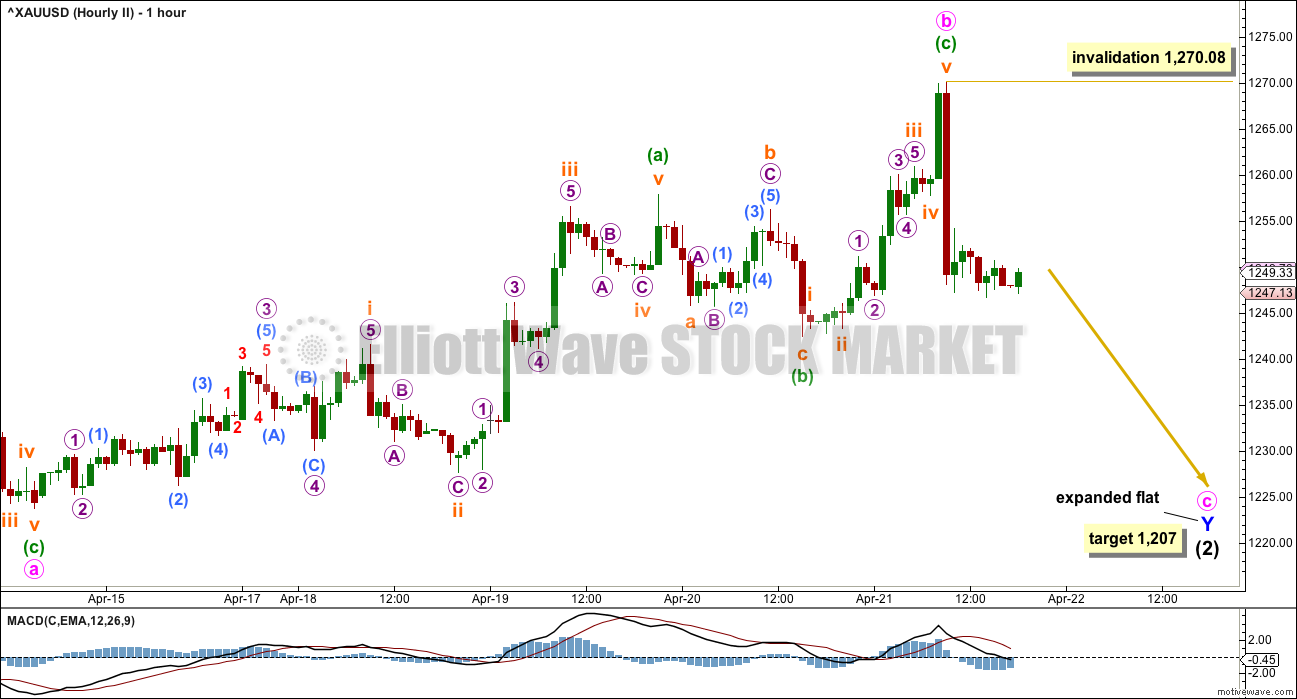
This wave count now expects a quicker end to the correction for intermediate wave (2).
Within the flat correction for minor wave Y, minute wave b is a 1.20 length of minute wave a. This is within the normal range for a B wave within a flat of 1 to 1.38.
At 1,207 minute wave c would reach 1.618 the length of minute wave a.
Minute wave c must subdivide as a five wave structure, either an impulse or an ending diagonal. An impulse would be quicker. A diagonal would be more time consuming. Within both an impulse or diagonal, the second wave correction to come may not move beyond the start of the first wave above 1,270.08.
ALTERNATE DAILY ELLIOTT WAVE COUNT
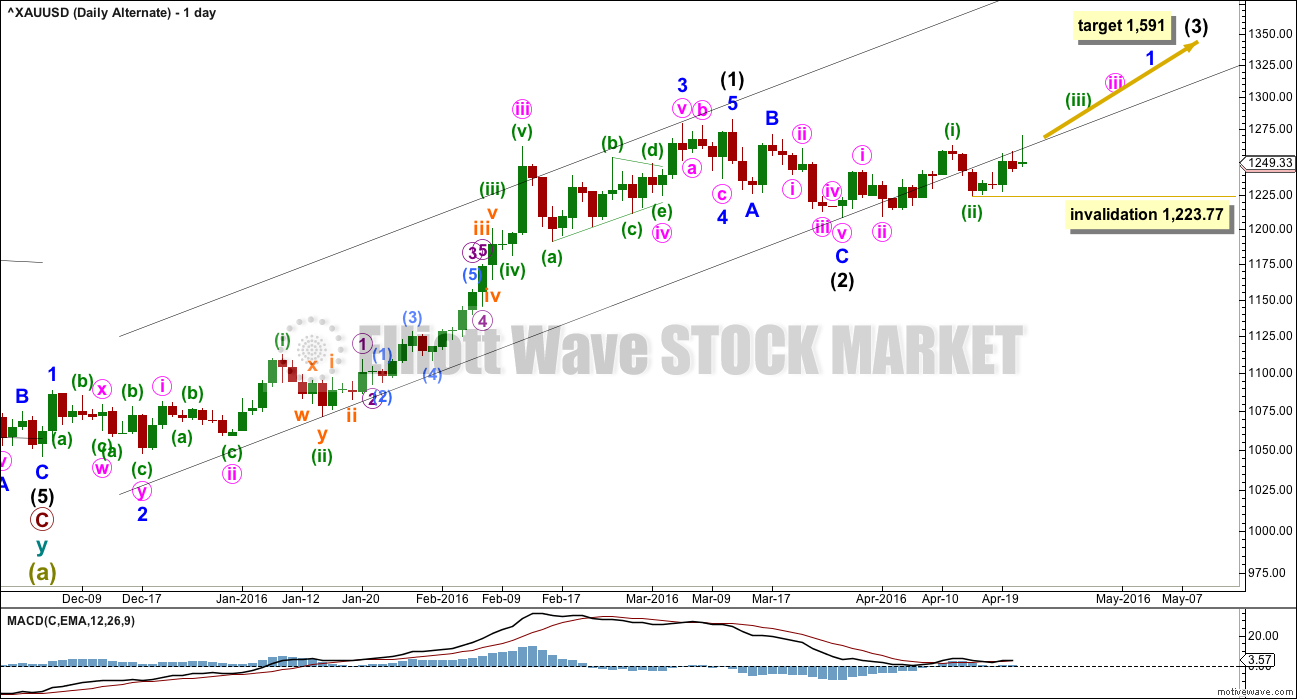
Click chart to enlarge.
It is technically possible but highly unlikely that intermediate wave (2) is over. This wave count requires confirmation with a five up on the hourly chart for confidence. A new high is not confirmation of this wave count. If price exhibits a classic breakout, a strong upwards day closing comfortably above 1,282.68 on high volume, then this wave count would increase in probability and should be used.
If intermediate wave (2) is over, then it is a very brief and shallow 0.31 zigzag lasting only eleven days (intermediate wave (1) lasted 69 days). The probability of this is very low.
At 1,591 intermediate wave (3) would reach 1.618 the length of intermediate wave (1).
Minuette wave (ii) may not move beyond the start of minuette wave (i) at 1,209.08.
The best fit black channel about this upwards movement contains all except the end of minute wave iii within intermediate wave (1). It is very common for the ends of third waves to overshoot channels as they are the strongest movement within a trend. Minuette wave (iii) overshoots the upper edge giving this channel a typical look.
It is indicative that the lower edge of this channel is now being breached. If a big third wave up has begun, price should be finding support at the lower trend line. For this reason with now two full daily candlesticks below the line the probability of this alternate wave count at this stage is reduced.
TECHNICAL ANALYSIS
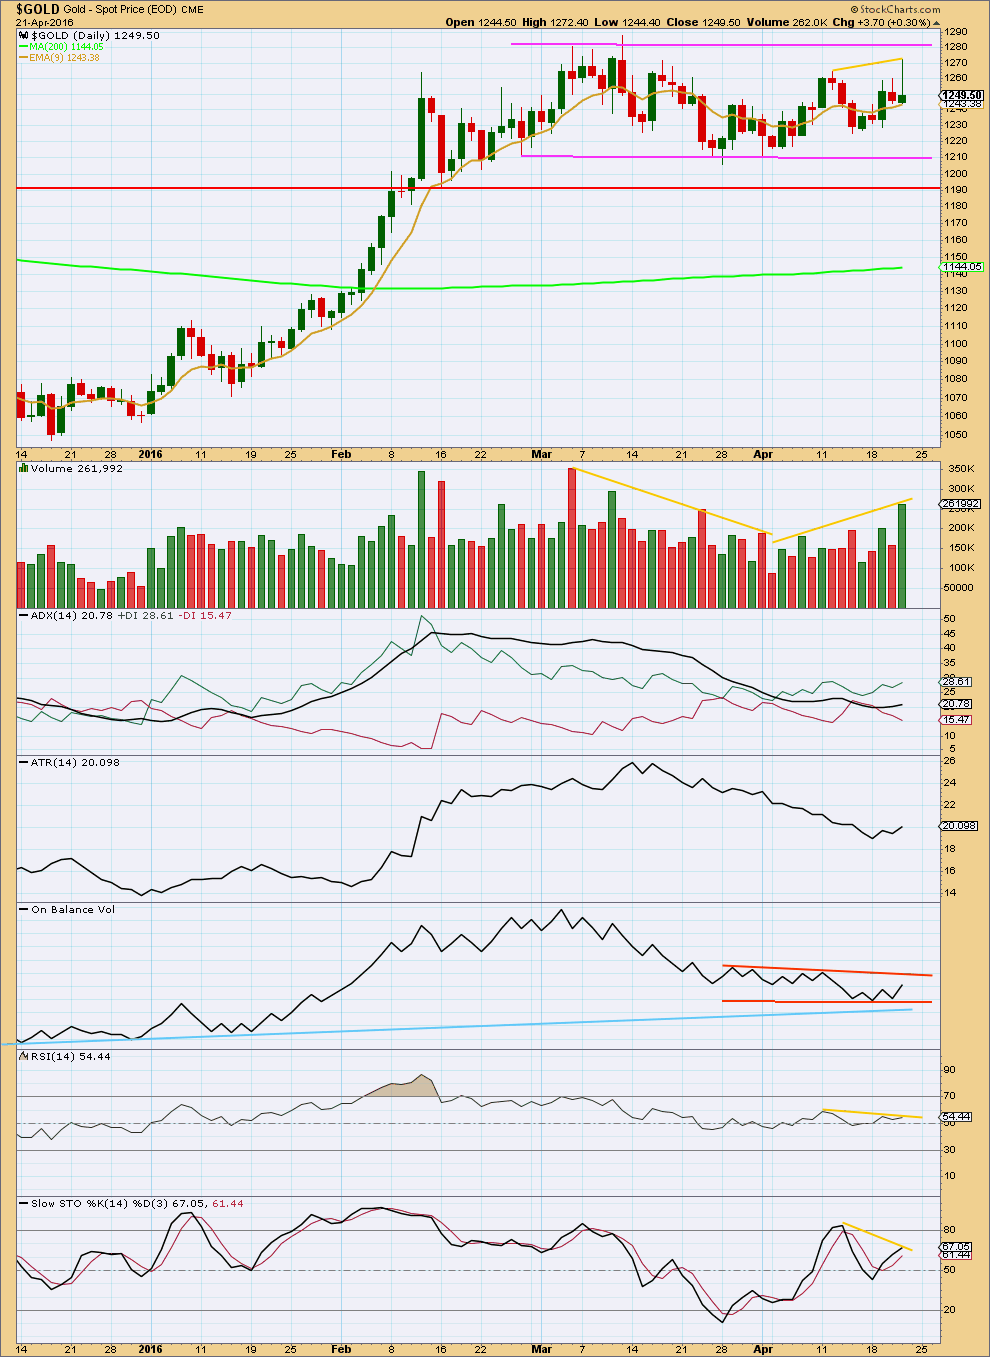
Click chart to enlarge. Chart courtesy of StockCharts.com.
The bottom line is price remains range bound and has been so since February. During a range bound market, price will swing from resistance to support and back again. It won’t move in a straight line and it may overshoot resistance or support before turning around and moving back within the range. The safest approach to a range bound market is to exercise patience and wait for price to breakout, and then join the trend. Only the most highly experienced traders should attempt to trade a range bound market; mean reverting systems are characterised by a few large losses and many small profits; it is more difficult to profit in a range bound market using a mean reverting system. Trend following systems are easier to profit from but require a trending market.
During this consolidation, it remains a downwards day with strongest volume. This indicates a downwards breakout is more likely than upwards. Recently, volume has been rising overall as price has overall moved higher. This gives slight cause for concern to the breakout direction indicated by volume. More normally, during a consolidation volume declines particularly towards the end. Here it is not.
The strong volume for the upwards day of 21st April supports the idea of more upwards movement to come short term at least.
ADX indicates there is a trend and it is up. ATR may be beginning to agree; it is also increasing. These two indicators today along with strong volume for 21st April offer some support to the alternate daily Elliott wave count.
However, the candlestick for 21st of April does not. The long upper wick is a warning that upwards movement may be over. This wick is bearish. Heavy volume may be a volume spike for the end of a movement, typical of commodities, although more often seen at the end of a larger trend than a smaller movement within a consolidation.
The trend lines on On Balance Volume are redrawn today to better reflect the current consolidation. A break above or below the orange lines by OBV would indicate the more likely direction for price.
There is divergence today short term between the new high from price and RSI and Stochastics (short yellow lines). This indicates weakness in price. Along with the long upper wick on today’s candlestick, on balance it would be more likely that upwards movement is over for now and one to three downwards days may be seen here to move lower until price finds support.
This analysis is published @ 08:56 p.m. EST.
WEDNESDAY, APRIL 27
2 pm EST US FED FOMC announcement
Will gold bottom before the FOMC meeting or after the FOMC meeting?
Once Gold 10 day MA and 50 day MA crossed, the down trend will be confirmed.
They crossed today.
Good morning everybody 🙂
Daily II so far looks the best today, but Daily I is also looking about right.
Target for both still about 1,207. Daily II could get there pretty quickly, maybe the end of next week. In a few days.
But daily I would need more time for a corrective structure to unfold. If it turns out to be a triangle it may take several days.
As for the daily alternate, I just tried to see if it could be a leading diagonal up for a first wave, now a second wave correction down.
But it won’t work. The leading diagonal would have a third wave longer than the first and a fourth wave longer than the second, but the fifth wave would be shorter than the third. Rules for wave lengths of an expanding diagonal wouldn’t be met, nor obviously a contracting diagonal.
So for the alternate daily it can still only be three first and second wave corrections. Which means it’s invalidated below 1,223.77.
Lara may Monday be an up day in gold?
Would it be a 4th wave?
It could be.
For second daily and hourly:
the second wave correction would have been too brief to show on the daily chart, so if the fourth wave shows up then at the daily chart level a five is going to have a three wave look. This is possible, but less likely than the fourth wave would be more brief.
For first daily and hourly:
With minor Y a zigzag, flat or triangle then yes, Monday could see a green daily candlestick.
Bottom line: sorry Richard. There are simply too many structural possibilities with these alternates. We could be seeing an impulse unfold down, or a zigzag unfold down, or a flat unfold sideways, or a triangle unfold sideways.
I’m not going to be able to tell you which one will unfold for sure, so I can’t guide you with any reasonable confidence as to what candlestick may turn up Monday
Excellent answer thanks Lara.
We have had a .618 correction of the move from 1204 to 1272 at 1229 area .This “could “represent the minute 2nd wave of the first minute wave of a n intermediate wave 3 beginning. Also some feel that the SPX has topped out at 2111 . We will see next week, but however it goes it would seem that it will be Sell in May and go away for the stock market and buy gold now or next week . IMHO . This does kind of fit in with Lara,s thinking. Anyway have a good weekend all. This Saturday in New London CT. there is a Pequot Indian festival called Nameaug , There will be over 24 different bands playing in downtown New London at the PARADE from 2 pm till midnight. Jazz,Blues, Rock,Country,Swing, Punk, SKA, Hip-Hop, Rap-Rock and semi classical, with the Naked magic show from Australia at the Garde theatre and” Rigilleto” Italian Opera (CT.Opera company and eastern CT. symphony orchestra, also at the Garde theatre. New London is truly the music capital of Connecticut.
Gold down to 1235.84 low at 11:47 am. It almost looks like the main hourly chart drop towards the 1230 area? I thought it would only retrace to about the 1240 area?
Apologies. I was concentrating on S&P. It had most likely topped. Waiting for a second wave retrace to complete before going in. Should be a lucrative trade.
For gold, the price action appears to favour the 2nd count. It is most likely in a strong third wave down. I can see two 1-2s already. A conservative target for the third wave is 1216.03. This will retain the low of 1208 for the fifth wave.
Alan this drop seems to be going fast today. Any bullish trades in gold like GDX or NUGT available today or at day end? I prefer to stay out of DUST. Did gold just complete a first 5 wave down at 1232.43 at 12:35 am and now needs a 5 count up? Might the third wave 1216.03 down end up completing next week instead of today?
Hi Richard. My best guess is that gold may not bottom today. From my count, wave 2 was rather quick which means wave 4 could take quite a while. The fast drop is wave 3.
I am waiting for the bottom before buying in to NUGT and maybe the juniors. Silver is also a good bet. It has so far outperformed gold.
Your waiting for 1207 before buying NUGT?
Silver analysis last night showed silver is really overbought and may drop harder that gold now.
It appears that the .618 retrace from Thursday’s high may have ended at 9:38 am at 1,240.27.
Lara once gold hits $1,207 would that signal intermediate wave (2) is over or could things change by then and the target moves again perhaps lower?
At this stage that should be it.
But it depends on what happens in the middle of now and then.
If the structure changes for intermediate (2) then the target could be lower.
At this stage the whole thing looks rather sideways, don’t you agree? Which indicates a combination as most likely.
I must admit, it is still a rather shallow looking intermediate degree second wave.
I enjoy your posts. I am amaze your up in vee hours. Do your sleep??
Lara certainly can come up with some amazing answers.
That was just before I went to sleep.
Yes I sleep, at least 8 hours a night. Most important. 🙂
Weirdly, I often dream of markets and waves.
Lara is it possible that intermediate wave (2) $1,207 or $1,208 could be over by or before May 1st?
What might be the probability of it ending by May 1st?
Entirely possible. Especially if wave count II is the one.
A five down for minute c doesn’t have to take very long. It could complete in six sessions quite easily.
Probability? About even with the first wave count. If I was pressed on a clearer answer I may actually see the second wave count slightly more likely.
But combinations are awfully tricky structures. Like triangles. So hard to tell exactly what it is until the end.