
Another small range day continues the consolidation.
Summary: Gold is still range bound. There are still at least two valid wave counts for this correction and they encompass four possible structures which may unfold this week. This means that short term price swings within the consolidation will be impossible to accurately predict. The safest approach to a range bound market is to wait for a breakout and the resumption of a trend before joining the trend. In the short term, a little upwards movement to about 1,253 should be followed by more downwards movement. Overall, price should continue sideways for a few days yet.
New updates to this analysis are in bold.
Last published weekly chart is here.
FIRST DAILY ELLIOTT WAVE COUNT
Click chart to enlarge.
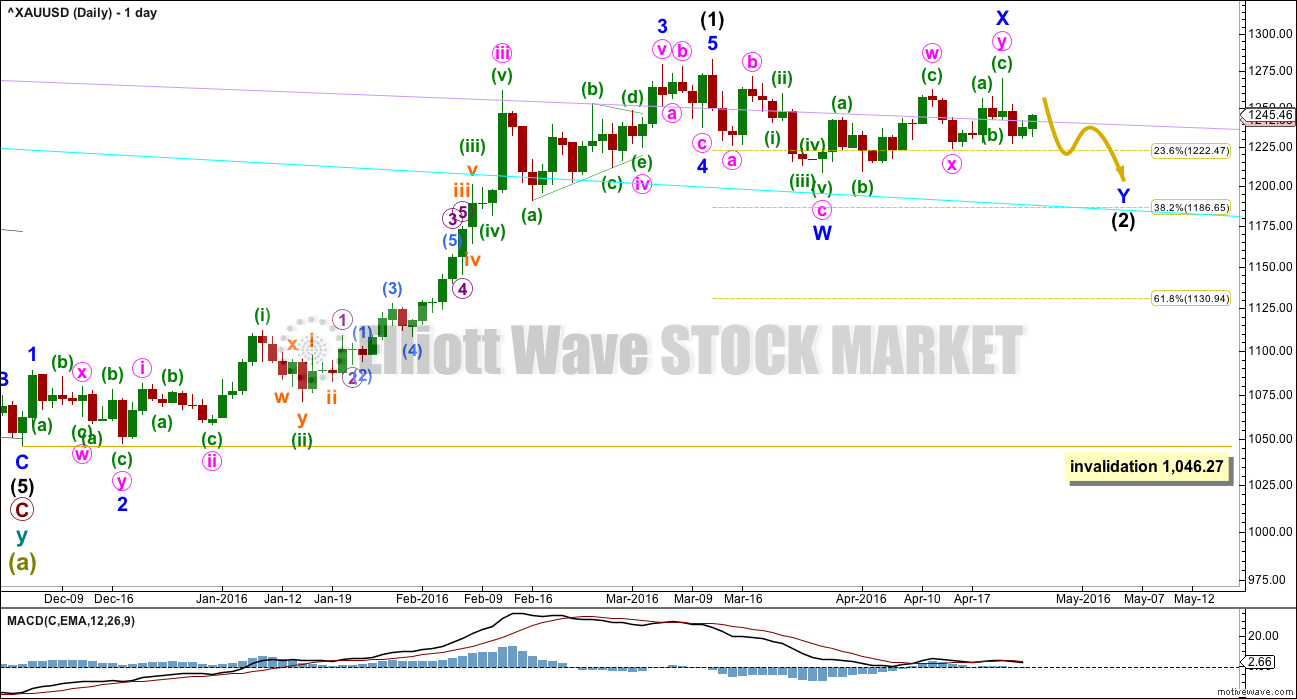
Intermediate wave (1) is a complete impulse. Intermediate wave (2) has begun and is most likely incomplete.
The first movement down within intermediate wave (2) fits as a zigzag.
Upwards movement labelled minor wave X may be a complete double zigzag. Subwaves W, Y and Z within multiples may only be single corrections. The maximum number of corrective structures within a multiple is three. To label W, Y and Z multiples themselves increases the maximum beyond three and violates the rule. But X waves are movements in the opposite direction and are not included in the count of the number of corrective structures, so they may take any corrective form.
Occasionally X waves subdivide as multiples themselves. This may have happened here. All possibilities should be considered.
Minor wave X is a 0.83 length of minor wave W. This may not be a B wave within a flat correction for intermediate wave (2) because it falls short of 0.9 the length of the the first zigzag down labelled minor wave W.
Intermediate wave (2) may be unfolding as a double combination or double zigzag. Because minor wave X is relatively deep, a double combination would be more likely now. Double zigzags more commonly have shallow (and relatively brief) X waves than this one.
If intermediate wave (2) is a double zigzag, then minor wave Y downwards must be a zigzag and must deepen the correction so that the structure has a downwards slope. The most likely point for this to end would be about the 0.618 Fibonacci ratio of intermediate wave (1) at 1,131. This scenario is still possible but has reduced in probability due to the depth and duration of minor wave X.
If intermediate wave (2) is a double combination, then the first structure in the double is a zigzag labelled minor wave W. The double is joined by a three in the opposite direction, a double zigzag labelled minor wave X. The second structure in the double may be either a flat or triangle labelled minor wave Y. It would most likely end close to the same level as minor wave W at 1,208 so that the whole structure moves sideways. This is now more likely.
Intermediate wave (2) may not move beyond the start of intermediate wave (1) below 1,046.27.
FIRST HOURLY ELLIOTT WAVE COUNT
Click chart to enlarge.
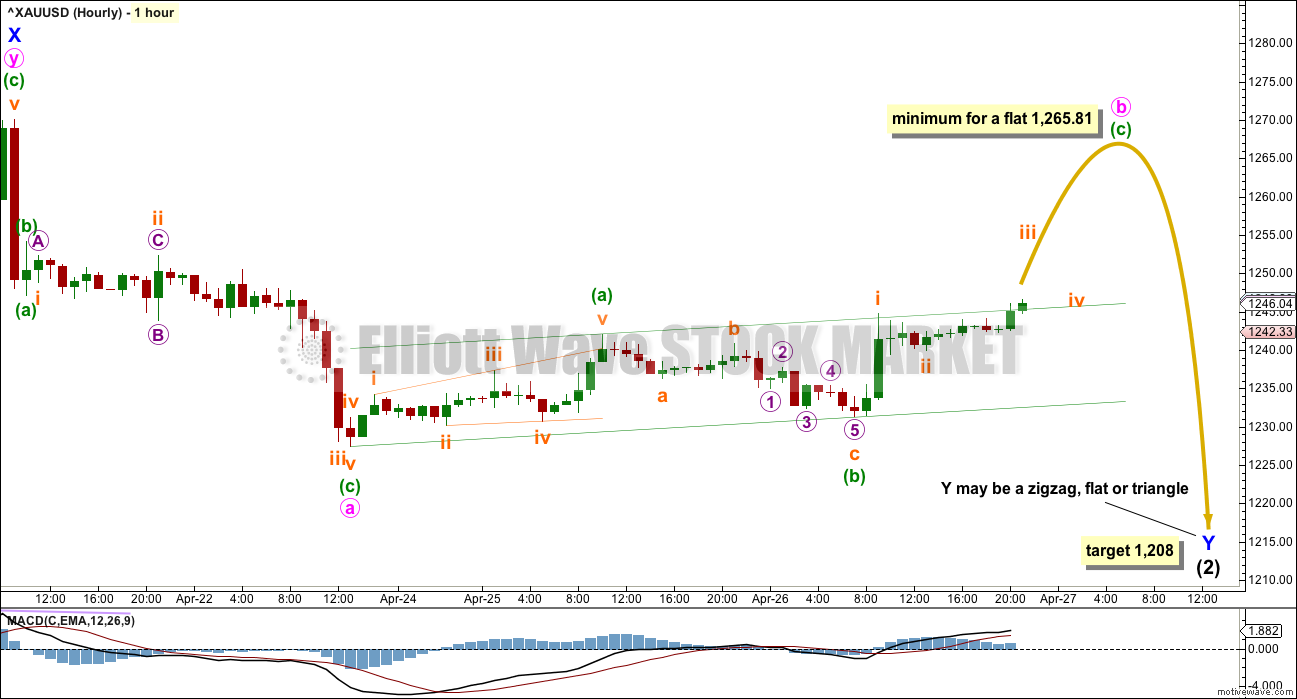
At this stage, it looks unlikely that minor wave Y is a zigzag but the possibility remains.
What looks more likely is minor wave Y is a flat or a triangle. Minute wave b may move beyond the start of minute wave a above 1,270.08 for both a flat or triangle.
Minute wave a is relabelled. With two small green daily candlesticks now showing, it looks like this upwards movement is minute wave b.
If minor wave Y is unfolding as a flat correction, then within it minute wave b must be 0.9 the length of minute wave a or longer. This minimum is at 1,265.81. An expanded flat, the most common type, would see minute wave b a 1.05 length of minute wave a or longer which would be at 1,272.21 or above.
If minor wave Y is unfolding as a triangle, there is no minimum requirement for minute wave b within it. A running triangle would see minute wave b move above the start of minute wave a at 1,270.08.
So far minute wave b fits within a small channel. When this channel is breached by downwards movement, that shall indicate minute wave b is over and minute wave c is underway.
The target at this stage will remain at 1,208 for minor wave Y to end about the same level as minor wave W. When minute wave b is complete, then the target may be calculated at minute wave degree, so at that stage it may widen to a zone or it may change.
SECOND DAILY ELLIOTT WAVE COUNT
Click chart to enlarge.
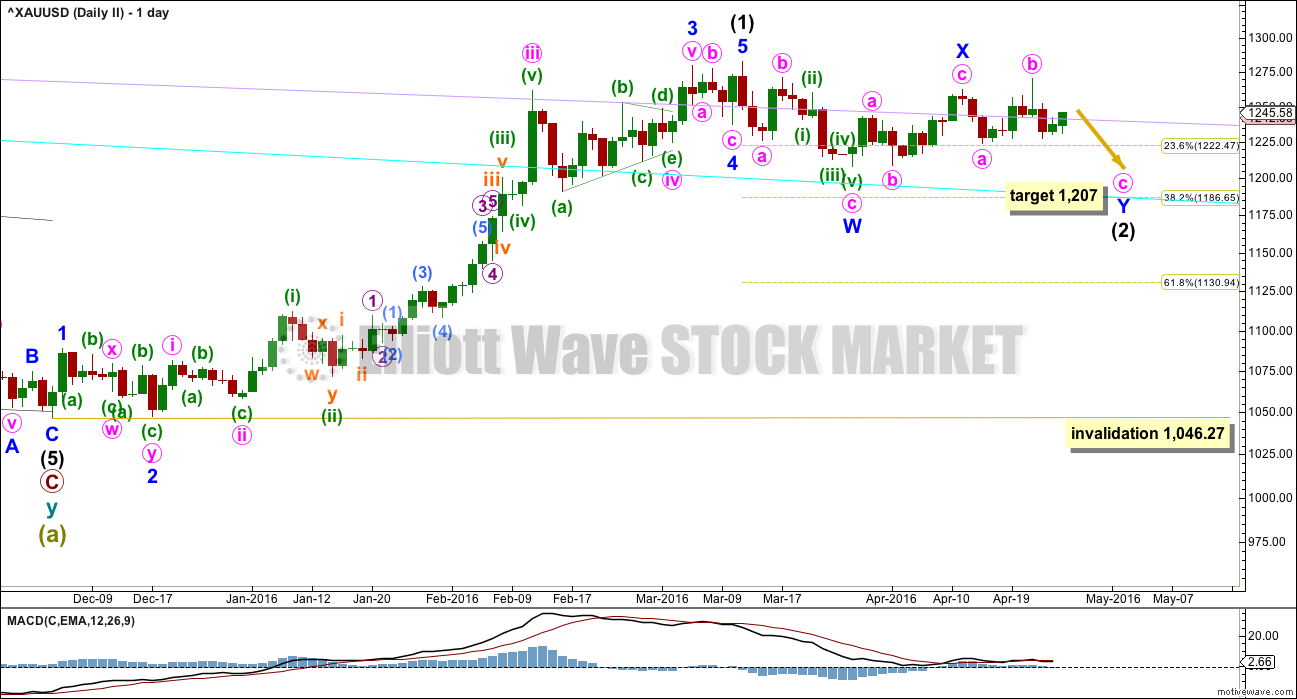
I am labelling these wave counts “one” and “two” rather than main and alternate because it is my judgement that they have a close to even probability. If pressed to state which one I would prefer, I would slightly favour this second wave count because it has overall a slightly more typical look.
Intermediate wave (2) may be a double combination with minor wave X ending earlier as labelled.
Minor wave W is a zigzag, the first structure in a double. The two structures in the double may be joined by a simple zigzag for minor wave X in the opposite direction.
Minor wave Y may be underway as an expanded flat correction.
At 1,207 minute wave c would reach 1.618 the length of minute wave a within the expanded flat of minor wave Y. This target would see minor wave Y end very close to the end of minor wave W. The whole structure for intermediate wave (2) would have a sideways look, typical of a combination.
Minute wave c downwards must subdivide as a five wave structure.
SECOND HOURLY ELLIOTT WAVE COUNT
Click chart to enlarge.
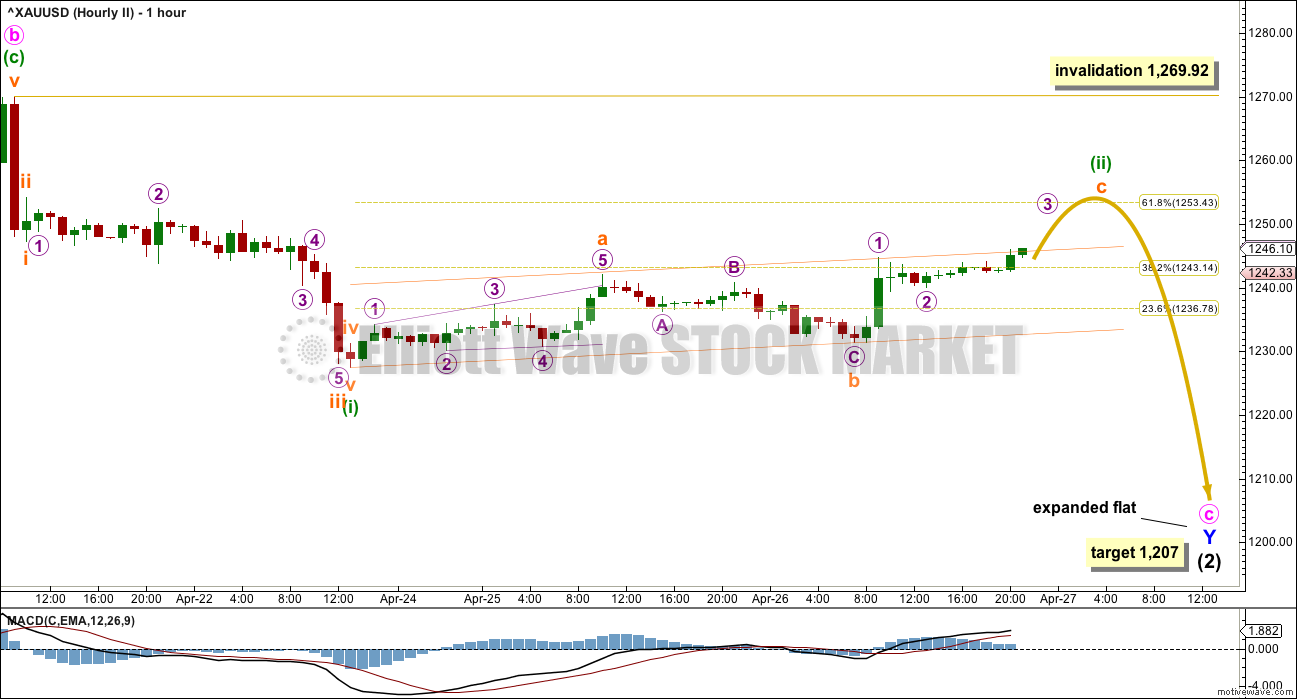
Upwards movement is now too long in duration to be a correction within minuette wave (i). Upwards movement looks more like minuette wave (ii).
Minuette wave (i) will subdivide as an impulse on the one minute chart, with time consuming second wave corrections and quick shallow fourth waves giving the movement a curved look.
Minuette wave (ii) may end about the 0.618 Fibonacci ratio of minuette wave (i) at 1.253.
Minuette wave (ii) may not move beyond the start of minuette wave (i) above 1,269.92.
The target remains the same at 1,207. When minuette wave (ii) is complete, then the small channel about it should be breached. That would confirm minuette wave (iii) as underway.
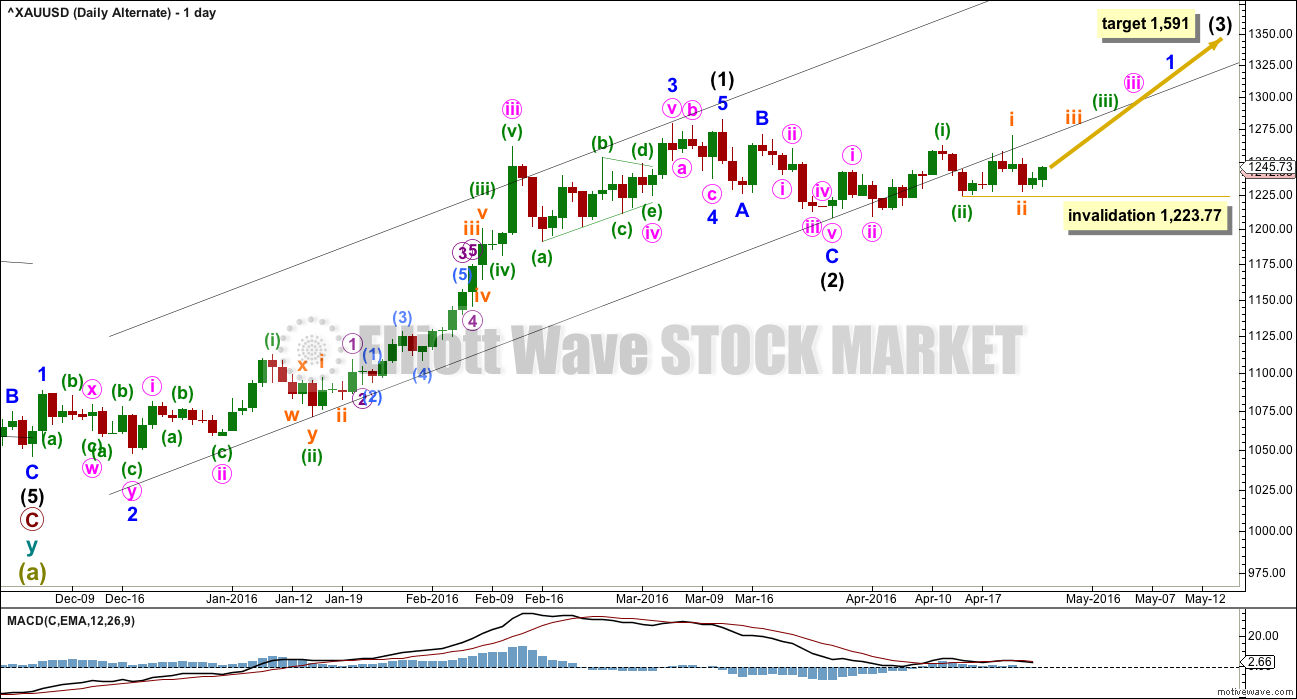
ALTERNATE DAILY ELLIOTT WAVE COUNT
Click chart to enlarge.
It is technically possible but highly unlikely that intermediate wave (2) is over. This wave count requires confirmation with a five up on the hourly chart for confidence. A new high is not confirmation of this wave count. If price exhibits a classic breakout, a strong upwards day closing comfortably above 1,282.68 on high volume, then this wave count would increase in probability and should be used.
If intermediate wave (2) is over, then it is a very brief and shallow 0.31 zigzag lasting only eleven days (intermediate wave (1) lasted 69 days). The probability of this is very low.
At 1,591 intermediate wave (3) would reach 1.618 the length of intermediate wave (1).
Minuette wave (ii) may not move beyond the start of minuette wave (i) at 1,209.08.
The best fit black channel about this upwards movement contains all except the end of minute wave iii within intermediate wave (1). It is very common for the ends of third waves to overshoot channels as they are the strongest movement within a trend. Minuette wave (iii) overshoots the upper edge giving this channel a typical look.
It is indicative that the lower edge of this channel is now being breached. If a big third wave up has begun, price should be finding support at the lower trend line. For this reason with now five full daily candlesticks below the line the probability of this alternate wave count at this stage is reduced.
There is now a five wave movement upwards from the low labelled intermediate wave (2). However, this is not an impulse because the fourth wave overlaps first wave price territory significantly. It will not meet the rules for a leading diagonal either in terms of wave lengths: the third wave would be longer than the first, the fourth wave would be longer than the second, but the fifth wave would be shorter than the third.
This upwards movement will not subdivide as a five and meet all Elliott wave rules. The only way to label this upwards movement, if it is the start of intermediate wave (3), is as a series of three overlapping first and second waves. Subminuette wave ii may not move beyond the start of subminuette wave i below 1,223.77. A new low below this point would see this wave count fully invalidated and discarded.
TECHNICAL ANALYSIS
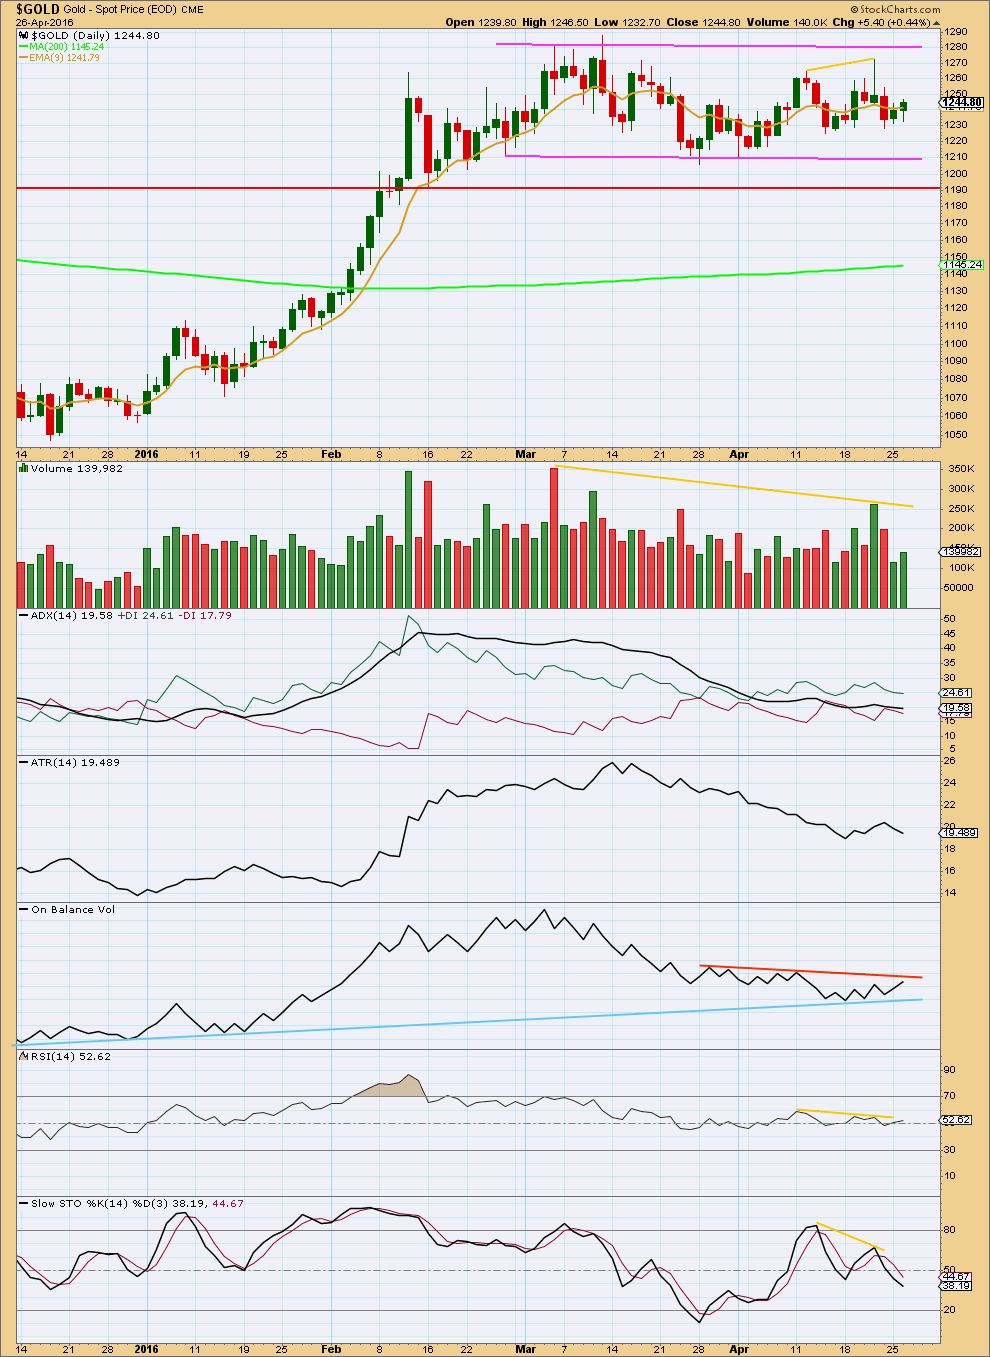
Click chart to enlarge. Chart courtesy of StockCharts.com.
The bottom line is price remains range bound and has been so since February. During a range bound market, price will swing from resistance to support and back again. It won’t move in a straight line and it may overshoot resistance or support before turning around and moving back within the range. The safest approach to a range bound market is to exercise patience and wait for price to breakout, and then join the trend. Only the most highly experienced traders should attempt to trade a range bound market; mean reverting systems are characterised by a few large losses and many small profits; it is more difficult to profit in a range bound market using a mean reverting system. Trend following systems are easier to profit from but require a trending market.
During this consolidation, it remains a downwards day with strongest volume. This indicates a downwards breakout is more likely than upwards. Overall, volume is declining and has been particularly light for the last three days. Although two days of upwards movement comes on an increase in volume for the second day, volume is still lighter than the prior downwards day. This would give serious concern for the alternate daily Elliott wave count. A big third wave up should show clearer upwards movement and it should be supported by volume. That is not happening.
ADX is flat today, no longer indicating a trend may be beginning, and indicating price is consolidating. ATR today agrees as it is declining. The market is consolidating; it is not trending.
On Balance Volume is still constrained between two trend lines which are converging. The breakout must come soon. OBV will be watched closely to see if it breaks out before price, because OBV is normally a reliable direction indicator for price. OBV today is close to the upper orange line. If OBV finds resistance there, then upwards movement may continue only for one more day or part of one day.
This analysis is published @ 10:02 p.m. EST.
Here’s an updated count for the second hourly chart.
The first hourly chart will see this upwards movement for minute b in the same way, a complete double zigzag.
TBH I’m not too happy with the look of submicro (3) within micro A within subminuette y. I need to check the subdivisions on the five minute chart. So this wave count may change in that the labelling of this upwards correction may be different.
This is what I have so far.
It’s so close to the 0.618 Fibonacci ratio and has reversed from there. This is slight indication it may be over there.
A break below the lower edge of the orange channel would provide some confirmation.
Bottom line: this market is still consolidating folks. There has been no breakout. As annoying as it may be the safest route is to still SOH and wait patiently.
Many thanks to Lara for the timely update/s. That’s what I thought, all Gold price got on the upside was 61.8% of H 1270 / L 1227… Looks like needs a break below 1239 to coast lower….
Lara ,just wondered if you knew of any MacLeods in NZ. One of my ancestors moved there in 1850. Also on my fathers side Emil Payer moved to Australia in 1900 and I have 4 cousins in Sydney with the name Payer. ??
I don’t know any MacLeods. Nor any Payers.
I do know of some non Payers though 🙂
The FED FOMC meeting at 2:00 pm EST today looks like a stalemate on the direction gold is heading from here at this time 3:04 pm EST even though no interest hike mentioned for April or June and one might expect gold to move up. Or is this a buy on rumour and sell on news situation? At the FED FOMC minutes release this month gold stalled then started up slowly.
This correction is struggling to reach 1,265.81.
It looks more like the second wave count; a low degree second wave correction.
It may be a double zigzag rather than a single zigzag. On the second hourly wave count the upwards movement i have labelled subminuette c isn’t subdividing as a five; it is neither an impulse nor an ending diagonal.
Lara, may that expect gold to continue up toward 1253 or even higher or possibly the high of 1,251.12 at 8:47 am today was it for now and gold may head down towards the 1208 area by week end?
At this stage it looks like it may not, but that is not to say it can’t.
As it’s reversing from the 0.618 Fibonacci ratio of the prior wave down right now, right now it looks like it may keep going down.
But that view would only hold any weight if the orange channel is breached. Price is still within the channel.
Lara, my mistake, the actual high was $1,252.91 at 2:06 pm just after the 2:00 pm FED FOMC, which is just 9 cents from your Hourly II target of 1,253, your amazing forecast! Hopefully it keeps going down from here to the 1,208 area by the weekend. My MACD and other indicators are showing gold dropping however GDX is level since the FOMC, they will end up dropping if gold drops more.
Oh neat, I got something right in this mess! I missed that. Cheers Richard!
FED FOMC 2:00 pm EST today
Has The Miner’s Correction Finally Begun? – Avi Gilburt Elliott Wave April 27, 2016
http://www.gold-eagle.com/article/has-miner%E2%80%99s-correction-finally-begun
See link to Elliott Wave charts on the bottom line illustrating the wave counts on the GDX, GLD and Silver (YI).
Any wave count?
Is the high of 1,251.12 at 8:47 am the top for minuette wave (ii) on Hourly wave II ?
Or did micro wave 5 start at 9:30 am EST?
DUST and JDST reverse split coming on May 17th
Quite necessary as they have both been a disaster since mid January.
Yes, because they were not intended to be held long term with time decay. Holding either one of them will lose you money in the long time since they eventually will go to 0. Just my 2 cents.
The time decay in 3x ETFs is about 2% a month. Decay is small unless you hold a very long time. So DUST lost 90% due to mainly gold going up.