Gold remains within a consolidation. The question is: What direction will price break out? On Balance Volume is today giving an indication.
Summary: Gold is still range bound. On Balance Volume is today indicating the breakout direction is more likely to be up. It may now be just hours away. In the short term, a new high above 1,270.08 would indicate a possible upwards breakout underway. Full confidence would be had if Gold can print a strong green daily candlestick closing above 1,280 on increased volume.
New updates to this analysis are in bold.
Last published weekly chart is here.
DAILY ELLIOTT WAVE COUNT
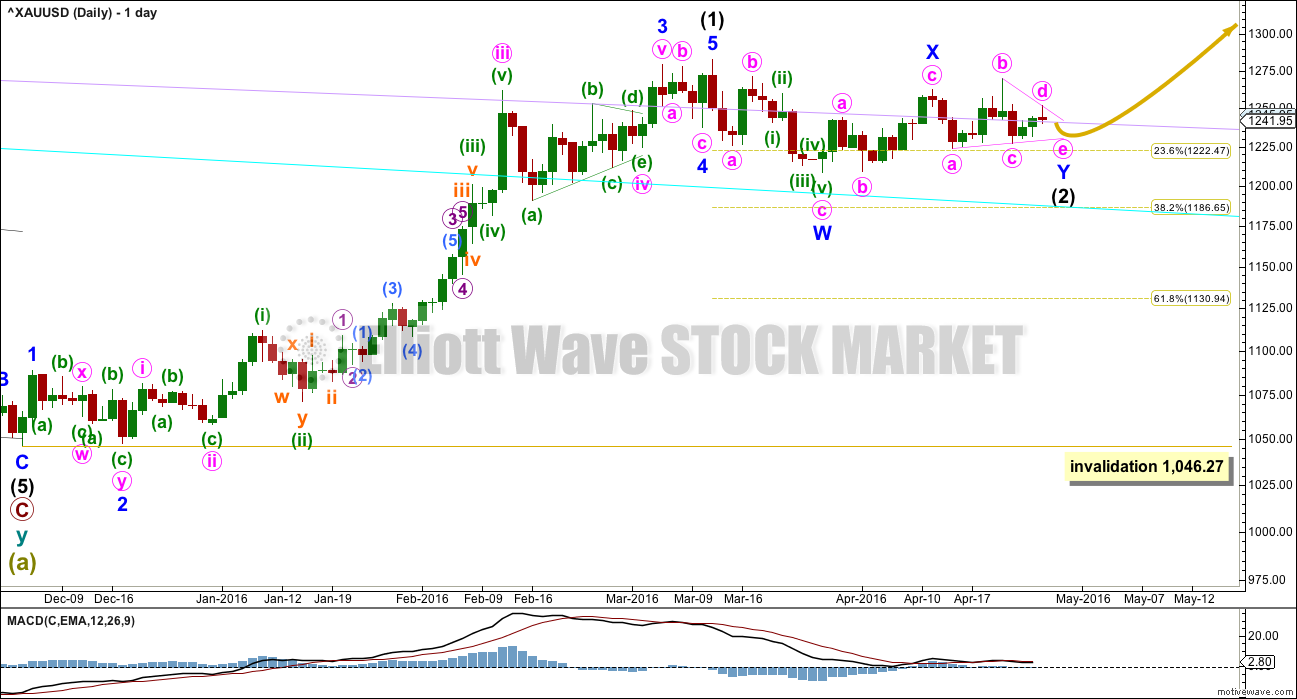
I am discarding the previous first daily chart in favour of this idea. At this stage, this idea has a better look.
Intermediate wave (2) may be a double combination with minor wave X ending earlier as labelled.
Minor wave W is a zigzag, the first structure in a double. The two structures in the double may be joined by a simple zigzag for minor wave X in the opposite direction.
Minor wave Y may be underway as an expanded flat correction or a running contracting triangle. Both possibilities must be considered. The first hourly chart considers a triangle and the second an expanded flat.
Intermediate wave (2) may not move beyond the start of intermediate wave (1) below 1,046.27.
When intermediate wave (2) is complete, then the next wave up for intermediate wave (3) should be swift and strong. It must move above the end of intermediate wave (1) at 1,282.68. It must move far enough above this point to allow room for intermediate wave (4) to unfold and remain above intermediate wave (1) price territory.
A target cannot be calculated for intermediate wave (3) until intermediate wave (2) is complete.
If intermediate wave (2) ends in one more session, it would total a Fibonacci 34 days. Minor wave Y within it would total a Fibonacci 13 days. This is a reasonable expectation at this stage given that Gold’s waves often exhibit Fibonacci durations.
FIRST HOURLY ELLIOTT WAVE COUNT
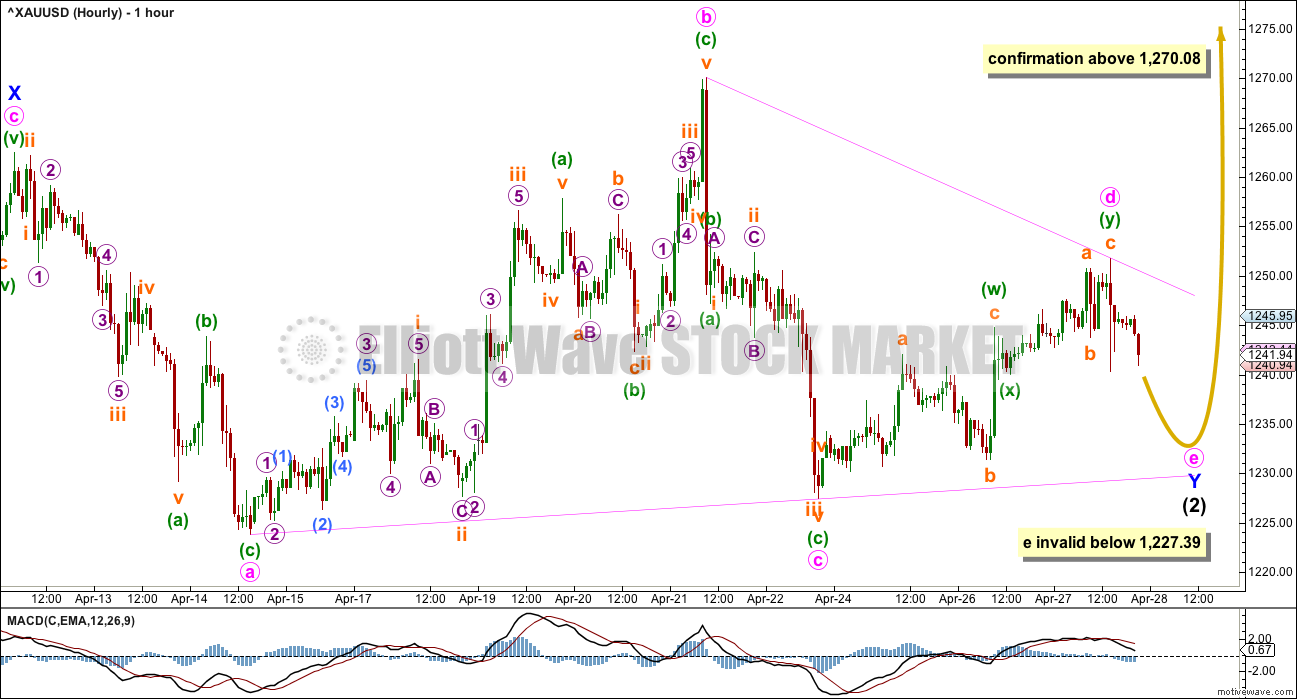
If minor wave Y is a running contracting triangle, then only the final wave down for minute wave e is needed to complete the structure.
Within the triangle, so far minute wave b is a 1.2 length of minute wave a, minute wave c is a 0.92 length of minute wave b, and minute wave d is 0.57 the length of minute wave c. Minute wave d is reasonably close to 0.618 (often one of the triangle subwaves is this length). Minute wave d subdivides as a double zigzag. Minute wave e should be a single three wave structure, most likely a zigzag.
Minute wave e is most likely to end short of the a-c trend line. If it does not end there, then the other less likely position is for it to end with an overshoot of the a-c trend line.
Minute wave e may not move beyond the end of minute wave c below 1,227.39.
If price moves below 1,227.39, then the second hourly chart below would be confirmed.
SECOND HOURLY ELLIOTT WAVE COUNT
It is essential to always consider alternates when it looks like a triangle may be forming. What if the triangle does not end as expected? What else may be happening?
Triangles are very tricky structures. It is difficult to establish with certainty the beginning point until after the breakout from them.
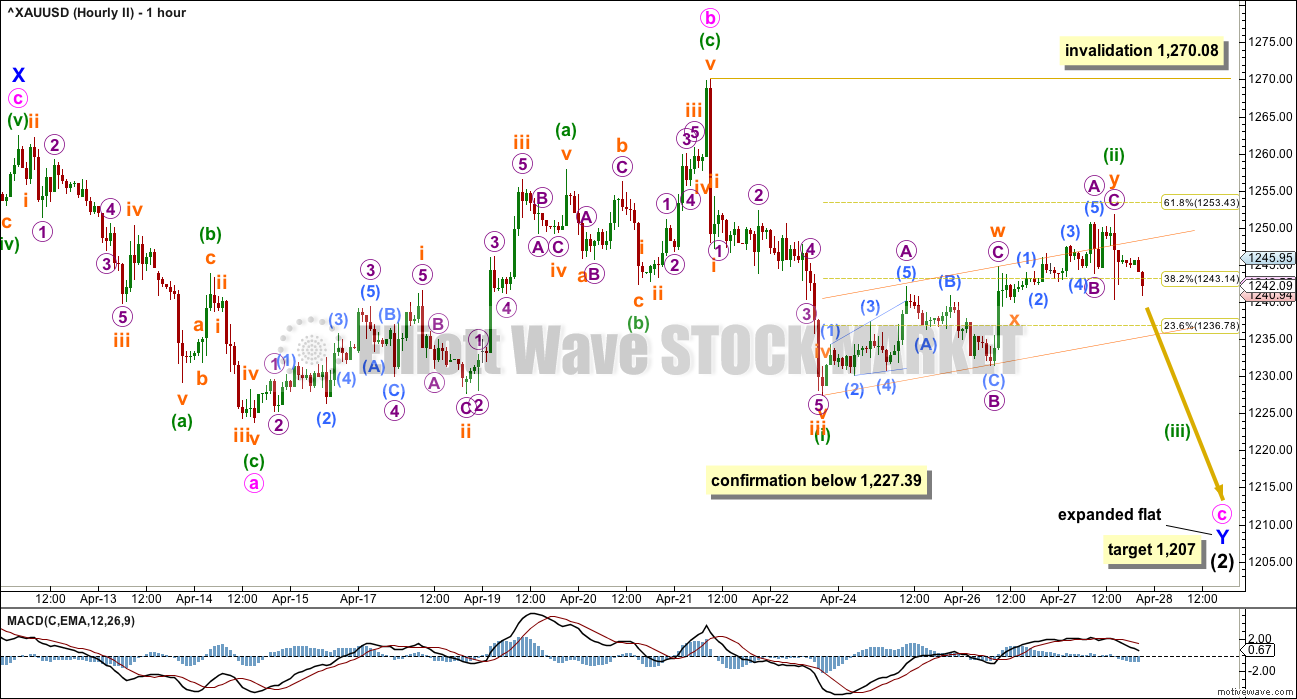
Minor wave Y may be an expanded flat correction.
Within the expanded flat, minute wave a is a three wave structure. Minute wave b is also a three wave structure and is a 1.2 length of minute wave a. At 1,207 minute wave c would reach 1.618 the length of minute wave a.
It is concerning today for this wave count that minuette wave (ii) shows up as three daily candlesticks. However, this is still possible.
If price breaks below 1,227.39, then some confidence may be had in the target. At that stage, minute wave c may continue lower for a few days. Along the way down, there would be one more countertrend movement for minuette wave (iv) which must remain below minuette wave (i) price territory.
It is my decision today to no longer publish the alternate daily wave count because its probability is too low.
TECHNICAL ANALYSIS

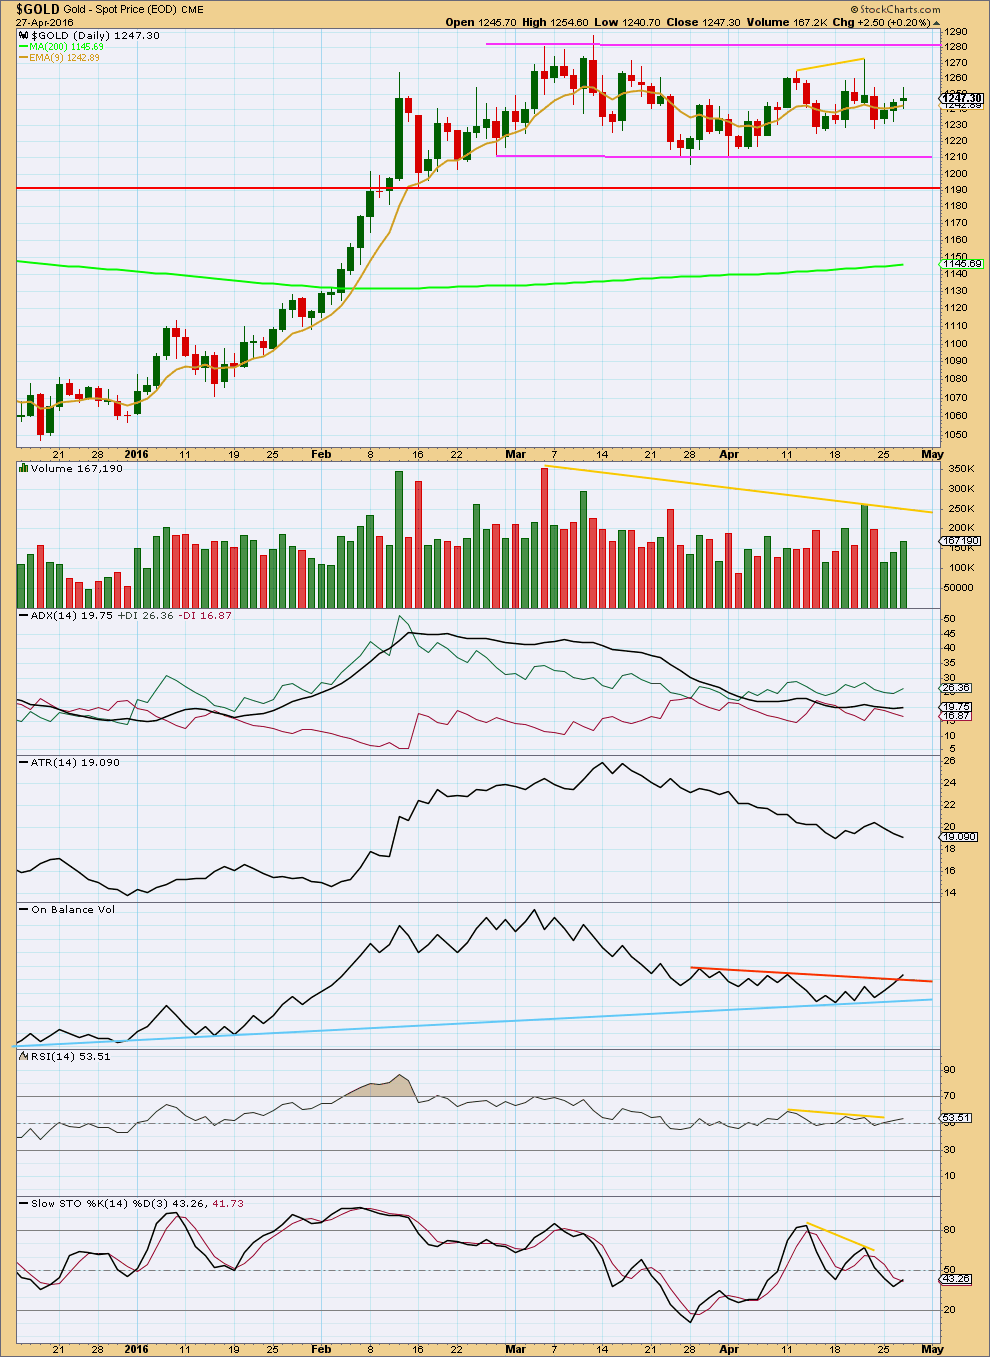
Click chart to enlarge. Chart courtesy of StockCharts.com.
The bottom line is price remains range bound and has been so since February. During a range bound market, price will swing from resistance to support and back again. It won’t move in a straight line and it may overshoot resistance or support before turning around and moving back within the range. The safest approach to a range bound market is to exercise patience and wait for price to breakout, and then join the trend. Only the most highly experienced traders should attempt to trade a range bound market; mean reverting systems are characterised by a few large losses and many small profits; it is more difficult to profit in a range bound market using a mean reverting system. Trend following systems are easier to profit from but require a trending market.
During this consolidation, it remains a downwards day with strongest volume. This indicates a downwards breakout is more likely than upwards. Overall, volume continues to decline as price moves sideways. For three days in a row now price has moved slightly higher on increasing volume. There was some support for the rise in price. However, volume for these three days is still very light.
ADX is flat today, no longer indicating a trend may be beginning, and indicating price is consolidating. ATR today agrees as it is declining. The market is consolidating; it is not trending.
On Balance Volume is my favourite early indictor of price direction for a breakout from a consolidation. Today the upper orange trend line is broken by OBV. There is a reasonable probability that this may precede an upwards breakout from price. This would fit perfectly with the first hourly Elliott wave count.
If OBV turns back down and moves below the orange line, then it would need to be redrawn and it would no longer be offering a bullish signal.
If OBV breaks below the light blue line, that would be a bearish signal.
This analysis is published @ 10:53 p.m. EST.
[Note: Analysis is public today for promotional purposes. Member comments and discussion will remain private.]


Close but no cigar, yet as only 33 cents away.
No confirmation above 1270.08 as high of day was 1269.75 at 3:56.
Low since Wednesday close was 1237.84 at 10:53 am,
gold moved up $31.91 since then.
Gold at 1,269.46 close to 1270.08 confirmation at 3:50 pm
Also it seems that the SPX has topped at 2111 and is now heading down(which should be bullish for gold). Stephen C.
I am still thinking that we are in intermediate 3 up and will cross over 1272 and change this afternoon /evening. Stochastics are not overbought. We are also reaching into the last 10 days of a (so called) “seasonal low”, which does not always pan out. So time is running out for a drop IMHO. I remain LONG and will add over 1272.50; looking for new highs (over 1291). Stephen , in New London CT. (of course I am keeping mental stops in mind).
The main wave count as I have it labelled in this analysis with the first hourly chart can now see that and have good proportions.
Todays upwards day, if it can break above 1,270.08, will see that my main wave count. Intermediate wave (3) beginning.
But I’m going to have its start at yesterdays low, not at the low of 28th March. The proportions just look wrong for that, and intermediate wave (3) to start would be problematic.
The bottom line from those three charts:
We need to see price break above 1,270.08 before we can have an indication that a triangle may be over.
Which is what Alan pretty much said below.
Second idea following on from the main daily / first hourly:
This upwards movement could be minute d of the triangle moving higher.
Minute d can’t move above the end of minute b at 1,270.08.
The problem with this idea which I have not yet resolved: the structure (subdivisions) of minute wave d. Particularly, within the first zigzag of minuette (w) how is subminuette c a five wave structure? It won’t fit as a diagonal. Doesn’t work. I need to go down to five and one minute chart level to see if it can fit as an impulse.
Update of the first hourly / main daily.
Two ideas here. The triangle could be over. Upwards movement could be the start of intermediate (3).
Confirmation above 1,270.08.
Good morning all 🙂
It certainly does look like a triangle is unfolding. But its not certain that it is over.
MACD is hovering right on the zero line on the daily chart, this supports a triangle.
So now my job should be to figure out alternate ideas with a triangle in here. Where else could it have started? What direction will price break out from it? What price points will tell us what is happening?
New idea here.
What if the triangle is a b wave within a flat for minor wave Y?
There’s a wee problem with this idea though. Because part of this triangle moves above the start of minute wave a that means minor wave Y can’t be a zigzag, it can only be a flat. That means that at it’s terminus the triangle must end at or above 1,258.60 to meet the minimum requirement of a B wave within a flat of retracing 0.9 the length of the prior A wave.
I hope that makes sense.
Anyway, this idea sees the triangle ending and price breaking out downwards for minute wave c to complete the flat of minor wave Y.
This wave count would require more days of sideways movement, which must end at or above 1,258.6, and then a new low below 1,227.39 would confirm it.
And I’m discarding this idea now.
Further upwards movement makes the A-C trend line of this possible contracting triangle almost flat.
It no longer looks reasonable. The A-C trend line should have a slope.
The rise in price has so far not given a clear indication of the wave count. Breaching 1270.08 means that Minor Y was over at the low of 1237.84 and we are now in Intermediate 3, completing minute 1.
A pullback below 1270.08 means minute d of 1st hourly (or minuette 2 of 2nd hourly) is probably complete.
In any case, a drop would ensue. How deep the drop is will make matters clearer. I guess we’ll just need patience.
Alan , thanks for the comment. Lots of big gold action since 11 pm and gold had MACD 5 minute Buy from 9:39 am until 12:10 pm and yes gold is still lacking clarity in direction. A double high of the day so far at 1265.88 at 1:06 and 1:11 pm. MACD for gold and GDX for 1,3 and 5 minutes now bearish yet there still are bullish MACD signs in gold and miners in 15 minutes and longer time frames.
Agreed. Although it looks like it could be an end to the triangle and the start of an upwards breakout, it does not have to be.
It could be that the triangle isn’t over. Minute wave d could be continuing higher.
Triangles are horrible structures. So very tricky to analyse. I’ve learned the hard way, and paid $$ to learn the lesson; don’t get too sure of your analysis with triangles. Always look for an alternate. Only when all alternate ideas are invalid and the triangle is the only one left can you then trade it.
It looks like gold might take off again, but there is that persistent heavy short position by the COTs that makes me very cautious here. Then there is the Fast and Slow stochastic that are overbought daily and weekly and MACD flattening out. The gold stocks seem to have defied gravity.
Then there is the stock market inching towards new highs with Stochastics fast and slow overbought. Oil seems to be overbought as well. There seems to be a trend here. Everything is overbought, the commercials are betting against all the above and all is calm. BANG……Boom…..Kapawee…..where will the knockout punch come from? Anyones guess……then again this time all the commercials could be wrong and the game has changed, or they used this opportunity to go heavily short Gold to keep it in place while they were scooping up shares and will now switch sides on the Gold market/Stock Market/Silver Market and the Oil Market and we will have a parabolic rise to new highs. Or I just could be paranoid.
At 10:20 am gold and the miners fired a Big BUY and the longer time frames have also begun firing BUY. This is a hot day in gold thanks to the Bank of Japan shocking the world at 11:00 pm EST Wednesday Yes soared, US dollar dropped and gold went up like fireworks and the world markets are jumping in.
Simple ratio analysis which has given heads up in past is again alerting correction is on the horizon?
Is correction beginning?
http://www.321gold.com/editorials/hoye/hoye042816.pdf
Wednesday 11 pm when gold at overnight low 1237.84, the Bank of Japan blockbuster news sent Yen soaring, the US dollars down and gold is still going up now at 1256.57.
No additional stimulus from Bank of Japan; negative rate holds
Apr 27, 2016 11:31 p.m. ET Central bank’s inaction comes amid growing economic woes
Nikkei crushed after Bank of Japan does nothing at policy meeting
Apr 28, 2016 1:10 a.m. ET
Market had expected more stimulus; yen soars
Yen rips higher against dollar after BOJ shocks market with no action
Apr 28, 2016 2:38 a.m. ET
BOJ probably will take action in June: analyst
The yen USDJPY, -2.83% gained as much as 2.4% against the U.S. dollar to ¥108.8770 immediately after the BOJ’s decision, putting it on track for its biggest one-day increase since August 24, 2015. The currency was last changing hands at ¥108.39.
Instead, the yen has largely strengthened this year against the U.S. dollar, in part because the Fed has pared expectations of the pace at which it would raise interest rates (the Fed kept U.S. rates on hold at its meeting Wednesday).
http://www.marketwatch.com/story/yen-rips-higher-against-dollar-after-boj-shocks-market-with-no-action-2016-04-28
Laraa after a small consolidation towards 1238$ gold gave a spike…do you suggest that triangle is completed..??
Possibly. It does have a bit of volume to support the rise in price too.
It could be minute wave d incomplete and moving higher though.
Price confirmation that the triangle is complete will come above 1,270.08. Prior to that there is a risk it’s not done.
Thank you :)..
Still i personally feel that smething is fishyy going on here in gold…
1.Dollar is making lower lows and gold is making lower highs…
2.FED still hanging knife of rate hike on gold…
3.Int 2 is very shallow giving concern that somethings might surprise on short side…
on the whole i stick to your valuable advice to wait untill a breakout..
Blame it on the Bank of Japan Blockbuster news at 11 pm.
The Yen soared, the US dollar dropped, and gold rallied from overnight low to overnight high and still climbing.
Hi Lara, could we be in minor 4 of intermediate 1?
No. It would be grossly disproportionate to minor wave 2. That would give the whole wave count the wrong look IMO.