
The situation remains unclear. Price is range bound.
Summary: Price remains range bound. A break above 1,230.82 would indicate more upwards movement to about 1,302 short term, before another downwards swing. Alternatively, a break below 1,208.33 would indicate more downwards movement from here to about 1,187. On Balance Volume and the COT report indicate more downwards movement overall.
New updates to this analysis are in bold.
Last published weekly chart is here.
MAIN DAILY ELLIOTT WAVE COUNT
Click chart to enlarge.
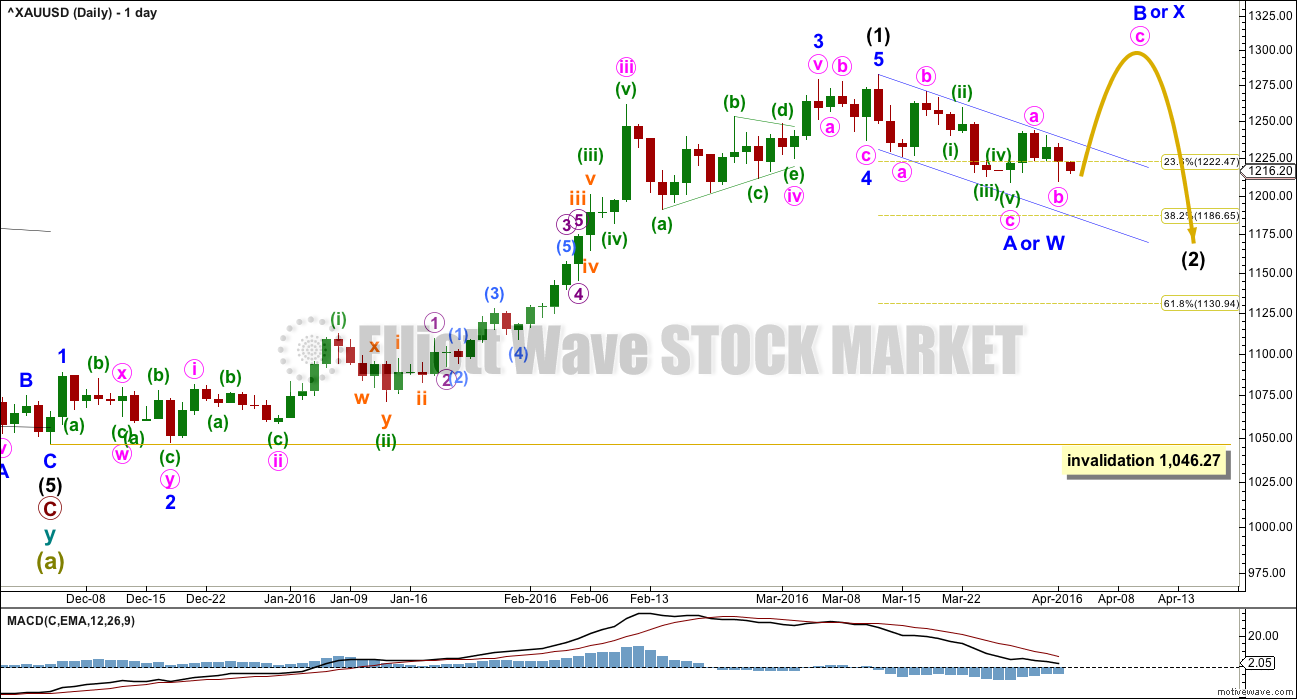
Intermediate wave (1) is a complete impulse. Intermediate wave (2) may have begun. COT supports this wave count; the majority of commercial traders are short (as of 29th March). While this does not pinpoint when price should turn, it does support a larger downwards trend about here.
The first movement down within intermediate wave (2) subdivides as a three, not a five if it is over at the low labelled minor wave A or W. This indicates intermediate wave (2) is not unfolding as the most common zigzag, so it may be unfolding as a flat, combination or double zigzag. The first three down may be minor wave A of a flat or minor wave W of a double combination or double zigzag.
If the correction up labelled minor wave B or X is shallow, then intermediate wave (2) would most likely be a double zigzag. Double zigzags have a slope against the prior trend; they are not sideways movements. A double zigzag may end close to the 0.618 Fibonacci ratio at 1,131.
If the correction up labelled minor wave B or X is deep and reaches to 1,275.24 or above, then intermediate wave (2) would most likely be a flat or combination. These are both sideways movements. A combination or flat may end closer to the 0.382 Fibonacci ratio at 1,187.
A small channel is drawn about this downwards movement so far.
This wave count expects the upwards movement to be a counter trend movement. The trend remains down at intermediate wave degree. Minor wave B or X would be likely to look like a three wave structure at the daily chart level.
FIRST HOURLY ELLIOTT WAVE COUNT – MAIN WAVE COUNT
Click chart to enlarge.
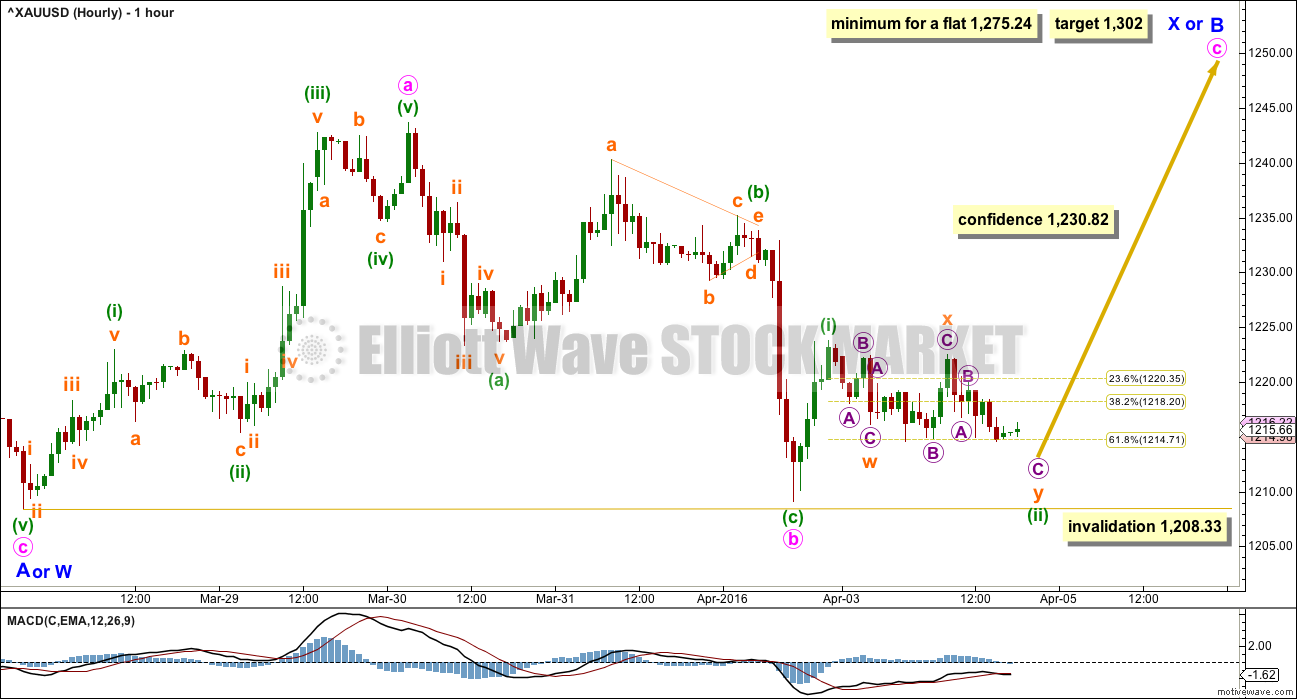
Minor wave A or W subdivides as a 5-3-5 zigzag. This structure is complete.
Minor wave B or X must subdivide as a corrective structure. This may be any one of 23 possible structures. The labelling will change as it unfolds. It is impossible for me to give you a road map for a B wave. They are the most difficult of all Elliott waves to analyse, and usually it is only clear what structure they take at the end. There is too much variety within B waves.
Within minor wave B, so far minute wave a looks best as a five and minute wave b looks best as a three. With a five up and a three down which did not make a new low, this wave count remains essentially the same.
Minute wave c is highly likely to make at least a slight new high above the end of minute wave a at 1,243.69 to avoid a truncation. At 1,302 minute wave c would reach 2.618 the length of minute wave a.
So far within minute wave c a first wave for minuette wave (i) may be complete, and now minuette wave (ii) may be almost complete. Minuette wave (ii) may end just below the 0.618 Fibonacci ratio of minuette wave (i) at 1,215.
It is also possible that minute wave b is incomplete and may continue further sideways as a triangle or combination. It may not move below the start of minute wave a at 1,208.33.
At 1,302 minute wave c would reach 2.618 the length of minute wave a. If minute wave c continues sideways, then this target must be recalculated.
If intermediate wave (2) is unfolding as a flat correction, then within it minor wave B must reach to 0.9 the length of minor wave A at 1,275.24 or above. Minor wave B may make a new high above the start of minor wave A at 1,282.68 as in an expanded flat.
If intermediate wave (2) is unfolding as a double combination, then there is no minimum requirement for minor wave X within it. It must only subdivide as a corrective structure. X waves within combinations are normally deep.
If intermediate wave (2) is unfolding as a double zigzag, then there is no minimum requirement for minor wave X within it; but minor wave X should not be deep, it should be shallow.
A new high above 1,230.82 would invalidate the second hourly wave count below at the hourly chart level. At that stage, some confidence may be had in the expectation of more upwards movement for the short term.
SECOND HOURLY ELLIOTT WAVE COUNT – MAIN WAVE COUNT
Click chart to enlarge.
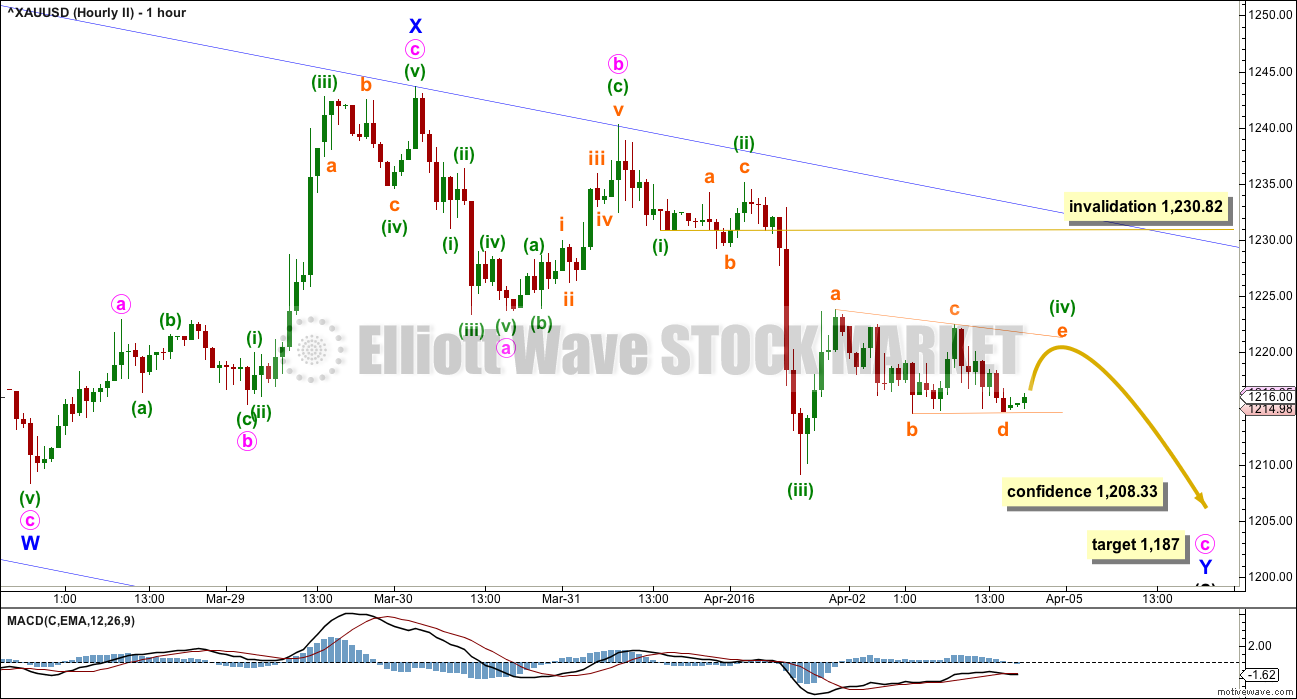
This wave count expects that intermediate wave (2) is unfolding as a double zigzag. These are common structures. The second zigzag in the double exists to deepen the correction when the first zigzag does not move price deep enough. To achieve this purpose the X wave is normally shallow and the whole structure has a slope against the prior trend. That description fits this movement so far at the daily chart level.
This wave count relies upon seeing the upwards wave labelled minor wave X as a complete three wave structure, a zigzag. This movement looks best as a five, but it will subdivide both as an impulse or a zigzag. It is ambiguous and impossible to tell for sure which of these two structures it is, so both possibilities should be considered.
If minor wave X is a complete zigzag, then it is shallow. Intermediate wave (2) could not be a flat correction because there is no B wave within it which is 0.9 the length of its A wave. A double zigzag is possible and meets the rules.
The first zigzag in the double labelled minor wave W ended just below the 0.236 Fibonacci ratio of intermediate wave (1). This fits the definition of not deep enough, particularly for a second wave correction.
Minute waves a and b may be complete within the second zigzag of minor wave Y. Minute wave c must subdivide as a five wave structure. At 1,187 minute wave c would reach 2.618 the length of minute wave a and intermediate wave (2) would end at the 0.382 Fibonacci ratio of intermediate wave (1). This target has a reasonable probability.
If intermediate wave (2) is unfolding as a double zigzag, then it may remain contained within the small blue channel drawn today on the daily chart and copied over here to the hourly chart.
The first indication that this idea is wrong would come with a breach of the upper edge of the dark blue channel.
Minuette wave (iv) may not move into minuette wave (i) price territory above 1,230.82.
ALTERNATE DAILY ELLIOTT WAVE COUNT
Click chart to enlarge.
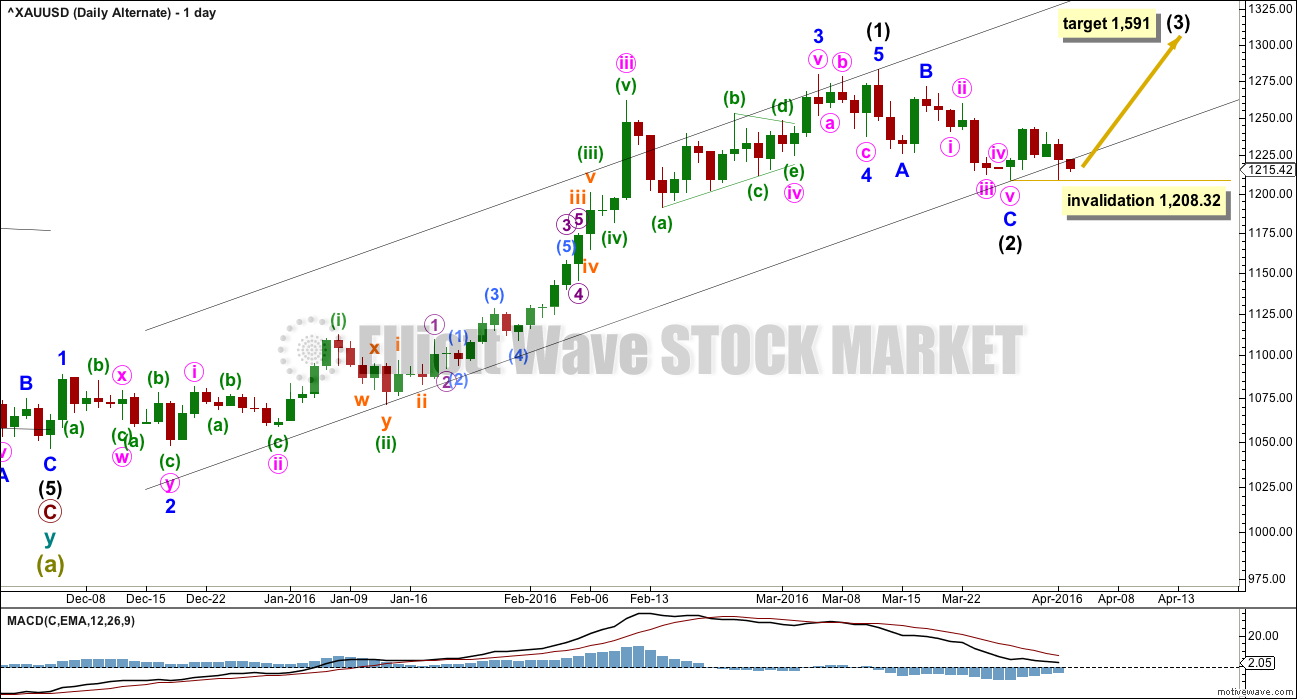
It is technically possible but highly unlikely that intermediate wave (2) is over. This wave count requires confirmation with a five up on the hourly chart for confidence. A new high is not confirmation of this wave count.
If intermediate wave (2) is over, then it is a very brief and shallow 0.31 zigzag lasting only eleven days (intermediate wave (1) lasted 69 days). The probability of this is very low.
At 1,591 intermediate wave (3) would reach 1.618 the length of intermediate wave (1).
Within intermediate wave (3), no second wave correction may move beyond its start below 1,208.32.
I do not want to give too much weight to this alternate by publishing an hourly chart. The subdivisions would be exactly the same as the main hourly chart.
The second alternate daily wave count will not be published today. It has a lower probability than the second hourly chart for the main wave count and is the same in expected direction.
TECHNICAL ANALYSIS
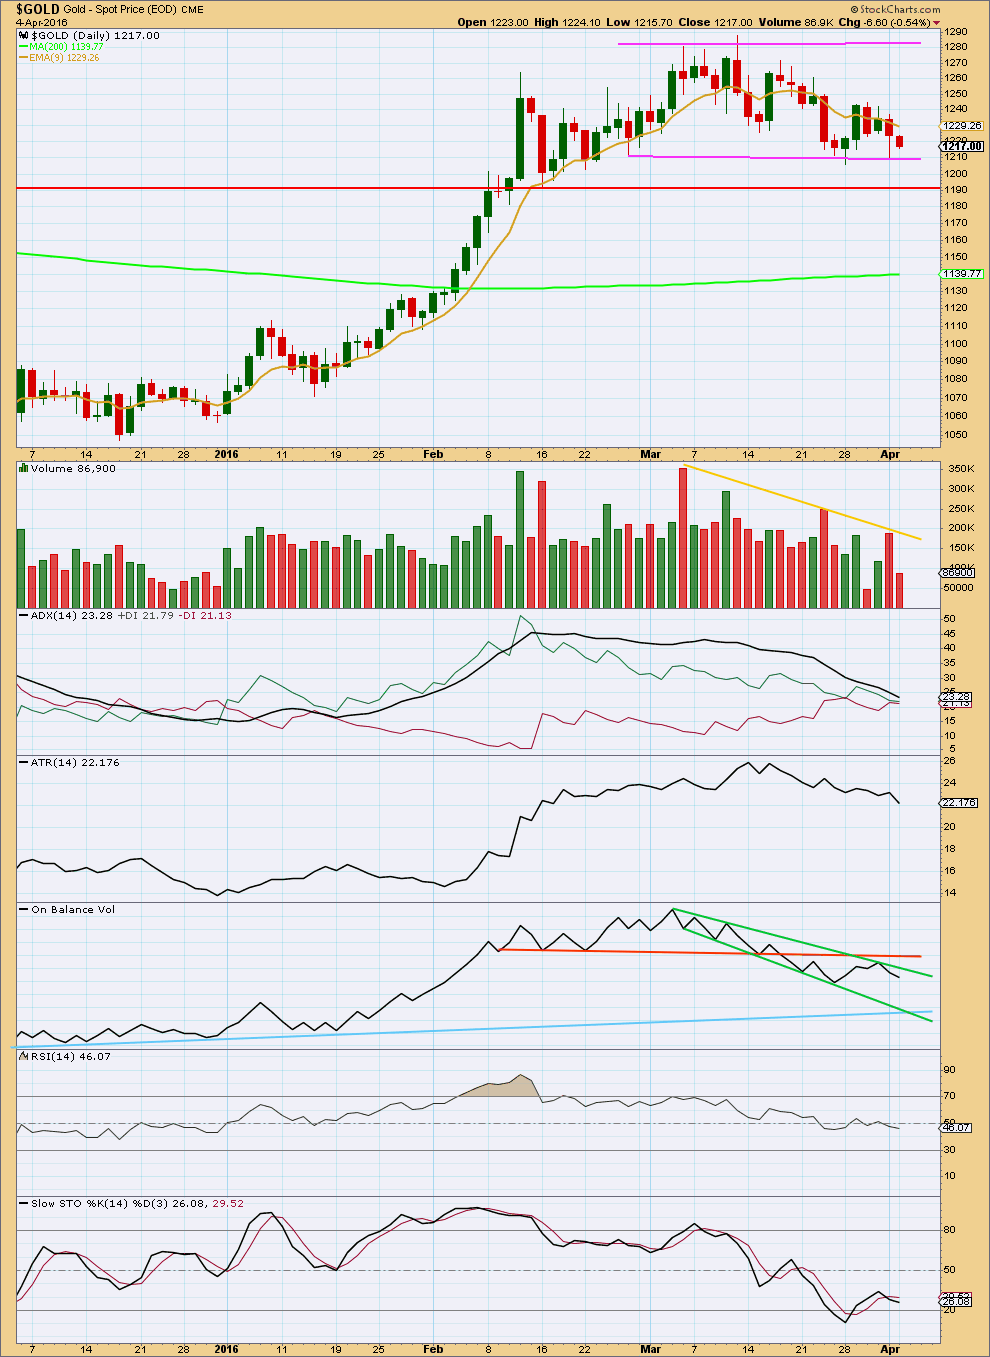
Click chart to enlarge. Chart courtesy of StockCharts.com.
Price is range bound between the pink trend lines, moving sideways. The upper edge is about 1,280 and the lower edge is about 1,210. It should be expected that price will swing from resistance to support and back again, eventually breaking out of the range for the next trend. Only experienced traders should attempt to trade this market while price remains range bound. The rest of us should wait for the next trend to emerge and then join it.
Stochastics may be used in conjunction with support and resistance to indicate each swing. At this stage, price has found support and Stochastics is just returning from oversold. An upwards swing should be expected from here until price finds resistance and Stochastics reaches overbought.
Ignoring the Elliott wave count which sees the end of the last wave up on 4th March, it is difficult to accurately state on which day price entered this current sideways trend. It could be as early as 12th February or as late as 14th March. The earlier date seems more reasonable.
If an earlier date is accepted, then during this sideways movement it is a downwards day which has strongest volume. This indicates a downwards breakout is more likely than upwards, which supports the main Elliott wave count.
ADX is declining indicating the market is not trending; it is consolidating. ATR agrees as it too is declining. Overall volume is declining as price moves sideways. All these indicators are in agreement with price: the market is range bound.
With lighter volume for Monday’s downwards day, there was no support for the fall in price. A small inside day on light volume does not clarify the situation; it is typical price behaviour during a consolidation.
RSI is neutral. There is room for price to rise or fall.
On Balance Volume is the one indicator which here is clear. OBV is bearish. This supports the main Elliott wave count which expects more downwards movement overall, but it does not indicate if price must fall right now or if an upwards swing may occur first. If price does move higher, then OBV may hold it down when it finds resistance at the upper green trend line.
This analysis is published @ 07:28 p.m. EST.
I like Alessandro’s triangle idea he’s posted below, the “if intermediate wave (1) is done” idea.
With this choppy sideways movement I think this has a really good probability. It does look like a triangle is unfolding sideways.
This will be an alternate today, but TBH I expect it has about an even probability with the main wave count.
I’ll still publish three wave counts today. The main and this alternate Alessandro posted below. They will have an even probability.
The third will be the intermediate (2) is over possibility. I expect it has a very low probability. But I’ll publish it anyway, with that warning.
Gold Had Its Best Quarter in a Generation. So Where Are the Investors?
By: Frank E. Holmes – Tuesday, 5 April 2016
http://news.goldseek.com/USFunds/1459872671.php
Gold rallies as stocks slump world-wide – Apr 5, 2016 1:00 p.m. ET
Metal is ‘moving higher today on the back of the risk-off trade’
http://www.marketwatch.com/story/gold-climbs-more-than-1-as-stocks-slump-worldwide-2016-04-05
If intermediate wave (1) is not done yet….
Possible. It fits.
But it has a big problem with proportions and trend channels. Minor 4 would be huge in relation to minor 2. And it has breached a channel, no matter how its drawn, about intermediate (1).
Now this could be possible. Fourth waves aren’t always contained within channels, and double combinations (particularly ones containing triangles) are more time consuming than double zigzags.
But I expect it has a low probability.
The first chart you posted below has a higher probability.
If intermediate wave (1) is done……
I like it.
I think this idea is a high probability.
How low can gold retrace today?
Anyone buying long this morning as miners getting hit hard and gold may go minimum above 1243.69 or much higher. Yet FED FOMC Wednesday at 2:00 pm.
It ought to have completed minuette 4 (of main count) at 1226.74. I can see a distinct A-B-C down with the 5th subwave of C completed. But I’ll give it a 1-2 on minuette 5 before going in for the 3rd subwave. Feeling a bit cautious ahead of FOMC minutes release.
Amazing how low GDX dropped to 19.555 at 10:06 am. I hesitated and missed buying it at that great price. I’ll watch for the 1-2 of minuette wave 5, although I don’t see GDX dropping as low as 19.555.
I believe that the last FOMC news and news release gold went up on both.
I think that the 1-2 for minuette wave 5 ended at 12:20 pm at 1227.23 and GDX only dropped 10 cents down to 19.93. Today’s GDX low was 19.555 when gold hit 1226.74 at 10:29 am after a $4 drop in 30 minutes from 9:51 am, which spooked GDX owners into dumping it down to just 4 cents above Monday’s low of 19.51 when gold was at 1215 at the close.
FOMC – WEDNESDAY, APRIL 6th 2:00 pm EST -FED – FOMC minutes from 3/16
A small query lara..
In an impulse can a 3rd wave be shorter than 1st wave…??
Yes, but if the 3rd wave is shorter than the 1st wave, then the 5th wave must be shorter than the 1st and 3rd waves. The rule is that the 3rd wave cannot be the shortest.
Thanks dreamer
Thanks Dreamer 🙂
Hi lara..
Thanks for the alternates…
Gold has given an upward breakout…for now main count is on the way and at this moment i can see 3rd up starting on the hourly chart..now its 3 of what degree…the time will say…i am long and will sell once i see 5 on the hourly chart…and look for laras nxt analysis for further trade…
Thank you…have a gr8 trading day
Great. It looks like finally we have some clarity. And it was the main wave count.
So now the target is to 1,275.24 as reasonably likely as a minimum, or to 1,302.
A note about those targets: the price point of 1,275.24 is a minimum for a flat for intermediate (2). But intermediate (2) doesn’t have to be a flat so that price point doesn’t have to be reached.
If intermediate (2) is going to be a double zigzag then the target will be too high.
As soon as minute c moves above minute a at 1,243.69 then I will be looking for a complete structure within minute c. It has to be a five.
As soon as it has avoided a truncation by moving above 1,243.69 and it looks like a potentially complete five, then it could be over. The targets don’t have to be reached.
There are still multiple structural options that intermediate wave (2) may be and it is impossible for me to tell you which one it will be.
All I can say is an expanded flat or double zigzag are the two most likely, only because they would see intermediate (2) end much deeper than it has reached so far.
Yes lara…i got ur point…
To be safe i vl surely look to keep a tight stop once price moves higher..
🙂
From 8:00 pm EST gold went up $12 to $1,226.97 at 10:07 pm, however if goes above 1,230.82 it indicates to about $1,302 or if goes below 1,208.33 would indicate to about $1,187.