
The situation is still unclear.
Three Elliott wave counts are presented today.
Summary: Sideways movement is unconvincing as a C wave up. A break now above 1,236.56 would indicate more upwards movement as likely to above 1,275.24 and maybe as high as 1,302. A break below 1,223.83 at this stage would indicate a triangle may complete and be followed by a downwards breakout to about 1,131.
New updates to this analysis are in bold.
Last published weekly chart is here.
MAIN DAILY ELLIOTT WAVE COUNT
Click chart to enlarge.
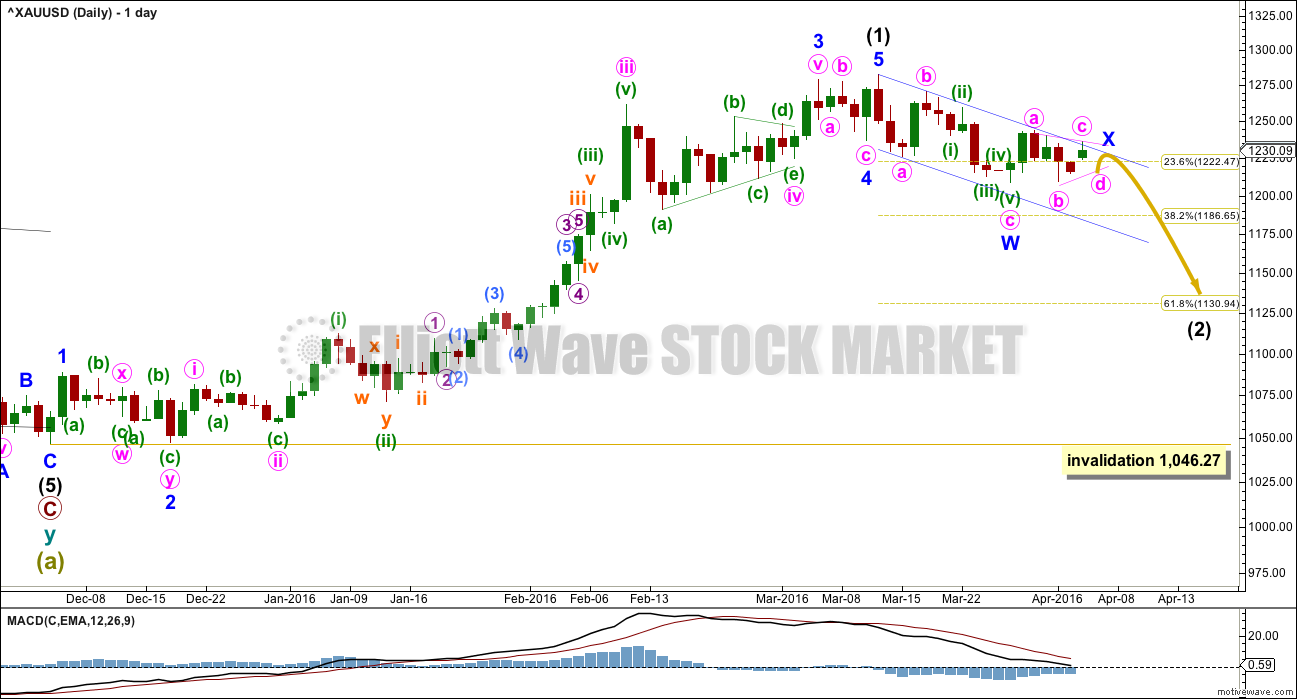
Intermediate wave (1) is a complete impulse. Intermediate wave (2) may have begun. COT supports this wave count; the majority of commercial traders are short (as of 29th March). While this does not pinpoint when price should turn, it does support a larger downwards trend about here.
The first movement down within intermediate wave (2) fits as a zigzag. So far movement to follow it is sideways, moving in an ever decreasing range.
At this stage, it looks like intermediate wave (2) may be unfolding as a double zigzag. The first hourly chart follows this idea.
Intermediate wave (2) may also still be relabelled A-B-C; it may still be unfolding as a flat correction. The second hourly chart looks at this possibility.
Within double zigzags, the second zigzag exists to deepen the correction when the first zigzag does not move price deep enough. Here, minor wave W ends just below the 0.236 Fibonacci ratio fitting the description of “not deep enough” for a second wave correction. The second zigzag in the double should be expected to deepen the correction; minor wave Y may end about the 0.618 Fibonacci ratio at 1,131.
To achieve the purpose for the second zigzag to deepen the correction the X waves of double zigzags are normally shallow. A triangle for minor wave X would be a shallow correction. The whole structure would have the right look for a double zigzag.
The dark blue channel is a best fit and is so far showing where price is finding support and resistance along the way down.
Intermediate wave (2) may not move beyond the start of intermediate wave (1) below 1,046.27.
FIRST HOURLY ELLIOTT WAVE COUNT – MAIN WAVE COUNT
Click chart to enlarge.
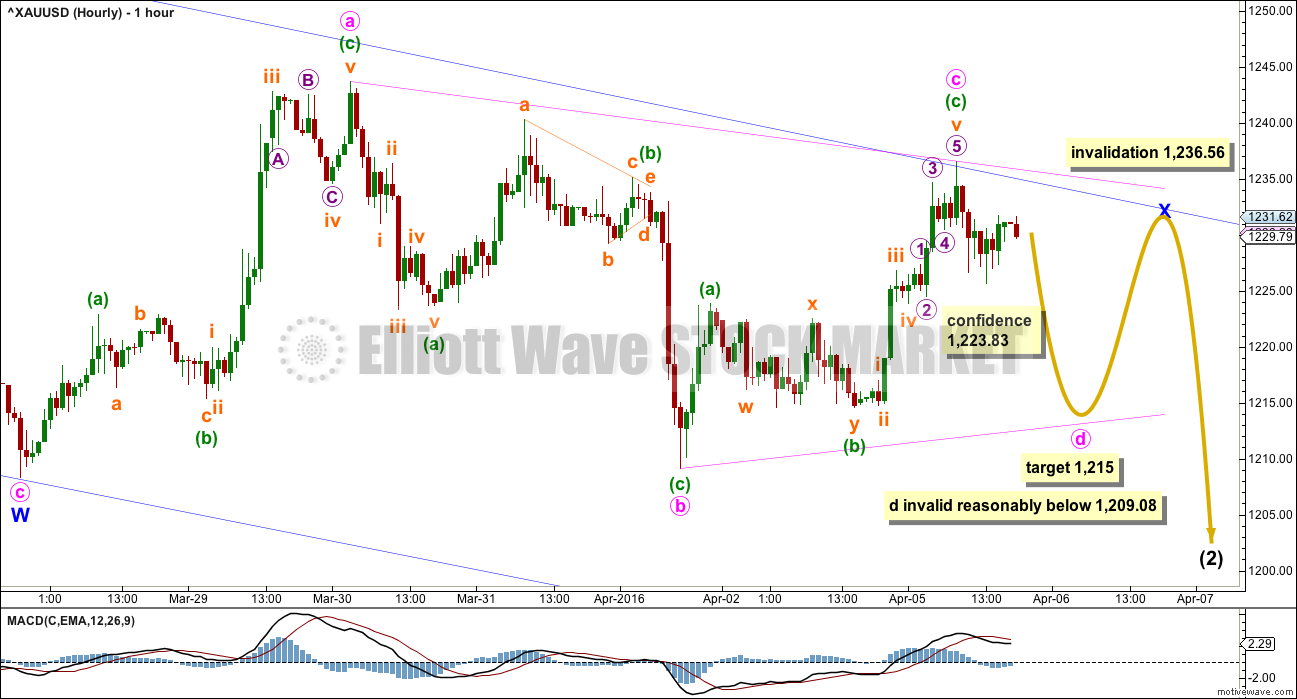
Minor wave W subdivides as a 5-3-5 zigzag.
Minor wave X may be any corrective structure. At this stage, it looks like it is unfolding sideways as a regular contracting or barrier triangle, the most common type of triangle.
Within the triangle, minute wave c found resistance at the upper edge of the dark blue channel, copied over from the daily chart. Minute wave c should be over here and it is 0.8 the length of minute wave b. A common length for subwaves of triangles in my experience is about 0.8 to 0.85 the prior wave.
MACD does not support this wave count. Often, as triangles unfold, MACD hovers close to the zero line. This is often seen but not always. That it is not clearly happening here does not mean a triangle is not unfolding, so it just slightly reduces the probability. Alternates should be considered.
A new low below 1,223.83 would indicate that the last wave up was a three and is complete. That would add confidence to this wave count. But the triangle may yet morph into a combination. Both are sideways movements and both at this stage would be incomplete.
Minute wave d of a contracting triangle may not move below the end of minute wave b at 1,209.08. Minute wave d of a barrier triangle may end about the same level of minute wave b at 1,209.08 so that the B-D trend line is essentially flat. What this means in practice is minute wave d may end slightly below the end of minute wave b and the triangle would remain valid. This is the only Elliott wave rule which is not black and white.
Minute wave e of the triangle may not move beyond the end of minute wave c above 1,236.56.
If price drifts sideways for another couple of days and MACD starts to flatten off at the zero line, then this wave count would increase in probability. If that happens, I will continue to consider alternates because in the case of triangles this is essential.
If the triangle completes as labelled, then the breakout should be downwards. Minor wave Y may take price down to the 0.618 Fibonacci ratio, and it may last about two weeks.
I would judge this first wave count to have a slightly higher probability than the second wave count below.
SECOND HOURLY ELLIOTT WAVE COUNT – MAIN WAVE COUNT
Click chart to enlarge.
This was the first main wave count yesterday.
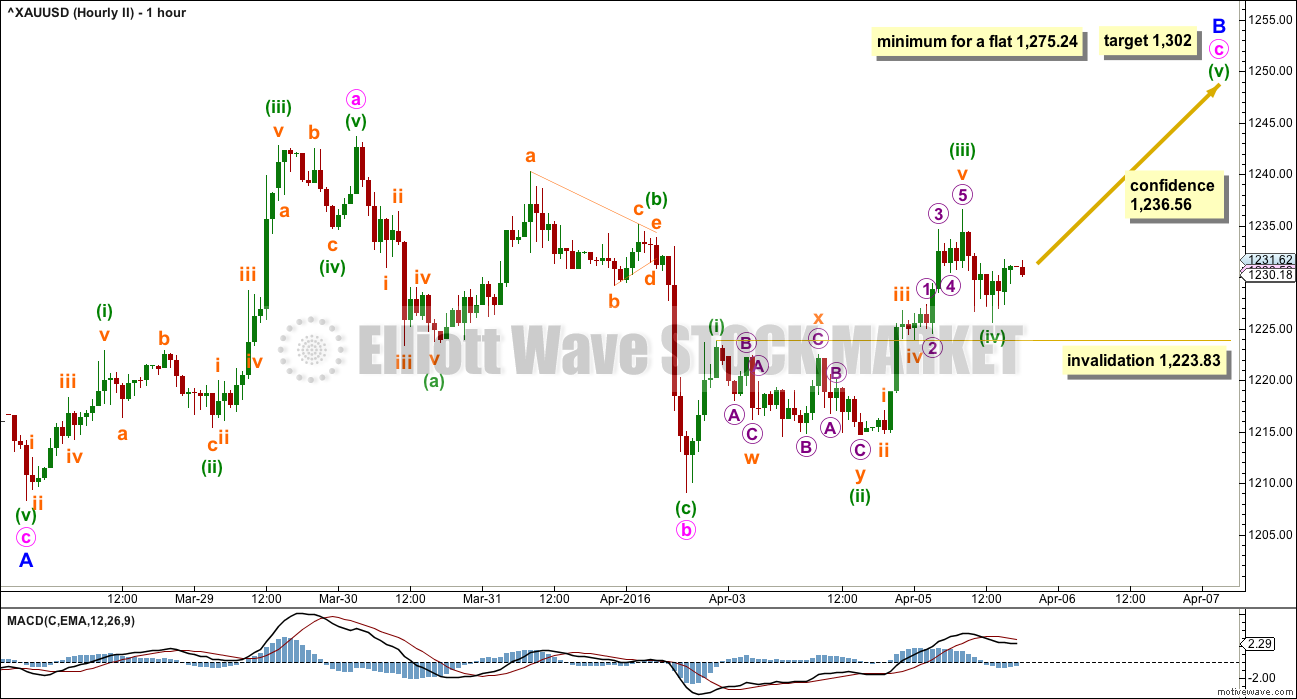
Upwards movement to start minute wave c is so far not looking very convincing. It has failed to make a new high above the end of minute wave a, but it may yet do so. If price makes a new high above 1,236.56, then this wave count would be favoured. At that stage, minor wave B may be unfolding as a zigzag.
If minor wave B is unfolding as a zigzag, then it may be deep enough to reach 0.9 the length of minor wave A at 1,275.24. If that price point is met, then the target is 1,302 where minute wave c would reach 2.618 the length of minute wave a. Intermediate wave (2) would be a very common expanded flat correction.
Minor wave B does not have to reach the minimum for a flat correction. If upwards movement moves beyond the end of minute wave a at 1,243.69, then as soon as minute wave c could be seen as a complete five wave impulse then it may be over. Minor wave B may be a shallow zigzag and would have to be relabelled minor wave X. Then intermediate wave (2) would be a double zigzag and minor wave X within it could be a shallow zigzag.
Minute wave c must be a five wave structure. Within minute wave c, minuette wave (iv) may not move into minuette wave (i) price territory below 1,223.83.
Considering price behaviour over the last few days, it is my judgement that this wave count has a slightly lower probability than the first hourly chart.
ALTERNATE DAILY ELLIOTT WAVE COUNT
Click chart to enlarge.
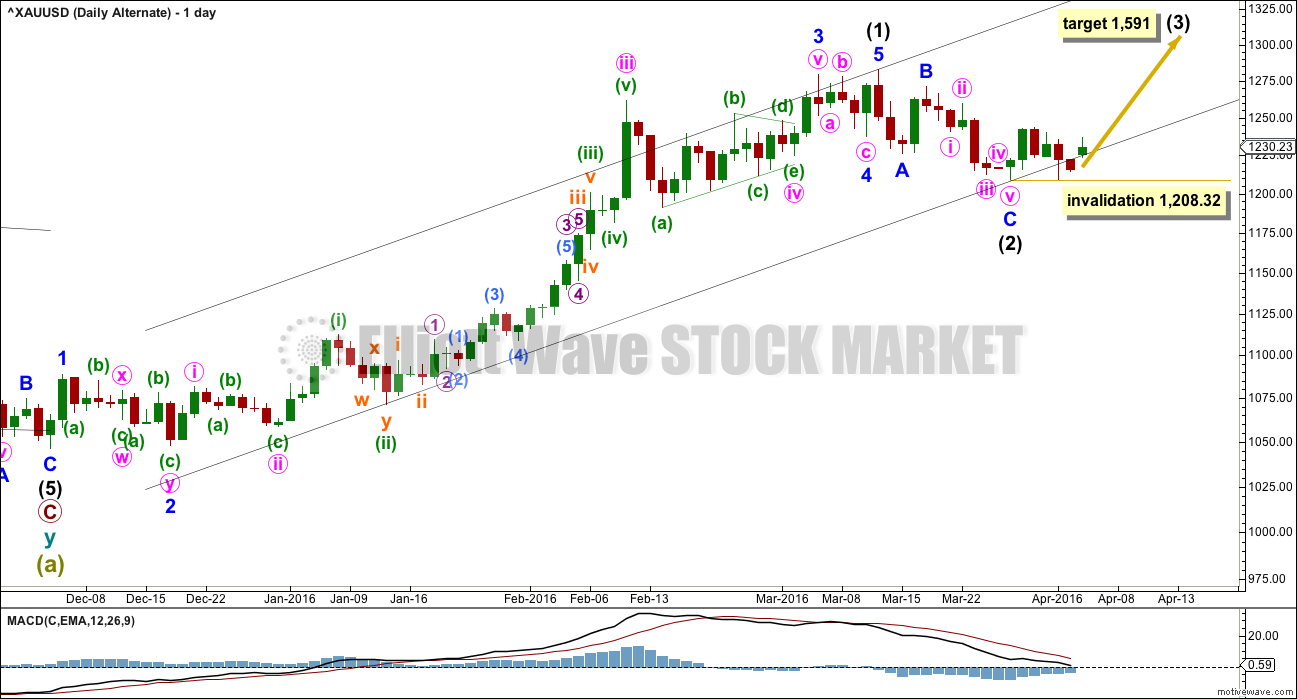
It is technically possible but highly unlikely that intermediate wave (2) is over. This wave count requires confirmation with a five up on the hourly chart for confidence. A new high is not confirmation of this wave count.
If intermediate wave (2) is over, then it is a very brief and shallow 0.31 zigzag lasting only eleven days (intermediate wave (1) lasted 69 days). The probability of this is very low.
At 1,591 intermediate wave (3) would reach 1.618 the length of intermediate wave (1).
Within intermediate wave (3), no second wave correction may move beyond its start below 1,208.32.
I do not want to give too much weight to this alternate by publishing an hourly chart. The subdivisions would be exactly the same as the main hourly chart.
TECHNICAL ANALYSIS
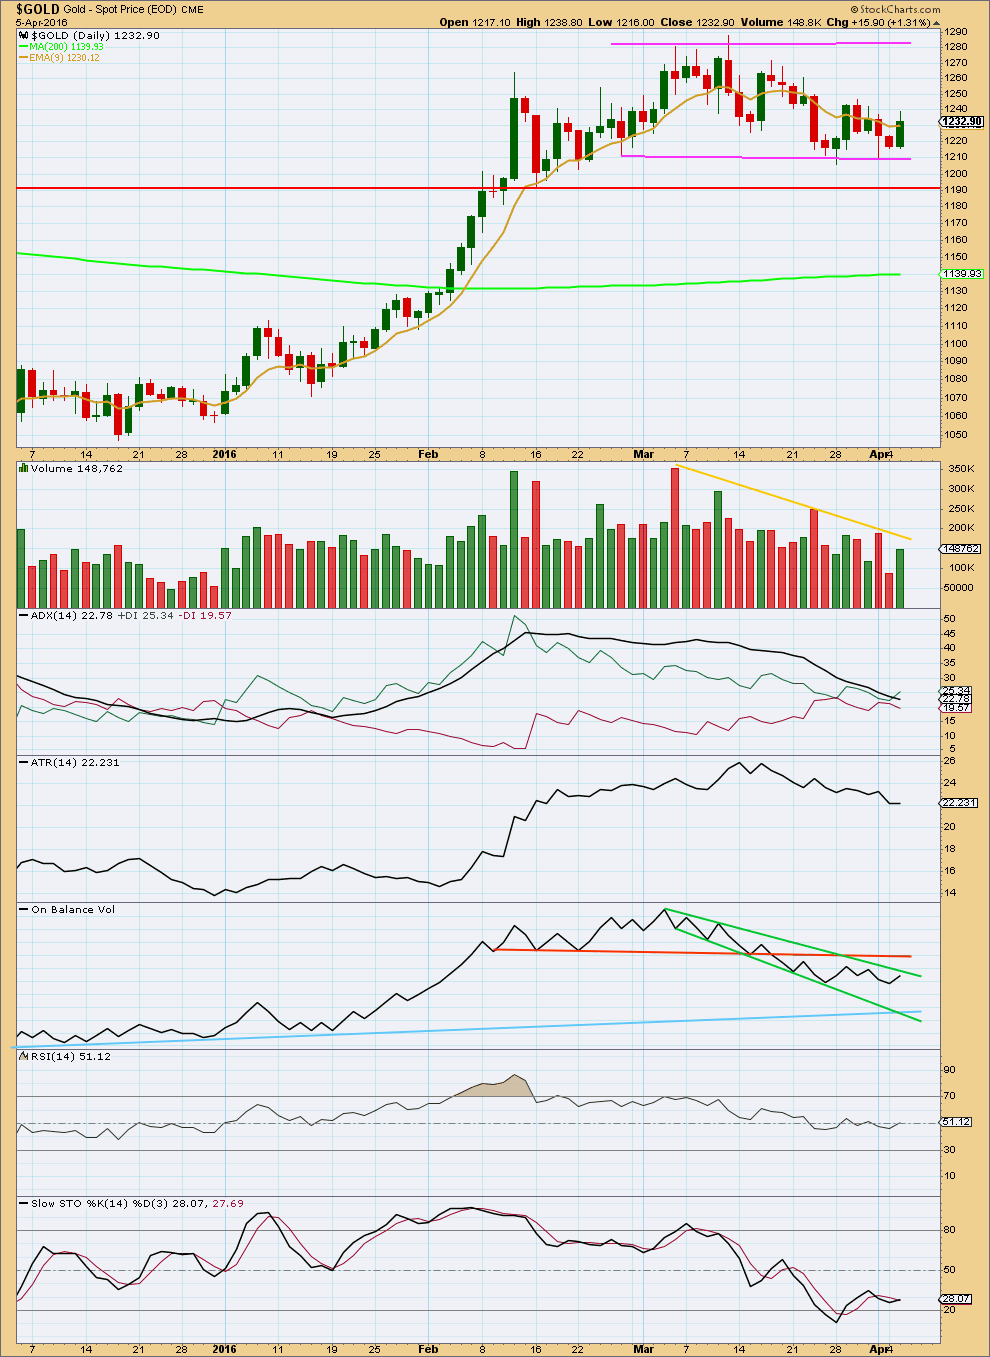
Click chart to enlarge. Chart courtesy of StockCharts.com.
Price is range bound between the pink trend lines, moving sideways. The upper edge is about 1,280 and the lower edge is about 1,210. It should be expected that price will swing from resistance to support and back again, eventually breaking out of the range for the next trend. Only experienced traders should attempt to trade this market while price remains range bound. The rest of us should wait for the next trend to emerge and then join it.
Stochastics may be used in conjunction with support and resistance to indicate each swing. At this stage, price has found support and Stochastics is just returning from oversold. An upwards swing should be expected from here until price finds resistance and Stochastics reaches overbought.
Ignoring the Elliott wave count which sees the end of the last wave up on 4th March, it is difficult to accurately state on which day price entered this current sideways trend. It could be as early as 12th February or as late as 14th March. The earlier date seems more reasonable.
If an earlier date is accepted, then during this sideways movement it is a downwards day which has strongest volume. This indicates a downwards breakout is more likely than upwards, which supports the main Elliott wave count.
ADX is declining indicating the market is not trending; it is consolidating. ATR agrees as it too is declining. Overall volume is declining as price moves sideways. All these indicators are in agreement with price: the market is range bound.
Overall, volume continues to decline as price moves sideways. There was some support for the rise in price on Tuesday, but volume for Tuesday is still light.
RSI is neutral. There is room for price to rise or fall.
On Balance Volume is the one indicator which here is clear. OBV is bearish. This supports the main Elliott wave count which expects more downwards movement overall. OBV moved higher today and is now close to the upper green trend line. This line is close by. If that line serves to hold down any further upwards movement from price, that would support the first hourly chart for the main wave count over the second hourly chart. However, this line may not hold; it is not very technically significant. The orange line has more technical significance.
This analysis is published @ 07:38 p.m. EST.
Lara, how about considering that the “B” wave ,which we are supposedly in, all-ready occurred and that we are now in the very beginning of a third wave up ,in a “stealth “bull market ala 1976 -1977 and then on up to 1980, with minimal corrections (as the correction from 1291 to 1203( or 1205) or minute 2. In other words the bottom in Dec. 2015 was a C wave bottom at about 1045. ( Sorry I cant put n a chart), but you know what I mean. “I’ve got a few more years on you, babe, and thats all- I’ve had more chances to fly and more places to fall—- It aint that i’m wiser it’s just that I’ve had more time with my back to the wall- and I’ve just got a few more years on you ,babe, and that’s all” Willie Nelson
That’s basically the alternate.
Except I’ve labelled the first wave up at intermediate degree. So the correction is intermediate (2) not minute ii.
No matter what degree I label the upwards wave, the correction is the same degree (as whatever degree you choose to label the upwards wave). And no matter what degree it’s labelled it’s very shallow. Which is not what we should expect as most likely for a second wave.
So I’m publishing that idea (the gist anyway, the degree is different) but I still must judge it to have a low probability based upon most common market behaviour and most common Elliott wave tendencies.
In my mind your alternate is more likely based on what I am seeing in the miners. Many I follow are in bullish patterns, anticipating or already in some serious upward movement. I’m long some of them (although with some tight stops, just in case). There is a real risk of being left out in the cold if this really is a third wave up.
The first hourly chart for the main wave count has increased in probability.
The second hourly chart is invalidated.
This sideways movement looks like a triangle. But I will chart an alternate today; what if minor wave X is not a triangle but a combination? So many times what looks like a triangle morphs into a combination at the end. It is essential always to consider alternates when it looks like a triangle is forming.
So far a triangle fits perfectly. Minute wave e is most likely to fall short of the a-c trend line. Minute wave e looks to be too brief to be done yet.
Minute e may be a single zigzag, but it may be a more complicated time consuming structure because so far all other triangle subwaves are single zigzags. Minute e may be a triangle to complete a nine wave triangle.
Because none of the triangle subwaves so far are doubles minute wave d may yet move lower as a double. The lower invalidation point must remain the same today to allow for this possibility. However, I would consider it to have a low probability because minute d is now a typical length of minute c.
What does all that mean? Sideways movement for a while yet, followed by a downwards breakout. The breakout may come during a news release.
Gold, NUGT and GDX have fired bullish at 3 and 5 minutes bullish and MACD and EMA/SMA buys at 3:45 pm that is a positive sign for now..
Gold appears to be range bound since 2 pm as it has hit the top trend line then bottom twice each in pmbull.com 1 minute time frame and now heading back up.
Since 2:00 pm only the 1 minute has fired Buy bullish once then ended for both gold and GDX not 3 or 5 minutes or longer yet, just range bound consolidation.
My best count is that, for the main count, Minute D ended at 1217.08. Minute E could have ended, if it is 3 waves, at 1228.15, and this concludes Minor X. (If it is 5 waves, then it could hit 1231-1234). Which means that in all probability it would be downhill from here.
The other possibility is that 1228.15 is only the first of 3 waves in Minute E.
But, if you put faith in the alternate, price would rise above 1228.15 with the next target around 1260+.
So, it is still confusing at this stage. Anyone can see a clearer picture?
Alan I think you may be right. And the daily alternate is highly unlikely.
At this point we just follow which way gold goes at the 2:00 pm EST FOMC minutes release.
This site has very fast news especially useful for fast FOMC action, be aware that not all headlines have articles maybe just 1 sentence.
http://www.marketwatch.com/newsviewer
Think we are in B wave of A-B-C to complete E, targeting about 1234
Yup. That was the possibility I alluded to in my 2nd paragraph. The B wave may be ending soon. We’ll wait and see.
How can minutte E go beyond C..??
It will get invalidated..
C may be at 1236.56 so x/e just needs to stay below that., Lara’s trend line shows wave x / e around the 1232 area.
Unless wave e already ended in the 1228 area?
At 11:21 gold at 1221 turned up and then at 11:36 am broke out up on 1 minute at pmbull and gold reached up to 1228 at 11:52 am
At 11:21 am GDX fired bullish 1 minute and 5 minutes for NUGT and Gold.
GDX at 2018 now.
GDX has a buy for MACD and EMA/SMA for 5, 15, 39, 78, and 195 minutes but than may not last.
On main hourly chart there is an X wave that ends at 1231 area then drops.
The FOMC may end up bearish instead of bullish this time as Fed minutes may show consensus to raise rate in June see the article below.
At 11:21 gold at 1221 turned up and then at 11:36 am broke out up on 1 minute at pmbull.com and gold reached up to 1228 at 11:52 am
At 11:21 am GDX fired bullish 1 minute and 5 minutes for NUGT and Gold.
GDX at 2018 now.
At 11:53 am GDX and NUGT just dropped out of overbought zone on MoneyFlowIndex, which may be a sell signal.
On main hourly chart there is an X wave that ends at the 1231 area then drops or goes sideways..
The FOMC may end up bearish instead of bullish this time as Fed minutes may show consensus to raise rate in June see the article below.
Fed minutes may show less dovish central bank than advertised
Apr 6, 2016 8:32 a.m. ET
Broad agreement on raising interest rates this year
http://www.marketwatch.com/story/fed-minutes-may-show-less-dovish-central-bank-than-advertised-2016-04-05
First / Main Hourly chart already has confidence as gold moved below $1,223.83 and Second Hourly II already invalidated below $1,223.83.
Gold hit today’s low of 1217.08 at 8:40 am EST
First Hourly – main – “If price drifts sideways for another couple of days and MACD starts to flatten off at the zero line, then this wave count would increase in probability. If that happens, I will continue to consider alternates because in the case of triangles this is essential. If the triangle completes as labelled, then the breakout should be downwards. Minor wave Y may take price down to the 0.618 Fibonacci ratio ($1,131), and it may last about two weeks. I would judge this first wave count to have a slightly higher probability than the second wave count below.”
Triangle, sideways couple days or breakout down, and FOMC today , what a mix, clarity anyone?
Since the First Hourly main chart has confidence and the breakout should be downwards yet minor wave y may last 2 weeks to get to 1131 intermediate wave (2), then how may the FED FOMC minutes released at 2:00 pm EST react, could that be the breakout downwards point? Or maybe first up to end wave x/e to the 1232 area then sideways for days or down towards 1,131?
Gold is not behaving what it must behave in an impulse…
But a low of 1224.5 an hour ago seems like a double zigzag minutte 4 of C to me…good alteration with minutte 2..
Lets see if 1223.83 holds..
Hi lara and hello everyone..
If its happening to be triangle correction for X wave than what will be the intensity of wave Y…
Asking this because many times i have read in laras analysis that after a triangle the next wave usually will be swift n strong…
So by this can we assume that wave Y will actually be shorter.??..may be 1180ss..??..
It is fifth waves following triangles for Gold which are often surprisingly short and brief.
Wave Y should be about the same as wave W. Not short and brief. It’s not a fifth wave.
Ohh k…
Thanks for correcting me..
🙂
Wednesday FED FOMC 2:00 pm EST release of 3/16 minutes and 2 hourly wave counts to watch for.
Hi Lara, my question might be silly but may I know the which time time zone you use for the charts?
Gold is traded around the world in all time zones. EW analysis uses price action only and is not time zones depended.
Lara’s daily reports are issued after 4:00 PM Eastern time zone.
EW validation/invalidations are based on price action during any trading time.
Lara uses EST as the time on the charts match NYSE / EST.
Yes gold trades around the world, however charts are EST zone.
Thanks Richard
My pleasure.