
The main Elliott wave count so far is playing out as expected.
The main Elliott wave count expected a short swing down to about 1,215. Price moved lower and turned at 1,217.22.
Summary: A little upwards movement to 1,230 would end a triangle. Thereafter, price should break out downwards. If price comes up to touch the dark blue trend line, it should find strong resistance there providing a good opportunity to join the trend. Stops may be money management stops, just above the trend line, or just above 1,236.56. The risk is that the alternate hourly chart may be correct; it expects upwards movement to reach about 1,244 before turning. The risk that the alternate daily chart may be correct does exist, but the probability is very low.
New updates to this analysis are in bold.
Last published weekly chart is here.
MAIN DAILY ELLIOTT WAVE COUNT
Click chart to enlarge.
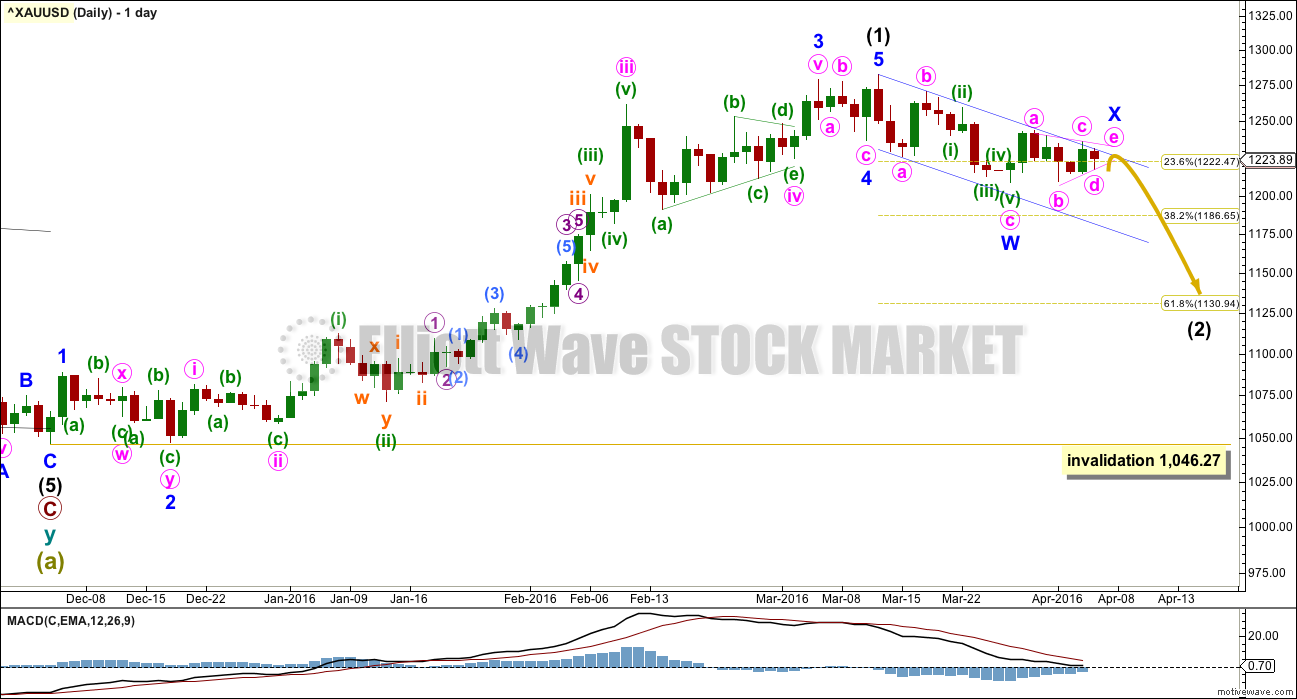
Intermediate wave (1) is a complete impulse. Intermediate wave (2) may have begun. COT supports this wave count; the majority of commercial traders are short (as of 29th March). While this does not pinpoint when price should turn, it does support a larger downwards trend about here.
The first movement down within intermediate wave (2) fits as a zigzag. So far movement to follow it is sideways, moving in an ever decreasing range.
At this stage, it looks like intermediate wave (2) may be unfolding as a double zigzag. Both hourly charts today follow this idea: the first hourly chart sees minor wave X as a triangle and the second looks at minor wave X as a flat.
Within double zigzags, the second zigzag exists to deepen the correction when the first zigzag does not move price deep enough. Here, minor wave W ends just below the 0.236 Fibonacci ratio fitting the description of “not deep enough” for a second wave correction. The second zigzag in the double should be expected to deepen the correction; minor wave Y may end about the 0.618 Fibonacci ratio at 1,131.
To achieve the purpose for the second zigzag to deepen the correction the X waves of double zigzags are normally shallow. A triangle for minor wave X would be a shallow correction. The whole structure would have the right look for a double zigzag.
The dark blue channel is a best fit and is so far showing where price is finding support and resistance along the way down. Draw it carefully on the daily chart on a semi-log scale and on the hourly chart on an arithmetic scale. Draw the first trend line from the high labelled intermediate wave (1) to the next high labelled minute wave b. Place a parallel copy on the low labelled minute wave a. Use the upper edge of the channel as a possible entry point to join the downwards trend, but beware the risk is the second hourly chart may be correct and the channel could be overshot before price turns back down. Manage the risk to your account carefully if choosing to trade this short term trend, and invest no more than 3-5% of equity on any one trade.
Intermediate wave (2) may not move beyond the start of intermediate wave (1) below 1,046.27.
FIRST HOURLY ELLIOTT WAVE COUNT – MAIN WAVE COUNT
Click chart to enlarge.
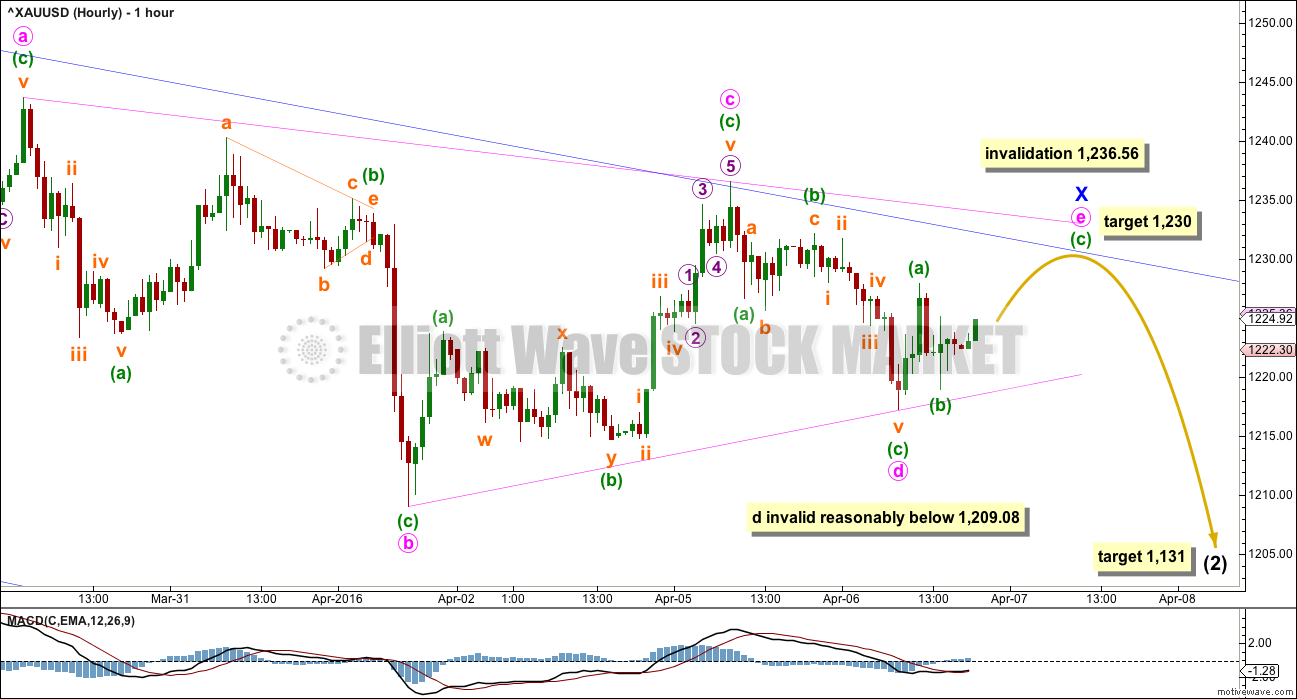
Minor wave W subdivides as a 5-3-5 zigzag.
Minor wave X may be any corrective structure. At this stage, it looks like it is unfolding sideways as a regular contracting triangle, the most common type of triangle.
Within the triangle, minute wave c found resistance at the upper edge of the dark blue channel, copied over from the daily chart. Minute wave c is 0.8 the length of minute wave b. A common length for subwaves of triangles in my experience is about 0.8 to 0.85 the prior wave.
Minute wave d within the triangle is most likely complete, but this cannot be stated for certain. One of the five subwaves of a triangle may be a multiple structure. So far none of the subwaves of this triangle have unfolded as multiples, so minute wave d could continue lower as a double zigzag.
If minute wave d continues lower, it may not move substantially below the end of minute wave b at 1,209.08. This invalidation point unfortunately is not black and white; minute wave d may end slightly below 1,209.08 and as long as the b-d trend line remains essentially flat the triangle would remain valid. Barrier triangles have flat b-d trend lines.
What looks more likely is minute wave d is complete and minute wave e upwards is underway. Minute wave e may unfold itself into a triangle to complete a nine wave triangle. Minute wave e may unfold as a double zigzag or single zigzag. All three options are open.
If minute wave e is a single zigzag as labelled, then at 1,230 minuette wave (c) would reach equality in length with minuette wave (a). If minute wave e finds resistance at the dark blue channel, then it would fall short of the triangle a-c trend line which is the most typical look for an e wave of a triangle.
When triangles are complete the breakout usually begins swiftly. The breakout from this triangle may come on a news release; it may be a price shock.
Intermediate wave (2) is still expected to end about 1,131.
SECOND HOURLY ELLIOTT WAVE COUNT – MAIN WAVE COUNT
Click chart to enlarge.
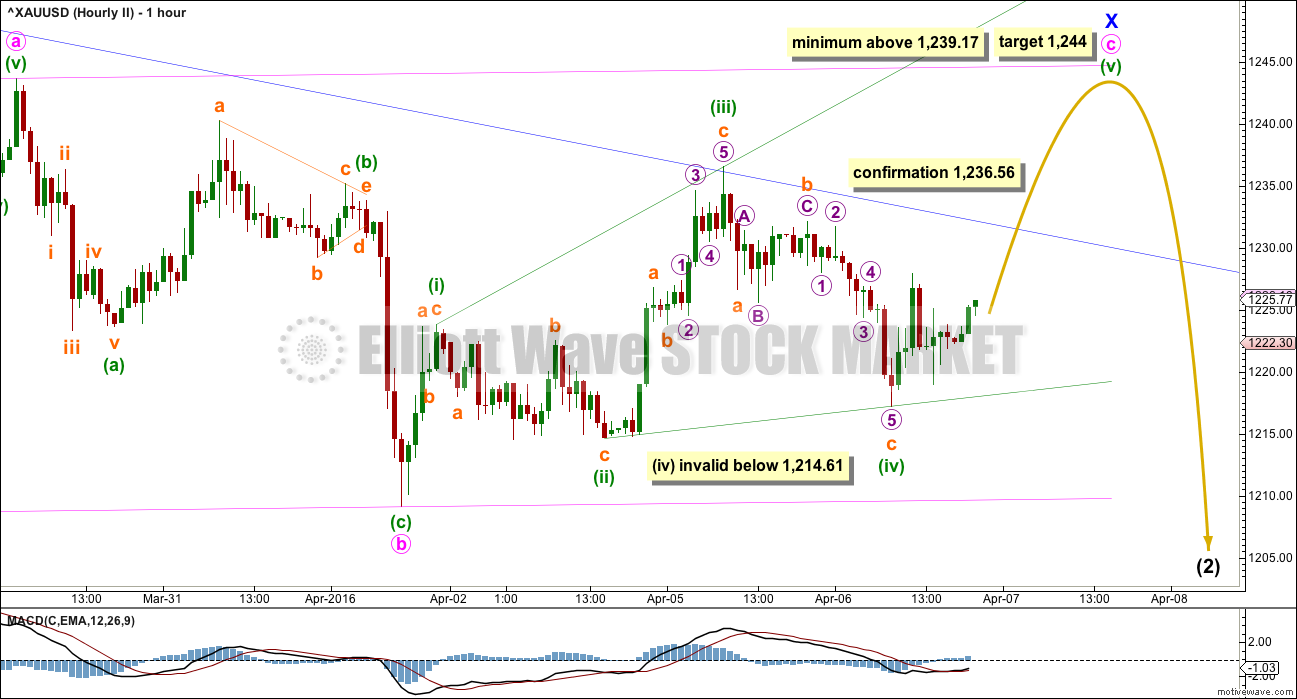
This wave count is identical to the first hourly chart up to the low of minor wave W (off to the left of this chart now). Minor wave W is a zigzag. Here, minor wave X is seen as a zigzag.
Triangles are tricky structures. It is essential to consider alternates when a triangle is suspected to be unfolding. Sometimes a triangle looks complete but is then invalidated at the end of the movement which turns out often to be a combination or flat correction.
What if the triangle is wrong? What else could be happening?
A combination for minor wave X does not work because minute wave a does not meet the rules of a flat correction and so far the movement labelled minute wave c does not either. Minor wave X would be very unlikely to be a double zigzag because the X wave within it is too deep; double zigzags normally have shallow X waves.
Minor wave X may be either a regular flat correction or a zigzag. Minute wave a will subdivide best as an impulse, but it will also subdivide as a zigzag.
Within the zigzag (or flat) of minor wave X, minute wave b is a 0.98 length of minute wave a. At 1,244 minute wave c would reach equality in length with minute wave a.
Minute wave c is not unfolding as an impulse. It may be unfolding as an ending expanding diagonal. All subwaves must subdivide as zigzags within an ending diagonal. The fourth wave must overlap first wave price territory but may not move beyond the end of the second wave below 1,214.61.
This diagonal is expanding. Minuette wave (v) must be longer than minuette wave (iii), ending above 1,239.17.
If price breaks above the dark blue trend line, then look for the next line of resistance at the upper edge of the pink channel.
This wave count is presented as a “what if?”. It is my judgement that it has a reasonably lower probability than the first hourly chart for two reasons:
1. While ending diagonals are reasonably common, the expanding variety is not.
2. The dark blue channel would be breached. This upper trend line has reasonable technical significance, so it is very likely to hold while the correction for intermediate wave (2) continues.
ALTERNATE DAILY ELLIOTT WAVE COUNT
Click chart to enlarge.
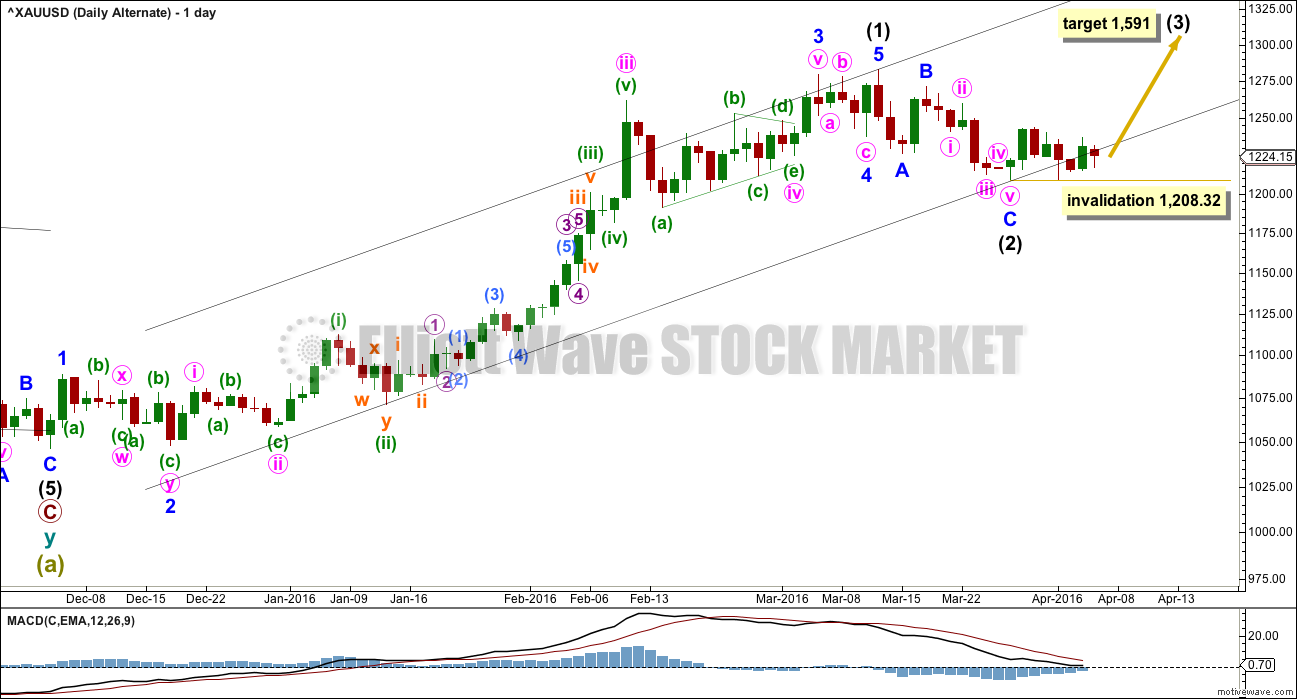
It is technically possible but highly unlikely that intermediate wave (2) is over. This wave count requires confirmation with a five up on the hourly chart for confidence. A new high is not confirmation of this wave count.
If intermediate wave (2) is over, then it is a very brief and shallow 0.31 zigzag lasting only eleven days (intermediate wave (1) lasted 69 days). The probability of this is very low.
At 1,591 intermediate wave (3) would reach 1.618 the length of intermediate wave (1).
Within intermediate wave (3), no second wave correction may move beyond its start below 1,208.32.
I do not want to give too much weight to this alternate by publishing an hourly chart.
TECHNICAL ANALYSIS
Click chart to enlarge. Chart courtesy of StockCharts.com.
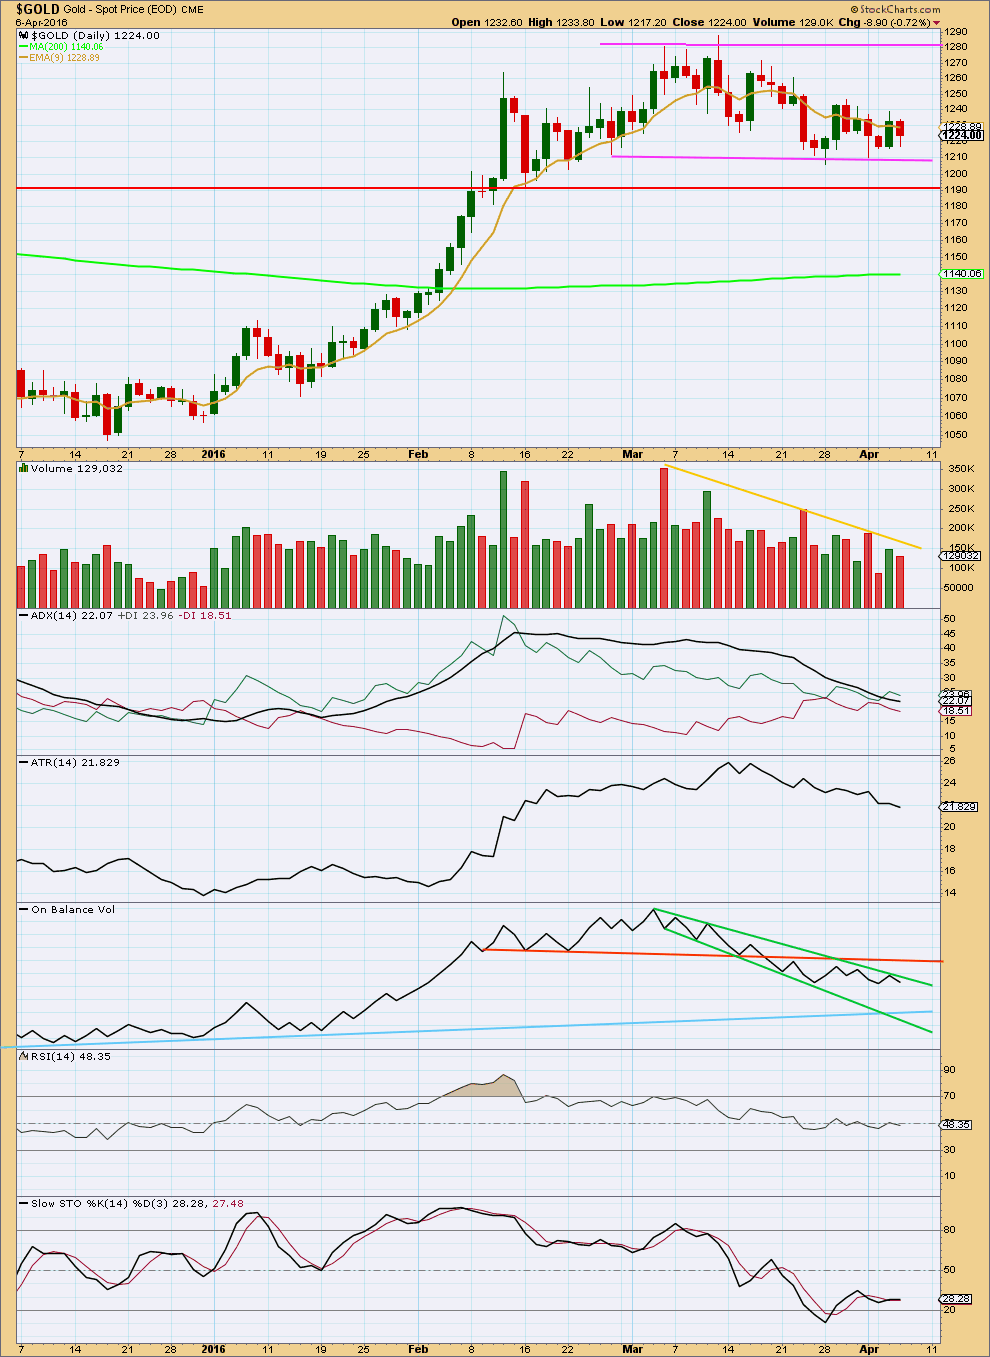
Price is range bound between the pink trend lines, moving sideways. The upper edge is about 1,280 and the lower edge is about 1,210. It should be expected that price will swing from resistance to support and back again, eventually breaking out of the range for the next trend. Only experienced traders should attempt to trade this market while price remains range bound. The rest of us should wait for the next trend to emerge and then join it. The Elliott wave count expects a breakout is imminent, which is supported by declining volume. The Elliott wave count anticipates the breakout will be down, which is also supported by volume. The Elliott wave count and the trend line on the daily chart offers an early entry to the potential trend, but taking this earlier entry necessarily involves a higher level of risk. The safer route would be to wait for price to break below 1,210 on a downwards day with increased volume to be confident of a breakout.
Ignoring the Elliott wave count which sees the end of the last wave up on 4th March, it is difficult to accurately state on which day price entered this current sideways trend. It could be as early as 12th February or as late as 14th March. The earlier date seems more reasonable.
If an earlier date is accepted, then during this sideways movement it is a downwards day which has strongest volume. This indicates a downwards breakout is more likely than upwards, which supports the main Elliott wave count.
ADX is declining indicating the market is not trending; it is consolidating. ATR agrees as it too is declining. Overall volume is declining as price moves sideways. All these indicators are in agreement with price: the market is range bound.
RSI is neutral. There is room for price to rise or fall.
On Balance Volume is the one indicator which here is clear. OBV is bearish. This supports the main Elliott wave count which expects more downwards movement overall. OBV has found resistance at the upper green trend line, reinforcing the strength of this line and supporting the main Elliott wave count and the first hourly chart. With OBV finding resistance at the green line and price finding resistance at the dark blue line, these two lines are working together to show currently where price ends upwards movement. If price again touches the dark blue line and OBV again touches the green line, it would be very likely that both turn down from there.
This analysis is published @ 09:26 p.m. EST.
Here’s a chart. There’s more than one way to count this upwards wave. This is just one.
A new low below 1,227.93 could not be a fourth wave correction within an impulse unfolding upwards, so at that point the upwards movement labelled minuette (v) would be over. That would provide reasonable confidence that the next wave down is underway.
Before that happens though some confidence may be had if price returns below the upper blue trend line. If it does that look for a throw back.
Price is now finding support at the upper edge of the dark blue channel. If price can break back below that line then I would have a little confidence that the next wave down is underway.
If it breaks below that line and then throws back I’ll try another entry short.
The structure could be complete. Minuette (v) of the ending expanding diagonal must be a zigzag (second hourly chart). It could be seen as a complete zigzag, or it could still continue further, the fifth wave could extend. The minimum is met. Now wait for indication of a trend change. The blue trend line should do that.
Target still 1,131.
February 3rd was the last day when gold was in the $1,130 area on that day. The JDST low was $22.5 now at 4.81 down 79%. The DUST low was $10.00 now at 2.81 down 72%.
They are both at their all time lows today as they are feared and unwanted.
I’m curious how high DUST and JDST may go if gold does drop to Lara’s target of $1,131 for intermediate wave (2) perhaps this month?
The ratios can be exciting, but to be fair, 3 x ETF’s suffer decay over time and the pricing is based on the GDM index with GDX also being a gauge. Gold just happens to be the vehicle that can influence the price.
3xETF’s decay however very slowly like a couple % a month
The rest was because gold went up and miners surged.
If gold drops to 1130 miners will crash and DUST will surged high.
Wave counts? Just want to double check that gold did complete the 5th subwave of minuette 5 of minute C of Minor B at 1243.37 at 9:44 am?
At this point gold is at 1235.97 down $7. Looking for gold to continue to drop swiftly.
Because if not completed than miners would surge if gold makes a new high today.
Perhaps Lara may provide a new upper invalidation point.
Gold may have surged overnight due to the FED FOMC minutes released Wednesday confirmed no April interest rate hike and the FED’s remaining dovish.
Oil dropping moves the markets down and gold up in the fear trade.
I’d like this to reverse direction as per Lara’s analysis.
U.S. stocks extend losses amid oil slump, currency-market jitters
Dow tumbles 160 points; haven assets like gold and the yen surge
The US dollar also weakened due to the FED FOMC
http://www.marketwatch.com/story/us-stocks-set-to-pause-dollar-crumbles-against-the-yen-2016-04-07
Thanks for replying! Your summary is much better than mine but the points are the same. Several reasons support gold strength. When the Fed minutes were released, gold dropped and then steadied. The Fed Minutes were overall hawkish although Yellen’s message was dovish. Overall, I wasn’t expecting much change in overnight hours since Yellen’s message was already priced in to the markets. Equities continue to fall throughout the day today and safe haven moves such as gold become the norm. Central Banks are stressed and any additional stimulus or Negative Interest Rates would only give gold more power to gold. Anyway…. just some additional thoughts as I look for further direction.
Reposting… may have been lost in the string below….
Hello Richard,
Thanks for your updates. With today having a pivotal feel, it’s encouraging to hear from you.
DUST is based on Gold Miners (GDX and GDM). Even though gold has stabilized at $1,239 – $1,240, DUST has fallen to $2.82 at the time of this post. It appears that the U.S. jobless claims figure was favorable news and that the “risk off” U.S. stock market transactions continue to favor gold pricing strength. Negative 1Q earnings and high valuations appear to be driving US stocks lower. The weak U.S. Dollar combined with $US/JPY concerns, European markets, Brexit, growth slow down in China, and a possible revised US GDP figure showing only 0.4% growth all appear to favor gold. I realize that waves are tracked, but thoughts were conveyed in posts that some sort of news would be the catalyst to drive gold down after it touched $1,244 and I think it mentioned that it would take place swiftly. Volume was always to be a strong focus and with today’s volume being strong on an “up” day for gold, is there something else possibly happening with the overall waves? Lastly, this alternate wave pattern that is now in effect was given a high probability of not panning out earlier. In general, I’m just trying to gauge your thoughts and what you view the next possible catalyst to drive down gold? Janet Yellen speaks tonight at 5:30 EST and it’s expected that she will continue with her very dovish tones…. drove gold higher 2 times previously. Thanks for offering your reply in advance!
Laraa
Can this move of today should be seen as C of triangle..??…actually completing today as a double zigzag..??
Looks accurate so far!
All in JDST at $4.86
That’s very low price on JDST wow just 2 cents off day low.
Any wave counts since now?
I’m looking to buy some DUST this morning now that gold has hit the upper target zone.
It’s either the 3rd or 5th subwave of minuette 5 of minute C of Minor B at 1243.37. I was debating but bought in a small amount of DUST at 2.85.
Anyway, the one to trade is oil this morning. Should be having a small correction down now. DWTI rose more than 5% as of now.
Alan that’s good to hear.
I bought into DUST at 10:17 am for $2.86.
Richard. Good to hear that you jumped on the bandwagon early. But, DUST is moving very slowly. Volume is pretty high, which means that most people are already in.
Exited DWTI 5 minutes ago. Kicked myself for missing TVIX. Now running away at 7.5% gain.
Alan, thanks. If gold does drop down to the $1,131 target area for intermediate wave (2) that a $110 dollar drop, which may move DUST up a good percentage increase. Hard to even estimate DUST price if gold drops to $1,131 area this month.
Lara mentioned gold may breakout down upon some news.
US jobless claims came out at 8:30 am EST this morning and and gold went up $6 since then. However it did also go up before that news.
8:34am Gold holds sharp gains after jobless claims
8:32am Treasury yields inch lower after jobless claims
8:32am S&P 500 futures down 0.4% at 4,516
8:32am Nasdaq 100 futures down 0.5% at 2,050
8:32am Dow futures down 0.4% at 17,552
8:31am U.S. jobless claims fall 9,000 to 267,000
8:31am U.S. stock futures hold losses after jobless claims
Hello Richard,
Thanks for your updates. With today having a pivotal feel, it’s encouraging to hear from you.
DUST is based on Gold Miners (GDX and GDM). Even though gold has stabilized at $1,239 – $1,240, DUST has fallen to $2.82 at the time of this post. It appears that the U.S. jobless claims figure was favorable news and that the “risk off” U.S. stock market transactions continue to favor gold pricing strength. The weak U.S. Dollar combined with $US/JPY concerns, European markets, Brexit, growth slow down in China, and a possible revised US GDP figure showing only 0.4% growth all appear to favor gold. I realize that waves are tracked, but thoughts were conveyed in posts that some sort of news would be the catalyst to drive gold down after it touched $1,244 and I think it mentioned that it would take place swiftly. Volume was always to be a strong focus and with today’s volume being strong on an “up” day for gold, is there something else possibly happening with the overall waves? Lastly, this alternate wave pattern that is now in effect was given a high probability of not panning out earlier. In general, I’m just trying to gauge your thoughts and what you view the next possible catalyst to drive down gold? Janet Yellen speaks tonight at 5:30 EST and it’s expected that she will continue with her very dovish tones…. drove gold higher 2 times previously. Thanks for offering your reply in advance!
I feel that gold may be lower by the close today.
GDX did tend to move up after the open even though gold began dropping sooner that the miners. Miners tend to take their time and move up adjusting to a higher gold price than the day before, however GDX and NUGT hit their highs of the day at 11:30 am and DUST hit it’s low.
I checked many time frames of MACD from 1 minute to 1 day and other indicators and feel that gold and the miners may drop lower by the close.
So I’ll hang on to the small amount of DUST I bought until as least Lara’s comments. Once miners do increase significantly in an up day they tend to drop with profit taking. At this time MACD for Gold and GDX are moving into sells in the 1,3,5,15 and 39 minute time frames, although this may change.
Gold reached up to a high of $1,243.37 today and that is in the upper range of Lara’s Second hourly target zone. Also the last high was March 30th at $1,244.32.
First hourly is invalidated above 1236.56. Hourly II is confirmed now, target is $1,244, already above minimum of $1,239.17.
When triangles are complete the breakout usually begins swiftly. The breakout from this triangle may come on a news release; it may be a price shock.
Within the zigzag (or flat) of minor wave X, minute wave b is a 0.98 length of minute wave a. At 1,244 minute wave c would reach equality in length with minute wave a.
This diagonal is expanding. Minuette wave (v) must be longer than minuette wave (iii), ending above 1,239.17.
If price breaks above the dark blue trend line, then look for the next line of resistance at the upper edge of the pink channel. Target 1244.
The alternate hourly chart may be correct; it expects upwards movement to reach about 1,244 before turning.
The risk that the alternate daily chart may be correct does exist, but the probability is very low.
Intermediate wave (2) is still expected to end about 1,131.
Main Hourly wave count is invalidated but the 2nd hourly is in play.
Soon here at 1240 or below wave X will complete and shorts will be happy!!!!
Lara:”Intermediate wave (2) is still expected to end about 1,131.”
Yaaa i agree with you papudi..but im not clear than why lara kept her stops at 1238..what is that she wanted us to beware of…
I can also count 5waves from yesterdays low of 1218..
Because of the trend line. I expected it to hold. It was a managed risk.
I’ll wait now for the upwards movement to be done.
Ok lara..
Laraa is it 3 or is it 5 from yesterdays low…u have x ray eyes u can see beyond..please if you can say.. 🙂
It could be either
Europe expects blood rain from desert Sahara!
Gold just hit an overnight high of $1,231.77 at 1:04 am EST.
Lara’s main hourly count upper target is at $1,230, which should be strong resistance.
If you look at the Daily time frame on http://www.pmbull.com you can clearly see the upper trend line since the March 11th high has just been hit this morning.
Now we watch if gold breaks down swiftly or less likely moves up to the second hourly wave count upper target of $1,244.
The main hourly upper invalidation point is at $1,236.56, above which would confirm the second hourly count.
There is US news this morning that gold may react to.
THURSDAY, APRIL 7 8:30 am EST weekly jobless claims.
“A little upwards movement to 1,230 would end a triangle. Thereafter, price should break out downwards. If price comes up to touch the dark blue trend line, it should find strong resistance there providing a good opportunity to join the trend. Stops may be money management stops, just above the trend line, or just above 1,236.56. The risk is that the alternate hourly chart may be correct; it expects upwards movement to reach about 1,244 before turning. The risk that the alternate daily chart may be correct does exist, but the probability is very low.”
I’ve opened a short at 1,228. Stop at 1,238.15. Target 1,131. Risk : reward ratio is 9.7. I’m risking only 2% of my equity on this one.
My main reason for going short here: the upper blue trend line. One of my favourite trend following techniques is to use a trend line. Each time price touches it enter the trend. It usually gives a good entry point, as long as the trend continues. For that I rely on the EW count.
Well that didn’t work. Second hourly is now the main wave count.
Lets see how this ends. It’s not done yet.