
A small inside day has not clarified which Elliott wave count is correct.
Summary: Downwards movement is most likely but a trend change is unconfirmed. A new low below 1,217.22 would confirm an end to sideways movement and the resumption of the downwards trend. A new high above 1,243.19 would indicate more upward movement first, the target for it to end is at 1,256.
New updates to this analysis are in bold.
Last published weekly chart is here.
MAIN DAILY ELLIOTT WAVE COUNT
Click chart to enlarge.
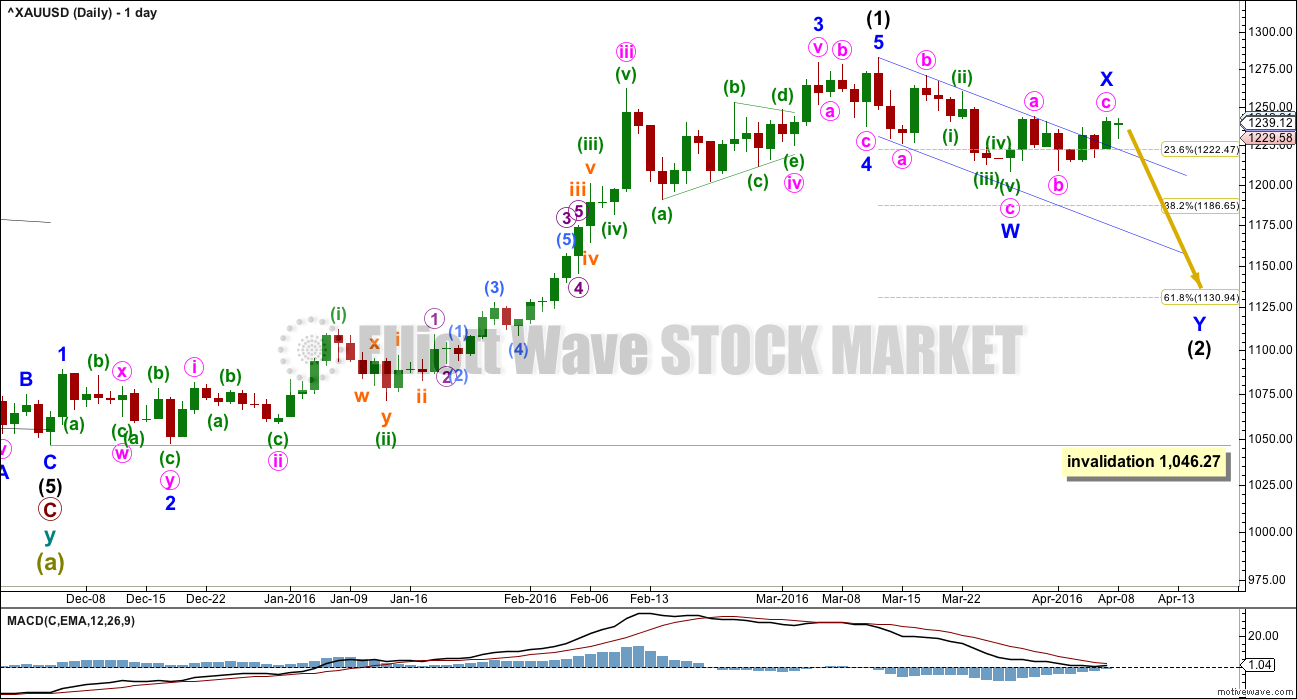
Intermediate wave (1) is a complete impulse. Intermediate wave (2) has begun and is most likely incomplete. COT supports this wave count; the majority of commercial traders are short (as of 4th April). While this does not pinpoint when price should turn, it does support a larger downwards trend about here.
The first movement down within intermediate wave (2) fits as a zigzag. So far movement to follow it is sideways.
At this stage, it looks like intermediate wave (2) may be unfolding as a double zigzag. Minor wave X may be a zigzag within the double.
Within double zigzags, the second zigzag exists to deepen the correction when the first zigzag does not move price deep enough. Here, minor wave W ends just below the 0.236 Fibonacci ratio fitting the description of “not deep enough” for a second wave correction. The second zigzag in the double should be expected to deepen the correction; minor wave Y may end about the 0.618 Fibonacci ratio at 1,131.
To achieve the purpose for the second zigzag to deepen the correction the X waves of double zigzags are normally shallow.
The dark blue channel is a best fit. If price returns to within the channel, then it should again show where upwards corrections find resistance.
It is possible that minor wave X may continue higher and be deeper. There is no upper invalidation point for minor wave X; X waves may make new price extremes beyond the start of the first structure in the double. If minor wave X continues higher, then intermediate wave (2) would more likely be a combination than a double zigzag. They are very different structures.
While double zigzags should have a slope against the prior trend, combinations should not. They are sideways structures. To achieve this the second structure in the double normally ends close to the same level as the first structure. In this instance, that would see intermediate wave (2) a very shallow correction failing to reach the 0.382 Fibonacci ratio. This is possible, but it has a low probability. This is the risk to the wave count today.
Intermediate wave (2) may not move beyond the start of intermediate wave (1) below 1,046.27.
MAIN HOURLY ELLIOTT WAVE COUNT
Click chart to enlarge.
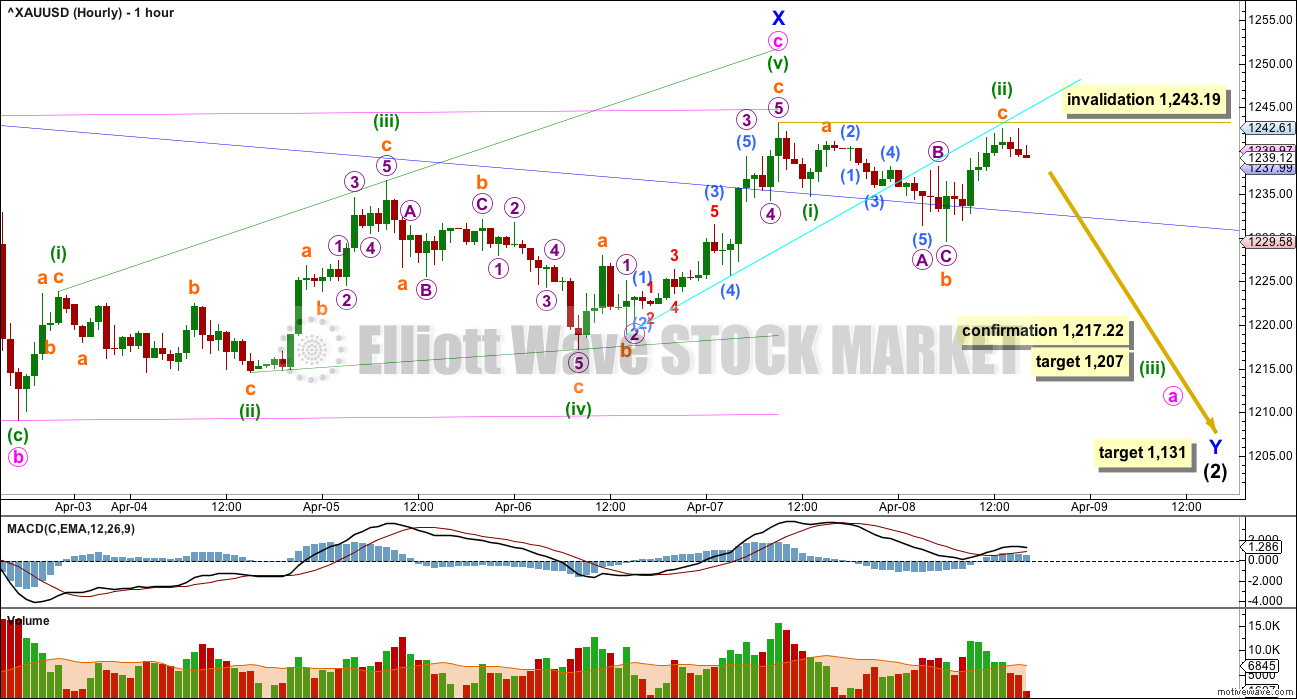
Minor wave X may be a zigzag.
Within the zigzag of minor wave X, minute wave b is a 0.98 length of minute wave a. Minute wave c is 1.25 short of equality in length with minute wave a.
Price broke below the cyan line and thereafter is finding resistance at the line. Volume declined as price moved higher. In the short term, this looks like upwards movement to end Friday’s session was a counter trend movement; the rise in price was not supported by volume. The prior fall in price had some support from volume.
If price breaks back below the dark blue line, more confidence may be had in a trend change. Thereafter, a new low below 1,217.22 would invalidate the alternate hourly chart below and confirm this main hourly wave count.
At 1,207 minuette wave (iii) would reach 4.236 the length of minuette wave (i).
The structure for minuette wave (ii) is an expanded flat correction. The subdivisions for this piece of movement have a slightly better fit for this main hourly wave count than the alternate below.
The target remains at 1,131 where intermediate wave (2) would reach the 0.618 Fibonacci ratio of intermediate wave (1).
ALTERNATE HOURLY ELLIOTT WAVE COUNT
Click chart to enlarge.
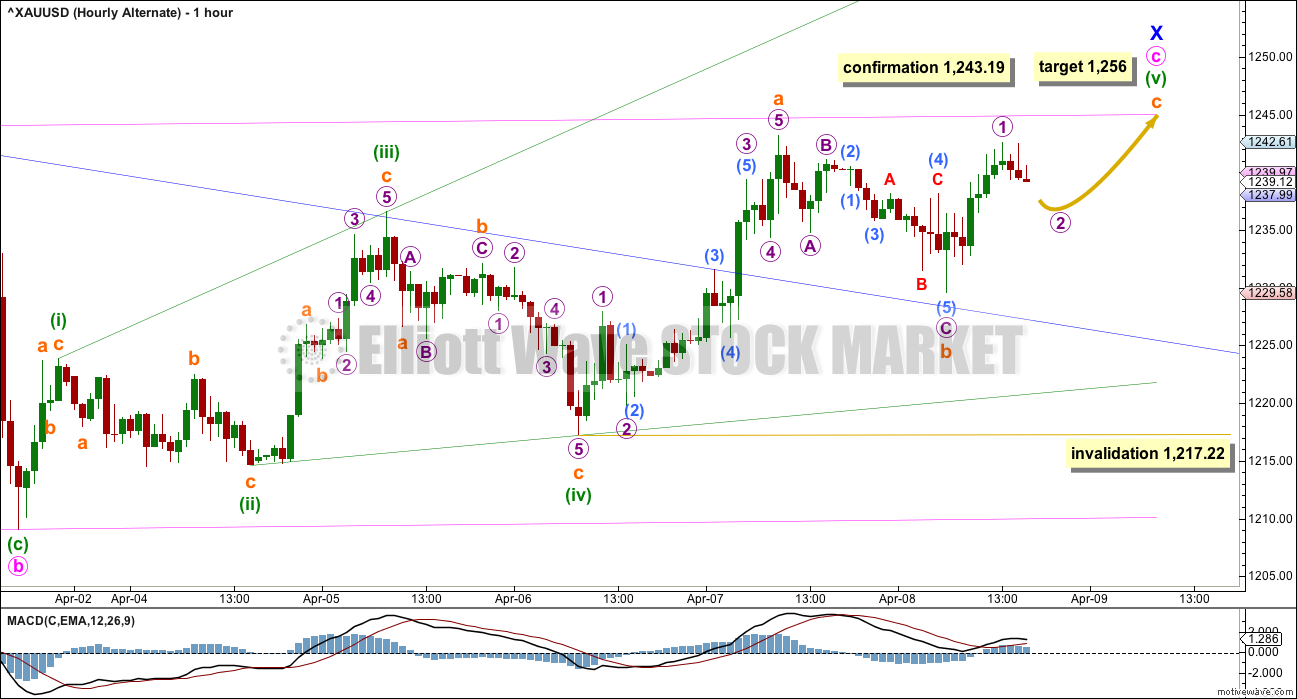
Minute wave c is seen as an ending expanding diagonal for both hourly wave counts.
All subwaves must subdivide as zigzags within an ending diagonal. The fourth wave must overlap first wave price territory. Within the final zigzag of minuette wave (b), the structure may be incomplete.
Subminuette wave a fits as an impulse. Subminuette wave b fits as a zigzag, but the proportions between submicro waves (2) and (4) give this part of the wave count not as good a look as the main wave count.
Although subminuette wave b is labelled as over here, it is also possible that it is incomplete. It may continue lower as a double zigzag or sideways as a flat correction.
Within the zigzag, subminuette wave b may not move beyond the start of subminuette wave a below 1,217.22.
ALTERNATE DAILY ELLIOTT WAVE COUNT
Click chart to enlarge.
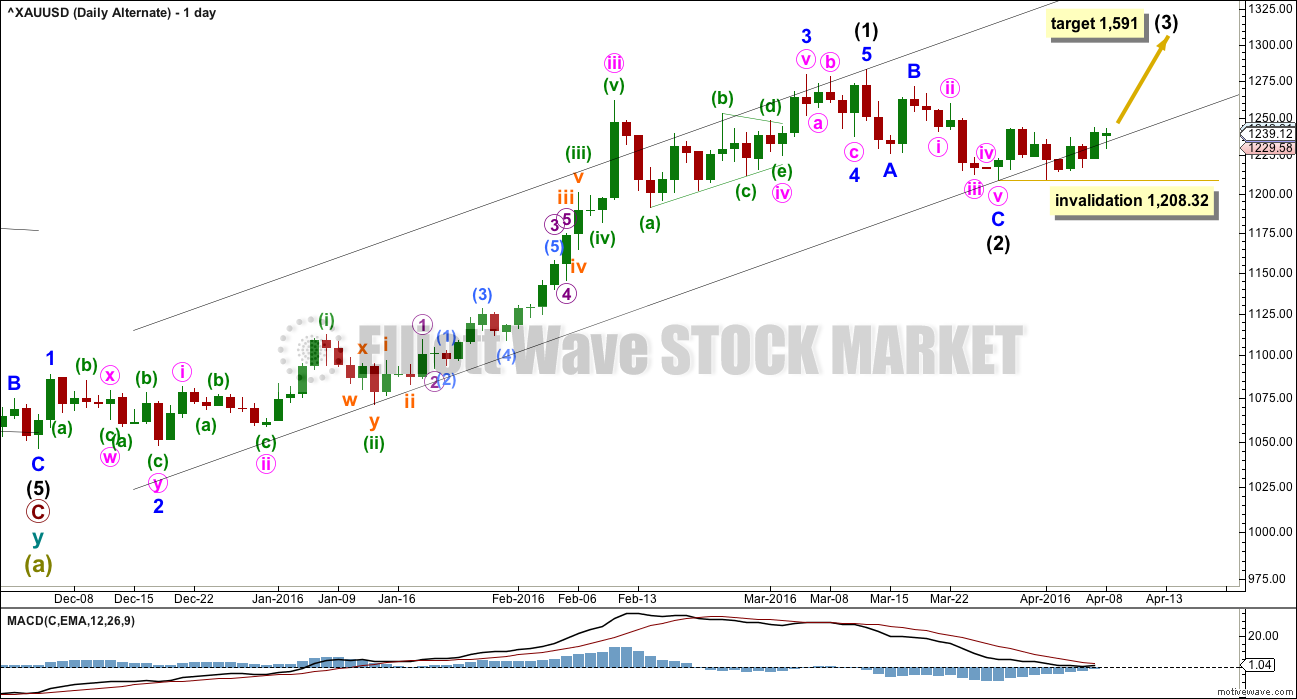
It is technically possible but highly unlikely that intermediate wave (2) is over. This wave count requires confirmation with a five up on the hourly chart for confidence. A new high is not confirmation of this wave count.
If intermediate wave (2) is over, then it is a very brief and shallow 0.31 zigzag lasting only eleven days (intermediate wave (1) lasted 69 days). The probability of this is very low.
At 1,591 intermediate wave (3) would reach 1.618 the length of intermediate wave (1).
Within intermediate wave (3), no second wave correction may move beyond its start below 1,208.32.
I do not want to give too much weight to this alternate by publishing an hourly chart.
TECHNICAL ANALYSIS
Click chart to enlarge. Chart courtesy of StockCharts.com.
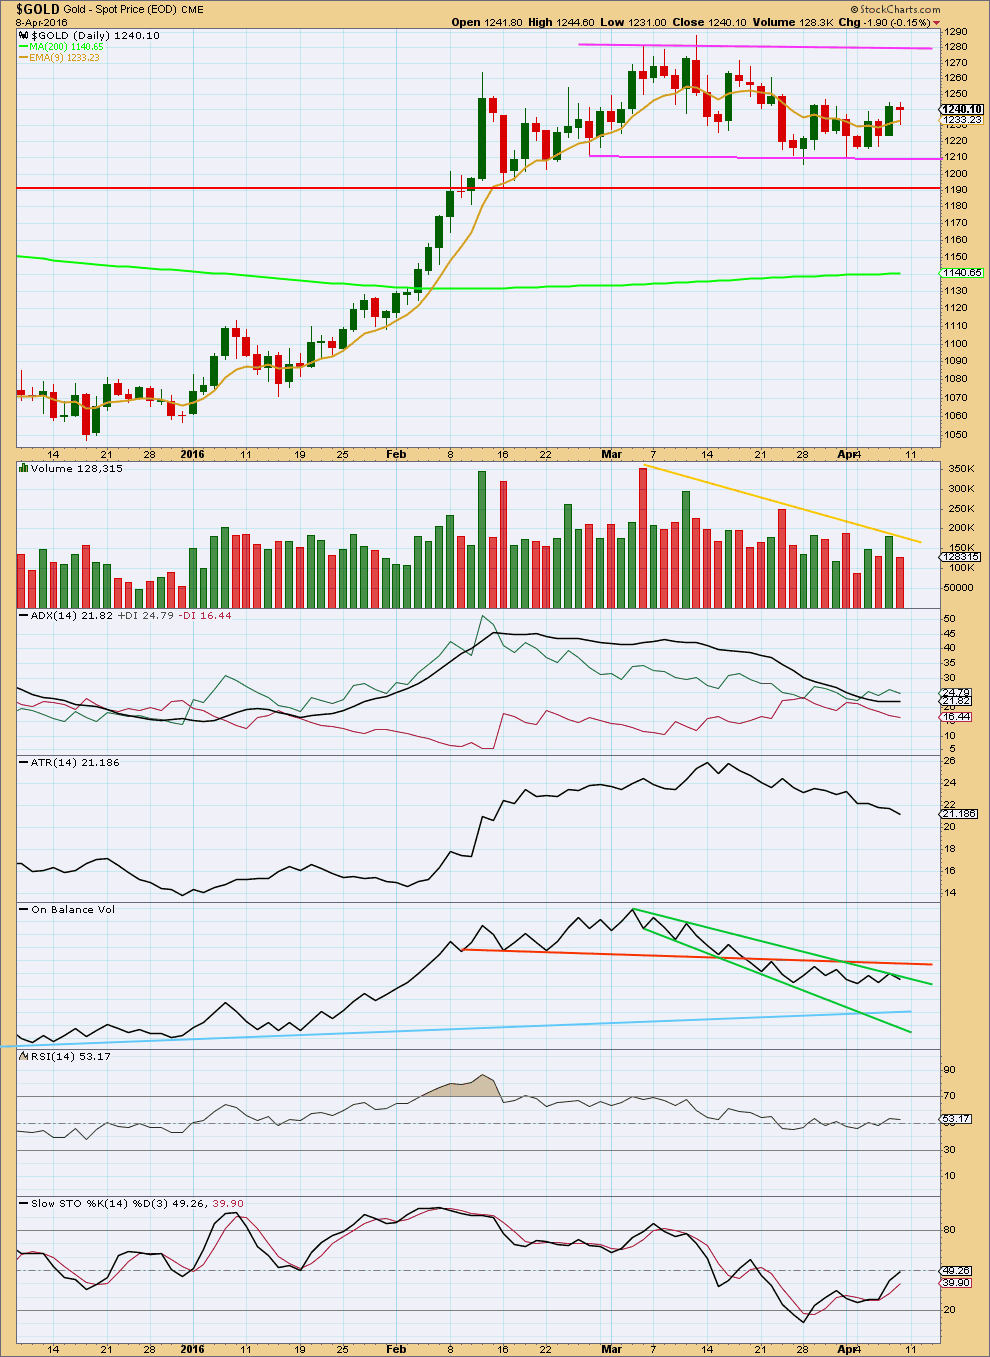
Price is range bound between the pink trend lines, moving sideways. The upper edge is about 1,280 and the lower edge is about 1,210. It should be expected that price will swing from resistance to support and back again, eventually breaking out of the range for the next trend. Only experienced traders should attempt to trade this market while price remains range bound. The rest of us should wait for the next trend to emerge and then join it.
As price moves sideways within the range, volume continues to decline. There was no support for the small downwards movement of Friday compared to volume on Thursday.
Ignoring the Elliott wave count which sees the end of the last wave up on 4th March, it is difficult to accurately state on which day price entered this current sideways trend. It could be as early as 12th February or as late as 14th March. The earlier date seems more reasonable.
If an earlier date is accepted, then during this sideways movement it is a downwards day which has strongest volume. This indicates a downwards breakout is more likely than upwards, which supports the main Elliott wave count.
ADX is flat indicating the market is still not trending. ATR continues to decline, so these two are in agreement.
RSI is neutral. There is room for price to rise or fall.
The upper green trend line is slightly redrawn on On Balance Volume to sit more accurately on the outermost upper peak within the downwards trend. The break above the upper line saw yesterday isn’t so clear; OBV has now turned downwards for Friday. A break more clearly above the upper green line would be a bullish signal. A clearer bullish signal would come from OBV breaking above the orange line, as this line has stronger technical significance. A break below the light blue line would be a strong bearish signal.
This analysis is published @ 01:07 p.m. EST.
Lara please try to look for some other alternate apart from int 3…
Its still highly unlikely that int 2 getting over in 11 days and not even retracing 0.318..
Lara, will you please publish an updated weekly chart when you do the gold update? Helps to see those trendlines in perspective. Thanks.
edit: also, is there ANY possibility the sideways down move after minor 3 could be minor 4 and we are now seeing minor 5?
For what it’s worth : I have been long gold for a couple days( long futures), and long and short NUGT and DUST, ETF’s. Elliot wave is telling me to stay long AT THE MOMENT. However the potential Head and Shoulders pattern forming along with the long term seasonal index is giving me caution. PEOPLE WHO HAVE BOUGHT STOCKS ,both large cap- and small are in for the duration and are willing to take a paper loss for awhile and add to positions on weakness. However people in the futures markets must come up with additional margin capital in the event of a sizeable correction ,or sell and reverse positions. (Pretty much the same with NUGT or DUST.) So it is best at these times to set your alarm clock and pay attention to the overseas( overnight ) markets as well as the US daytime market in gold or silver. I’m kind of leaning to one more push up before a rollover to the downside at this point, but i will stay long ,at the moment, untiol the price tells me what to do. stephen c. New London CT. USA.
Thank you Stephen.
Here are some comments on gold today, by Gary Wagner a gold analyst at Kitco,
“Today’s big news is coming from gold and the rest of the precious metals complex. Gold is up 1.35% and silver is up 3.50%. The fundamental cause for the precious metals thus is hard to discern. Regardless, a $16+ gain in gold is always welcome. One reason we love the charts on gold but are lukewarm on fundamentals concerns other haven plays today…
It is more like a “let’s get gold back to a normal price again.” Gold (and the other precious metals) suddenly hit traders with a bolt of lightning that said, in effect, “You have oversold these trades by a wide margin, so adjust, adjust, adjust.”
———————
Here is an article on gold ratios.
Wednesday Report…Gold Ratio Charts Revisited
Thursday April 07, 2016 15:20 by RAMBUS
http://www.kitco.com/commentaries/2016-04-07/Wednesday-Report-Gold-Ratio-Charts-Revisited.html
With GDX and HUI clearly breaking out upwards, if these lead Gold then Gold should follow.
I don’t know how reliable this relationship is. And breakouts are sometimes false.
But Gold shows no evidence of this upwards move being over; price is within a small channel on the hourly chart, no channel breach, no price confirmation of a new downwards wave.
The alternate daily chart will have to be given more weight. Price is telling us it may be correct. I’ll provide an hourly chart for it.
The lower price point to differentiate the daily alternate from the main is 1,236.56. The main count expects price to turn here, a new low below 1,236.56 would provide strong confidence.
To the upside unfortunately there is no upper price point to differentiate the two ideas. Minor X may make a new price extreme beyond the start of minor Y if intermediate (2) is a combination. But because that would see intermediate (2) shallow the probability is much lower than a double zigzag which would see minor X over now.
How reliable is the relationship between the likes of HUI and GDX in leading Gold?
March 16th US FED news release was only 2 rate increases and none in April, which was bullish gold. However some big mouth and even non-voting FED Presidents soon began saying there should be a rate increase ASAP which 2 days later took the wind out of gold’s brief rally.
On April 6th the US FED minutes were released from the March 16th meeting and clarified that there would be no rate increase in April and only 2 for 2016. Janet Yellen even confirmed that in a different meeting the next day.
Gold started slow at April 6th at 2 pm to go up, however gold kept going up and the US dollar has collapsed since then.
Basically the US FED FOMC events can effect gold and now it’s very bullish.
Mid October the US FED FOMC meeting sent gold bearish until the December 3rd, 5 year low. April 6th the US FED FOMC minutes changed the gold bear to gold bull and the gold miners have become hugely bullish much more than gold.
I’m looking at HUI and GDX and comparing it to Gold for the last few turns.
For the last major low: Gold led, making its low on 3rd December, HUI followed on 19th Jan as did GDX on 19th Jan.
For the last high Gold led on 11th March, HUI and GDX followed on 17th March.
For the last recent low Gold on 28th March followed with HUI and GDX leading on 15th March.
My short term conclusion is if there is a relationship it may not be a stable one.
The correlation coefficient would need to be calculated for these markets. That’s not something I’m going to have the time to do today.
Actually, a correlation coefficient would tell the markets are correlated, but not that one leads the other.
I know there is a mathematical test which would determine if HUI and GDX lead Gold or vice versa, but that is not something I can do. And Google isn’t helping.
Lara are you going to have another hourly alternate with gold topping up another $10 to $20 or it that it for gold’s rally may be out of steam and down it goes from here to intermediate wave (2) bottom about the 1131 area in 1 or 2 weeks?
Miners didn’t have high volume today and DUST got smashed down.
No. That has to be it.
If Gold keeps going up from here then the alternate daily would be favoured.
For the main wave count minor Y now has to begin.
Most analysts are very bullish gold right now. This one agrees with Lara’s main count on gold and GDX.
http://www.gold-eagle.com/article/gold-and-silver-already-topped-miners-will-soon
Gold futures aim for 3rd straight session gain
Apr 11, 2016 11:59 a.m. ET
Dollar hits a nearly 18-month low vs. the yen amid Japanese stock exodus
http://www.marketwatch.com/story/gold-gains-retains-haven-status-for-another-session-2016-04-11
Im shorting gold here…We are confidentaly bearish since 15days now…now if the proce dosnt come down today will see what lara has to say about it…int 2 over in just 11 trading sessions..cannot digest it..
Good luck with DUST. I just sold my DUST at the open today at 9:30 am for $2.39 just 2 cents below today’s high.
Lara said a GDX breakout would need a strong day closing above resistance at about $21.50 with high volume. GDX just set day high of $22.64 and now at $22.52.
Avi Gilburt EW anaylst, said last week that GDX would drop to a buying opportunity soon as long as GDX stayed below a maximum of $22.30.
Gunner24 analysis April 10th has a target of $24.10 for GDX and an HUI target of $217.50 and HUI is now at $204.36.
Many time frames short and long are bullish gold and GDX right now from 1 minute to 1 month. Gold EMA / SMA monthly may have just gave a buy signal and is bullish for the first time since 2011.
Stochastic and CCI don’t suggest a sell here at current levels 1257-58. ADX has turned up, DMI+ remains above DMI-. Watch your shorts, Gold price unlikely to get below 1250-1247. There are no signs yet of topping. With a high range close, upside continuation can be expected to target 1268-1277 range…. Lets see how this plays out. Good luck!
Times up for gold to roll over here. Gold is at 1257+ .
Lara:”The target at 1,256 would be where C = A. That’s still most likely. So it would expect a final fifth wave up.”.
XAU and HUI have a break away gap again. May be some kind of 5th wave action. Looking for a Reversal candle soon?????
GDX jumped up to $22.41 day high so far at 9:51 am that’s $1 above resistance and then gold just moved up to 1258.35 at 10:58 am above the target high of 1256. Let’s see if GDX closes above 21.40 resistance today with high volume for a breakout. Opps GDX just made new day high of 22.46 at 11:01 am and indicators are firing bullish. Many MACD and other indicators time frames bullish Gold and GDX.
It looks like the projected drop in the gold price being charted is going to be very dependent upon today’s emergency Fed meeting. With gold highly dependent on the US Dollar and with it continuing to fade today, an announcement of some sort advising that rates will be raised in April by 0.25% should strengthen the US Dollar and cause gold to drop. Just some thoughts but would love some additional opinions. – Steve K.
Special Focus: FED’s emergency meeting today at 11:30 am
http://www.econotimes.com/Special-Focus-FEDs-emergency-meeting-today-192407
Participants can choose to vote for hike today, however that is non-binding, meaning it will be up to the policymakers to decide on rates. But if most members votes for a rise today, then April meeting is very much alive. Details of today’s meeting will be published later on but not before April rate decision.
Last time FED held such a meeting was back in November 21st, after which it raised rates within a month.
FIRST ,IT MIGHT BE GOOD IF YOU COULD CHANGE YOUR USER NAME FROM STEPHEN TO STEVE K. , as I have been using stephen before you came on this site. Then we do not have to amend our messages with stephen c. or steve k. OK? As to your question , it is a good one. But we should note that the long standing seasonal index for gold starts to bottom in early April to late April. The “emergency FED meeting ” just happens to coincide with the seasonal index. I do not personally believe that the FED meeting nor the seasonal has anything to do directly with Elliot wave. Elliot wave is collective world or universal consciousness ,and often events will coincide with the Elliot wave NOT produce the Elliot wave in itself. That its why the book on Cycles, by Dewey, had the subtitle “The mysterious forces that produce re-occurring events.” At any rate the market will shortly tell us if the seasonal cycle will pertain or whwther we will continue on up to Lara,s (less likely) alternate to the 1500 level at this time. I will note that in 1996 -1997 the gold stealth bull market did not correct much on its way up to $800 gold from the second bottom in 1976. Buy taht bottom occurred outside of the season low p-eriod. So we also ared making a head and shoulders top NOW, Therefore if long USE STOPS and if short use Stops, and let the Elliot wave and the price dictate our action. Respectfully , stephen c.
Correction third last sentence “But that bottom” — also next sentence should read, “So we also are making”— Stephen c.
While we worry about gold up/down my Australian junior miners are performing well.
http://www.asx.com.au/asx/markets/equityPrices.do?by=asxCodes&asxCodes=aqg+bdr+mml+dcn+slr+gor+gry+rsg+evn+nst+sar
I thought that since you were focused on COT being bearish for a long time that you were bearish?
These are micro junior buy and hold till cycle wave b completes above 1923.
These ar 10 to 100 baggers in the future.
PM ETFs and seniors and some midcap juniors I am out of them. AND waiting for gold to drop.
Smart trade with the micro juniors.
Lara is gold still on target for a high of $1,256 or perhaps the target of $1,264 area that Dreamer has on his gold chart below?
Gold has already hit a high of $1,254.39 at 3:28 am so it may top before the open at 1256 unless it may reach 1264 Tuesday as Dreamer suggested?
Once it does top may it be a quick or a slow decent down?
Richard..
I think its time to wait and see when the gold upside will stop….assuming the top is not which one should do before any clear signal…
And if you are already short in gold so at this point of time there is no option other than to stick with the shorts and hope gold to calm down or if the loses are small get out of shorts n wait…
Im very hopefull that laras analysis will prove this time also…gold is in its X wave…and will end soon..
Takecare
Yes. A final fifth wave up is what I would expect is required now.
The target at 1,256 would be where C = A. That’s still most likely. So it would expect a final fifth wave up.
Volume for this session will be crucial. If price closes reasonably above resistance on a day with higher volume then an upwards breakout would be indicated. Then the alternate daily would increase in probability.
Until that happens though the main wave count must have a higher probability.
If price moves higher and then turns down, closing back below resistance for the session, the main wave count would increase in probability and the alternate daily would decrease.
Gold Ratio Charts Revisited
Thursday, 7 April 2016 – Rambus
http://news.goldseek.com/GoldSeek/1460031971.php
Corrective Action Continues – But, A Rally May Still Be Seen – GLD, GDX, Silver
Wednesday, 6 April 2016 By Avi Gilburt First published Sat Apr 2 for members:
http://news.goldseek.com/GoldSeek/1459951440.php
see a link to 3 charts at the bottom of the article.
GDX – But, as long as we remain below 22.30, any higher high is likely part of an expanded b-wave structure, which is what I would prefer to see, as it supports a strongly bullish bias in the GDX. But, keep in mind that as long as we remain below 22.30, it is only setting us up for a drop in a c-wave for wave ii, which will likely be another buying opportunity.
With the main hourly invalidated, here is my attempt at updating the alt hourly. If correct, I think the day session for Monday may be mostly sideways action as a 4th wave develops. I would think that the X wave would complete by Tuesday and then head down toward Lara’s target. If we move up strongly, then maybe the alt Daily is in play.
Dreamer thanks for the chart.
Gold and especially miners are looking like maybe at the peak or in a breakout.
Yes, that’s how I’d see it too.
Gold Miners sounding the attack – 04/10/2016 – GUNNER24
http://www.gunner24.com/newsletter/nl-041016/
Gold Stocks Breakout, Gold to Follow
Friday April 08, 2016 16:35
http://www.kitco.com/commentaries/2016-04-08/Gold-Stocks-Breakout-Gold-to-Follow.html
STO is now oversold and bollinger band is having resistance near 1260..waiting for gold june to make a low below 1245 to get confidence on the correction might over
What had happend to gold..??..
Was expecting a 2 down atleast
Starts of with a sharp rise…
Lara is this 3 of C..??
Or the spike is saying something else
Main hourly wave count is invalidated at the opening.
Gold has now main alt hourly and Alt daily wave counts in play.
Coming close to start of correction.
https://www.federalreserve.gov/aboutthefed/boardmeetings/20160411advexp.htm
Hey does anybody knew about this emergency meeting of fed..??
I’m updating my GDX analysis and will publish shortly.
A serious question for those very experienced members here.
What makes you so bullish?
Now, Thomas points out that in the early stages of a new bull market COT may be unreliable. I’ll take that on board.
But short term, I see both GDX and Gold range bound. No breakout yet. A breakout upwards must be clear and must come on a day with higher volume.
I see both drifting sideways and volume declining. For Both ATR is flat or declining.
ADX on GDX is now increasing, that is the most bullish signal I can see.
So what else am I missing here?
Hi Lara
I think the bullishness derives from the recent behaviour of gold stocks. To be clear, I would love for your main count to play out so I can add to my gold stock holdings. However, there are some signs your unlikely alternate (Int 3) may be happening.
I’ve been following gold closely since 2001 and have found that the stocks lead the metal about 80% of the time. Why this should be so I still have no idea, but it is definitely statistically significant.
The HUI in particular has made a solid break to new highs for the move. GDX has also, but less convincingly so when you take note of the volumes.
http://imageshack.com/a/img921/7362/CMyinb.jpg
With regard to the COT. The Commercials can be heavily short throughout continuing up moves. There are also rare occasions where the Commercials have had to cover their shorts somewhat if the market runs away from them. I can’t cite examples of this but remember having seen charts in the past that show it. If that is going to happen, then perhaps the early stages of a new, strong bull market would be the time.
I obviously don’t know what’s going to happen, but am very open to the possibility of an upwards breakout.
Thank you very much Johno. Yes, I can see a clear breakout on HUI.
Thanks for explaining the bullishness to me. Now I understand.
GDX is based on $GDM which is all the majors in a whole lot of different currencies. $HUI is US producers in $USD. Much clearer signals IMO than GDX re USD POG
Thank you Johno. You mirror my thoughts exactly. The bullish prospects are significant enough not to ignore.
Gold COT.
Continuously for five weeks in a row it is bearish??? WOW
They must be doing a lot of short covering.
Lots of good discussion lately about the COT, bearish, and the miners, bullish breakouts to new highs. Who will win?
What if the miners, GDX and GDXJ for example, just completed an upward breakout from a triangle? These moves are often swift and short. So maybe GDX is just about to complete it’s first 5 up and is due for a bigger correction. This could align with the next wave down in Gold.
Lara, any chance for a GDX update?
Dreamer, you could be right; this rise could be short lived. Because of that possibility I’m keeping some tight stops.
But you could be wrong, too, and miss out on the next big wave. What I’m suggesting is that its time for a change of psychology. After 4 years of of a grinding bear, everyone is afraid of getting burned again. The risk all this time has been to the downside. But now I’m suggesting that the risk equation has shifted, and its now to the upside. Fear can cause you to miss out.
I agree, the Bulls are in charge again and holding long should be good for the intermediate term. That said, for traders, I agree with Lara’s counts that both GDX and Gold have more down to finish Intermediate Wave 2 before a strong move up.
I would caution all of you not to place too much weight on the COT data. Research has shown that it is only reliable in a bear market. The Commercials tend to be short at the start of a bull market. If that’s what we are in, it doesn’t pay to rely upon them for a signal.
Also check out this commentary by Jordan Roy-Byrne.
http://www.safehaven.com/article/41049/gold-stocks-breakout-gold-to-follow
He rightly points out how the miners here seem to be indicating higher gold (although he doesn’t mention the very heavy volume behind their rises). He is also right where he says, “The toughest time to buy is after a market has already had a strong rebound, following a nasty bear market”. There is a real danger of waiting too long for a pullback and missing out on a third wave rise.
I’m updating GDX and will publish shortly.
I’m not seeing a breakout yet from GDX. While Friday closed higher it came on slightly declining volume from the prior day, and overall from 23rd March volume on GDX is declining while price moves sideways.
For an upwards breakout price needs to have a strong upwards day closing clearly above resistance, which I have about 21.50, and it should do it on a day with clearly higher volume.
So I don’t know why that analyst is stating GDX is breaking out upwards.
COTs expecting a fall…
Atleast 6 to 7 % will resolve the heavyness in cots i guess
JUST A VIEW: I wouldn’t look to short this just yet. Upturn / rally is expecting. Gold price reaction around its pivot (1237/39) will likely indicate which way this is going…. With a stop at 1233/34 expecting for Gold price to take out Friday H 1244.60 rather than Friday L 1231….
From Goldtent site: Gold Bear some charts with COT data:
https://goldtadise.com/?p=366399
Commercial net short stands at 207K. AND Specs net long at 189K.
Are you short now?
No on sideline. Level of COT data is similar to when gold was at 1308 in Jan 2015.
Lara had turned bullish at the time with main bullish count.
This time I think gold is in bull trend as main count is telling but the correction is looming to $1131.
Looks like a clean triangle for wave 4 in HUI, with a clean breakout up for 5. Seems to need a small wiggle up (on hourly) for 5=1 (arrows, log-scale). Same nice triangle/breakout in GDXJ. Not as clean in GDX (narrower index, only majors). This should support Lara’s X topping soon (1 day?).
Thanks for the clearance lara…
This correction has now taken 20 days that is about 3 weeks…do you think that 5weeks is enough for the int 2 to get resolved or it will take 8 weeks for that…which one is more likely in your experience…
And is it necessary to include the alternate daily wavecount in your daily analysis..??..If yes how much percentage chance you will give it out of 100…??
Thank you..:)
If intermediate (2) is over it would be as per the alternate daily chart, it wouldn’t be over on last Friday. The structure would make no sense.
On the alternate daily chart intermediate (2) lasted just 11 days to intermediate wave (1) 69 days. That is not long enough nor deep enough.
I would give the alternate about 10%