
Price moved slightly higher and then turned down exactly as the main Elliott wave count expected.
The alternate Elliott wave count is invalidated.
Summary: Overall downwards movement may end in a few days at about 14.514. When this second wave correction is complete, then Silver should be ready for a third wave up at intermediate degree.
New updates to this analysis are in bold.
WEEKLY WAVE COUNT
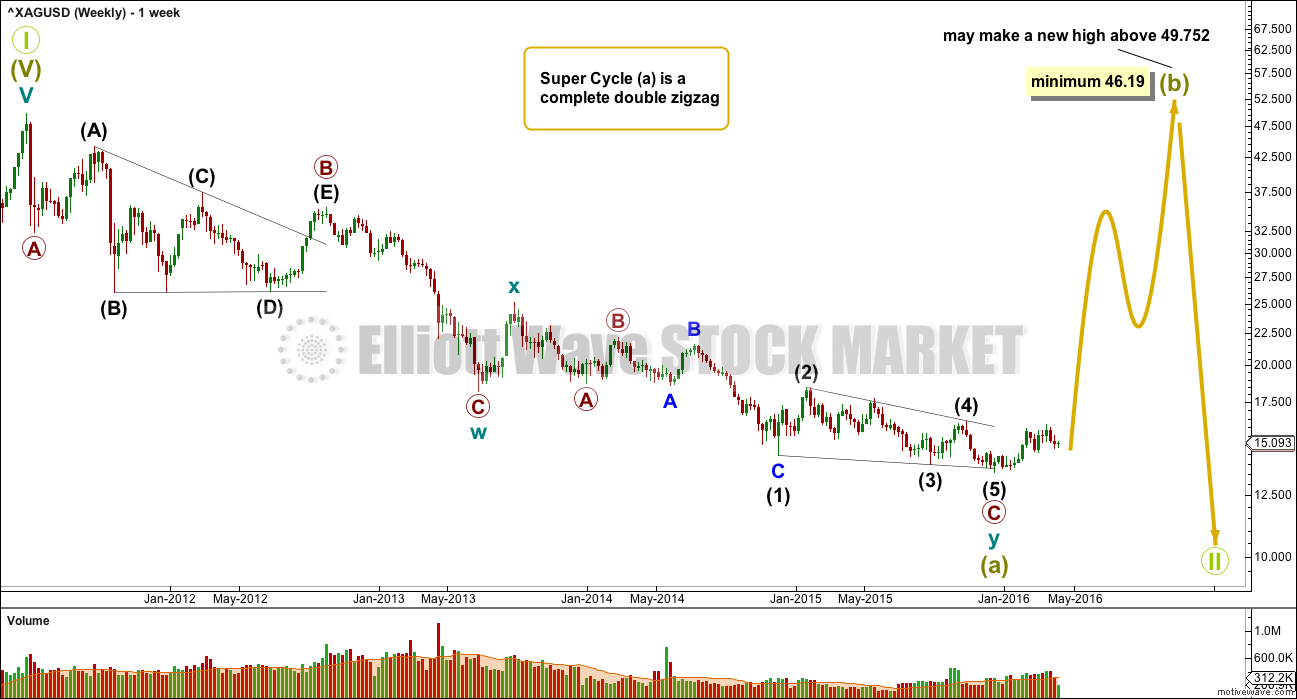
Click chart to enlarge.
If super cycle wave (a) is a double zigzag, then within the second zigzag of the double labelled cycle wave y the structure may be complete.
Primary wave C is an ending contracting diagonal within the zigzag of cycle wave y. All subwaves subdivide as zigzags. The third wave is shorter than the first, the fifth wave is shorter than the third, and the fourth wave is shorter than the second. The trend lines converge.
There is a small overshoot of the (1)-(3) trend line at the end. This indicates the contracting diagonal structure is very likely to be complete.
If this wave count is correct, then super cycle wave (a) has subdivided as a three wave structure. That indicates Grand Super Cycle wave II may be a flat correction.
If this correction at Grand Super Cycle is a second wave (as opposed to a fourth wave), then a triangle may be eliminated.
A combination may also be eliminated because the first wave is a multiple. Combinations may only consist of a maximum of three corrective structures, so within each of W, Y and Z they may only subdivide into simple A-B-C structures (or A-B-C-D-E in the case of triangles). To label multiples within multiples increases the maximum beyond three, violating the rule.
Super Cycle wave (b) must retrace a minimum 90% of super cycle wave (a) at 46.19. Super cycle wave (b) may make a new price extreme beyond that seen for super cycle wave (a) above 49.752 as in an expanded flat.
Super cycle wave (b) may be any one of 23 possible corrective structures. It is impossible to predict at this early stage which one it will be, only to say it is unlikely to be a rare structure such as a running flat, expanding triangle or triple combination. That still leaves multiple structural possibilities. The most likely structure which would be able to meet the minimum price requirement at 23.945 is a zigzag.
The first movement up for a wave of this large degree must subdivide as a clear five at the daily chart level, and probably at the weekly chart level also.
DAILY WAVE COUNT
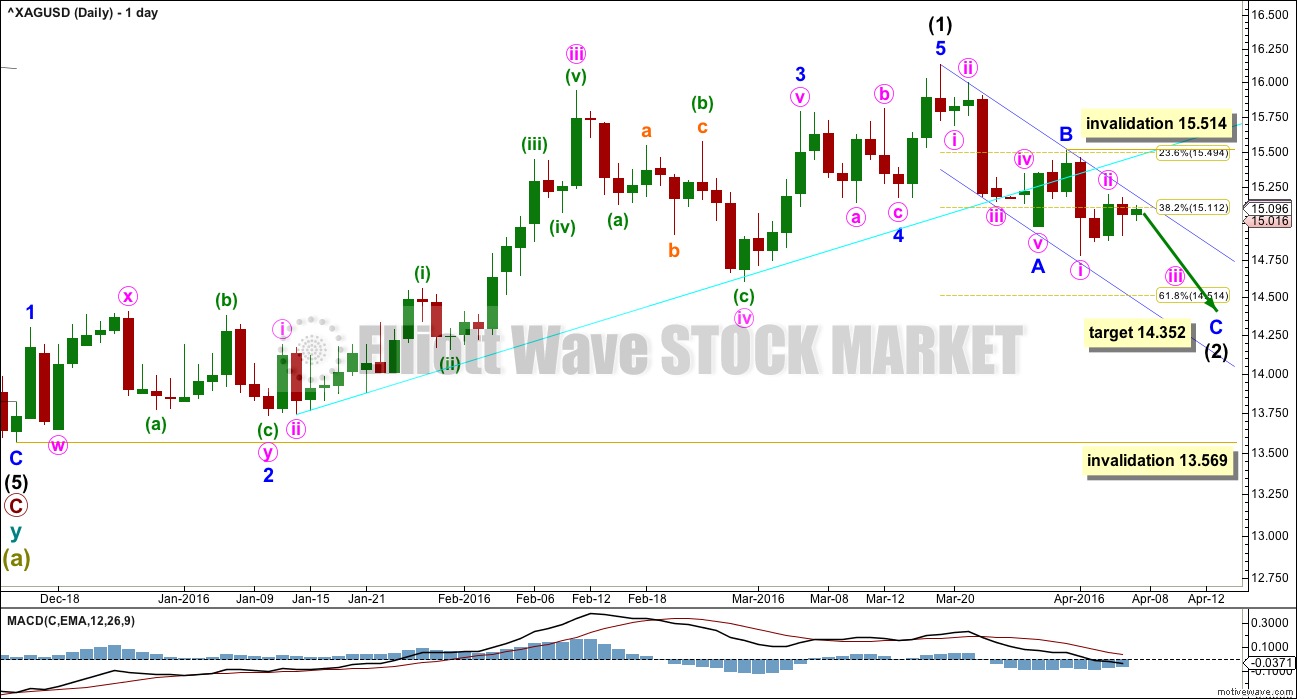
Click chart to enlarge.
Downwards movement for intermediate wave (2) so far fits neatly within a channel. Along the way down, expect upwards corrections to find resistance at the upper edge.
Although it is possible that intermediate wave (2) is over at the low labelled minute wave i, this is not supported by structure on the hourly chart. Upwards movement from that low subdivides as a three, not a five. It is more likely that minor wave C is incomplete.
At 14.352 minor wave C would reach equality in length with minor wave A. This would take intermediate wave (2) to just below the 0.618 Fibonacci ratio at 14.514.
Minor wave C may end in a few days to two weeks time. Within minor wave C, minute wave ii may not move beyond the start of minute wave i above 15.514.
When minor wave C can be seen as a complete five wave structure, then intermediate wave (2) should be over. A breach of the blue channel at that stage would be confirmation of a trend change.
Intermediate wave (2) may not move beyond the end of intermediate wave (1) below 13.569.
TECHNICAL ANALYSIS
DAILY CHART
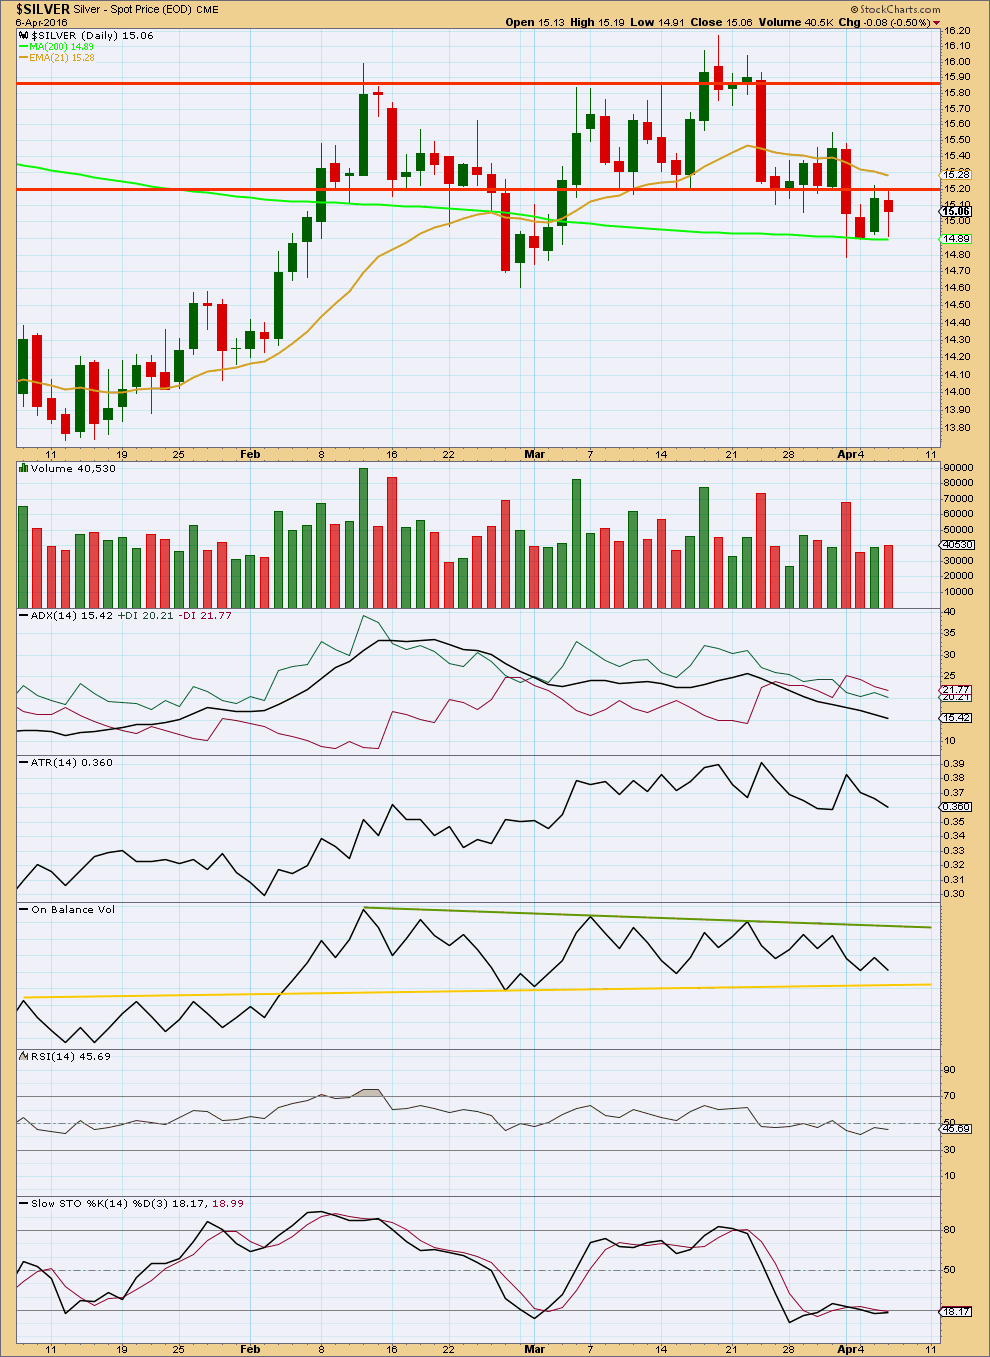
Click chart to enlarge. Chart courtesy of StockCharts.com.
Price broke out of the consolidation zone on a downwards day with higher volume. This is a classic breakout. Now price is showing a typical throwback to the prior line of support, which is now providing resistance. Strong resistance should be expected from this line now.
This supports the Elliott wave count which expects more downwards movement.
Price is finding some support at the 200 day Moving Average.
ADX is still declining indicating the market is not trending. ATR is also declining, in agreement with ADX. Both these indicators are lagging as they are based upon 14 day averages.
On Balance Volume may assist to show us where downwards movement may end. If OBV touches the lower yellow line that may be when intermediate wave (2) comes to end.
This analysis is published @ 02:16 a.m. EST on 7th April, 2016.
Lara, the daily chart has been invalidated. (XAGUSD @ 16.05 at this writing) Does this mean that “that intermediate wave (2) is over at the low labelled minute wave i”? (and we are now starting intermed. 3) Or is there further structure possible for intermediate 2 on this metal?
Your help much appreciated.