
Last week’s analysis of US Oil expected a correction to continue, which looks like what is happening so far.
Summary: A new high above 41.90 at any stage by any amount would confirm the main wave count and invalidate the alternate. It does not mean the next wave up is underway though; a second wave correction may still be unfolding and the B wave within it may be complete here or very soon. The correction is most likely to end about 31.21. However, there is some cause for concern about this short term expectation as it is not supported by classic technical analysis. A classic upwards breakout looks like it has unfolded over the last two days.
New updates to this analysis are in bold
MONTHLY ELLIOTT WAVE COUNT
Click chart to enlarge.
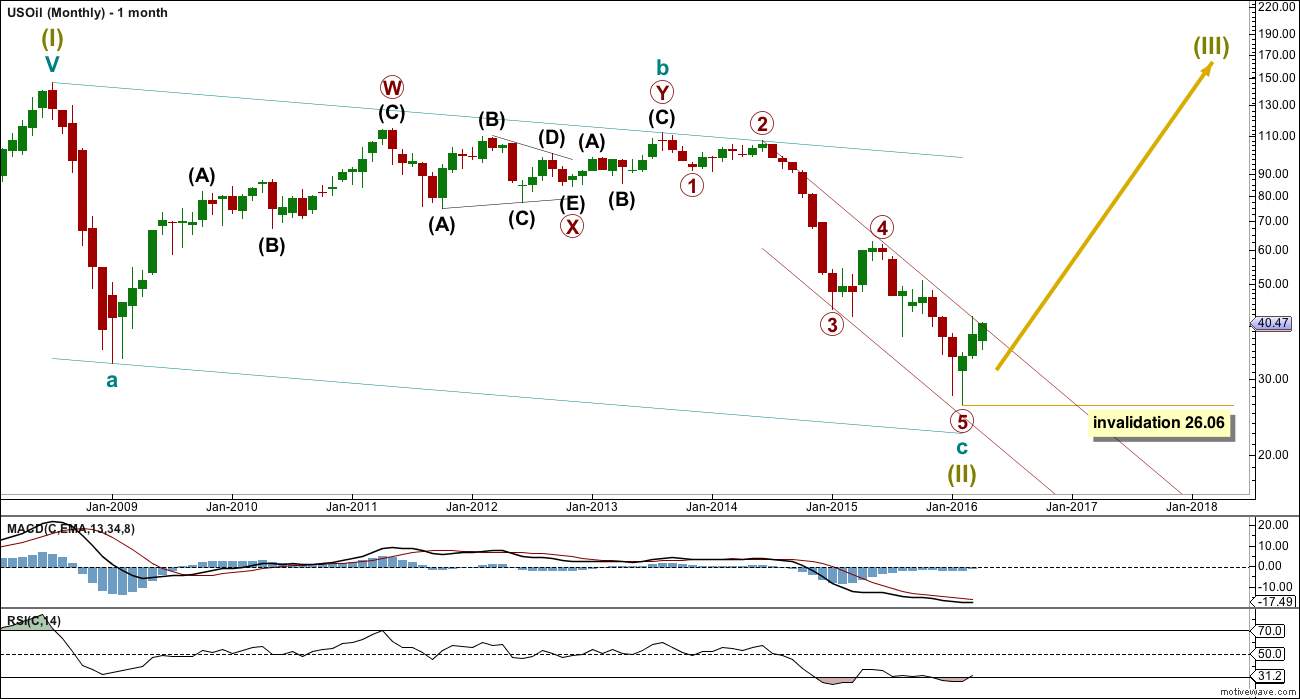
US Oil has been in a bear market since August 2013. While price remains below the upper edge of the maroon channel drawn here and below the 200 day simple moving average it must be accepted that the bear market most likely remains intact. Price has turned back down from the 200 day moving average and back into the maroon channel.
The structure of primary wave 5 may be complete. This wave count has a problem though: primary wave 5 looks like a three wave structure at the monthly chart level. It may only subdivide as a five.
If primary wave 5 is complete, then the zigzag of Super Cycle wave (II) would also be complete. Super Cycle wave (III) must move above the end of Super Cycle wave (I) at 146.76. Within Super Cycle wave (III), no second wave correction may move beyond the start of its first wave below 26.06.
DAILY ELLIOTT WAVE COUNT
Click chart to enlarge.
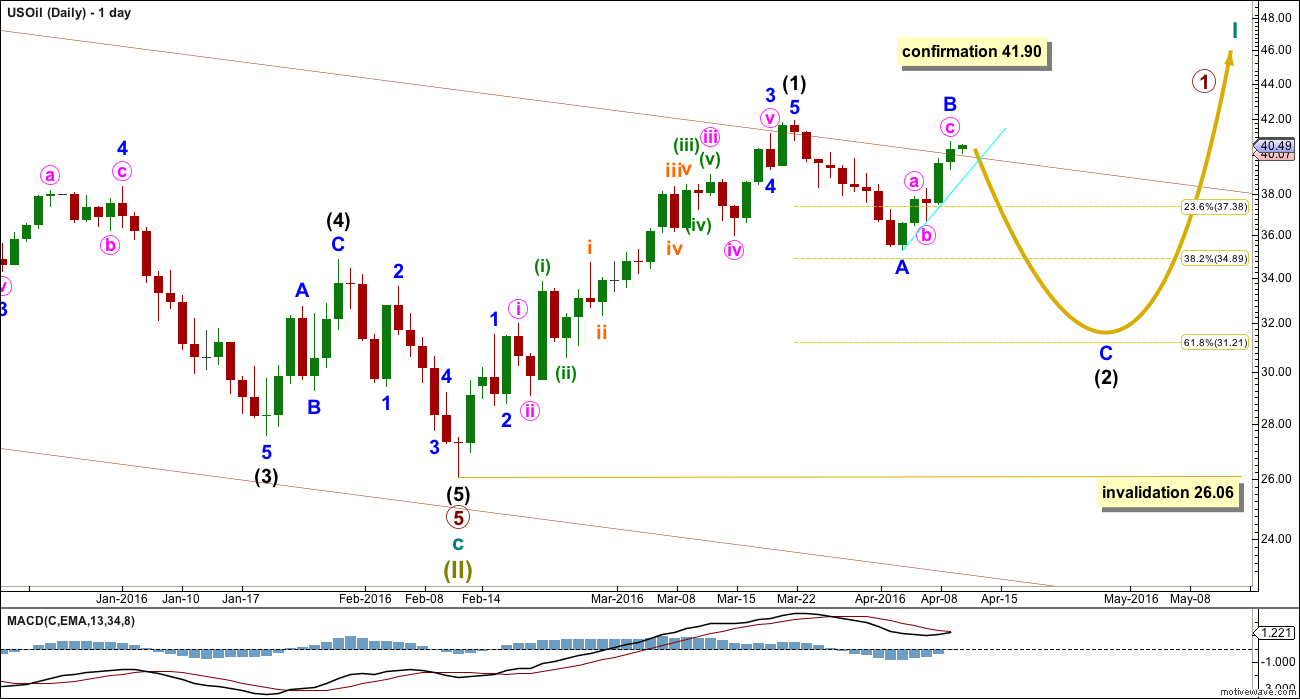
This wave count is identical to the alternate below up to the high labelled intermediate wave (2).
The maroon channel is slightly redrawn. Draw the first trend line from the end of primary waves 2 to the first swing high after primary wave 4 at 61.57, on 24th June, 2015. This upper trend line may show where price is currently finding resistance.
If Super Cycle wave (II) is a complete zigzag, then Super Cycle wave (III) must begin upwards. So far intermediate wave (1) may now be complete as an impulse.
Intermediate wave (1) lasted 28 days (not a Fibonacci number). Intermediate wave (2) should last longer; corrections are usually more time consuming than impulses, particularly first wave impulses. Intermediate wave (2) is most likely to be a zigzag and most likely to end about the 0.618 Fibonacci ratio at 31.21.
At this stage, intermediate wave (2) looks most likely to be either a flat or a zigzag. A new high above 41.90 would invalidate the alternate below and indicate intermediate wave (2) is most likely unfolding as a flat correction. The normal range for a B wave within a flat is 1 to 1.38 the length of the A wave, which gives a normal range of 41.90 to 44.26.
When the small short term cyan trend line along minor wave B is breached clearly by downwards movement, that should be an indication that minor wave B may be over and minor wave C downwards may be underway. At that stage, a target for minor wave C based upon a Fibonacci ratio to minor wave A may be calculated. That cannot be done today because it is not known if minor wave B is complete.
At this stage, the target for intermediate wave (2) to end will remain at the 0.618 Fibonacci ratio of intermediate wave (1) at 31.21. This target may change.
Intermediate wave (2) may not move beyond the start of intermediate wave (1) below 26.06.
Unfortunately, there is no upper price point which would indicate intermediate wave (2) is over at the low labelled minor wave A. There is no rule stating a maximum length for a B wave within a flat, nor an X wave within a combination. There is a convention which states that when the possible B wave is more than twice the length of the A wave the probability of a flat unfolding is so low it should be discarded. That price point would be at 48.31.
It is possible but fairly unlikely that intermediate wave (2) is over at the low labelled minor wave A. It would be more brief and shallow than second wave corrections normally are, but it is possible. If upwards movement continues to be strong and shows an increase in volume, then this possibility would increase in probability.
ALTERNATE MONTHLY ELLIOTT WAVE COUNT

Click chart to enlarge.
With the maroon channel being overshot, now this wave count has reduced in probability.
This wave count expects to see an extended wave for primary wave 5, which is common for commodities. This wave count expects primary wave 5 to look like a five wave structure on the monthly chart when it is complete.
Cycle wave c may end with an overshoot for the lower teal trend line for this wave count.
ALTERNATE DAILY ELLIOTT WAVE COUNT
Click chart to enlarge.
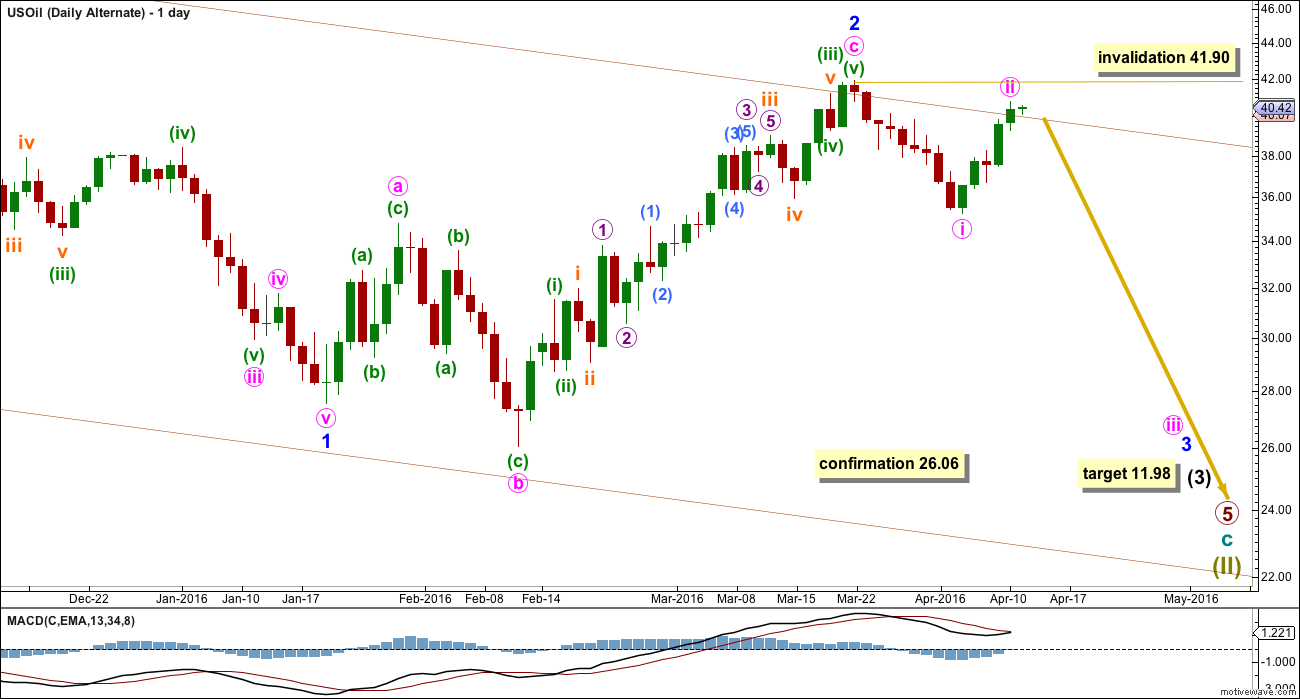
If there has been no trend change and if primary wave 5 is incomplete, then at this stage this is the best wave count I can see.
This wave count sees only minor waves 1 and 2 within intermediate wave (3) complete. Minor wave 2 is seen as an expanded flat correction.
Minor wave 2 is ten days longer in duration than intermediate wave (2) one degree higher. This wave count now has a problem with proportions.
Minor wave 2 should have found strong resistance at the upper edge of the channel. It should not be showing up so strongly on the monthly chart. This now gives the wave count an atypical look which reduces its probability.
Minor wave 2 may have ended just above the 0.618 Fibonacci ratio of minor wave 1.
At 11.98 intermediate wave (3) would reach 1.618 the length of intermediate wave (1).
If price makes a new low below 26.06, this wave count would be confirmed.
Within minor wave 3, no second wave correction may move beyond the start of its first wave above 41.90.
TECHNICAL ANALYSIS
MONTHLY CHART
Click chart to enlarge. Chart courtesy of StockCharts.com.
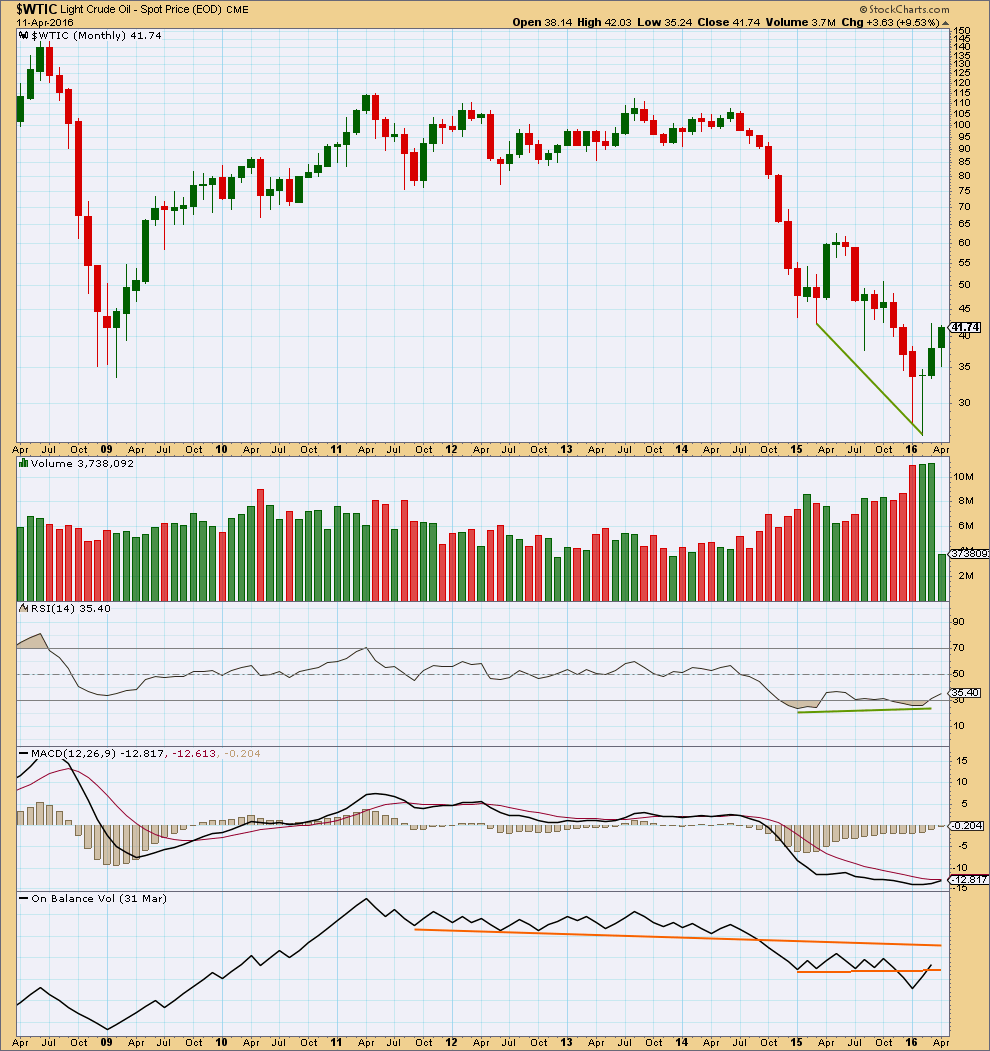
Price shows divergence with RSI as price moved lower.
The fall in price was supported by volume. The rise in price from the low in February is supported by volume. This favours the main wave count.
The three monthly candlesticks for January, February and March create a Morning Doji Star reversal pattern. However, this is a warning of a trend change and not definitive. There is an example of a stronger candlestick reversal pattern on this monthly chart for March and April 2015. April 2015 completed a bullish engulfing candlestick pattern; this is the strongest reversal pattern and this example was particularly strong. Yet it only translated to one more month of slight new highs in May before the downwards trend resumed.
On Balance Volume has broken below two trend lines. OBV is beginning to break above the lower line. If the month of April can close with OBV above the lower orange line, that would be a reasonably strong bullish signal in support of the main Elliott wave count.
DAILY CHART
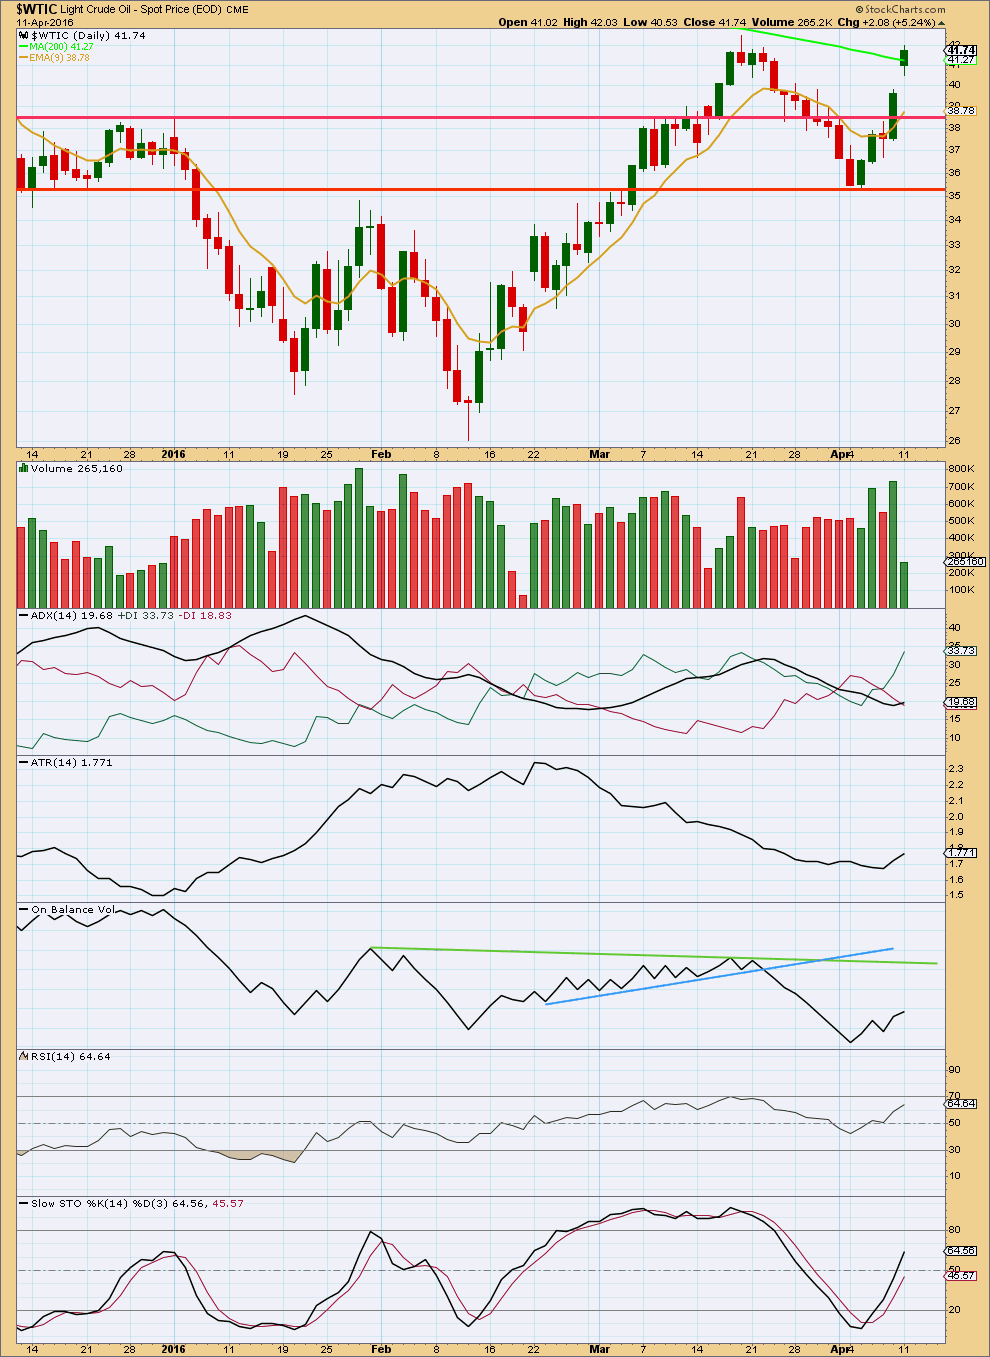
Click chart to enlarge. Chart courtesy of StockCharts.com.
Volume flattened off at the end of the last small downwards swing. Now volume has increased substantially as price rises. This supports the idea that the trend is up at this stage.
It looks like a breakaway gap and upwards breakout has occurred in the last two sessions. This does not support the short term expectation from the main Elliott wave count of a downwards swing about here.
ADX is beginning to slightly increase; a new trend may be developing. The +DX line is above the -DX line, so the trend would be up. This also does not support the short term expectation from the main Elliott wave count.
The trend lines on On Balance Volume are redrawn this week. For a strong bullish signal, OBV needs to break above the green line. Unfortunately, this is too far away to be of much use and a lower line with reasonable technical significance cannot be found. OBV may not be of much use in this instance.
Neither RSI nor Stochastics are yet extreme. There is room for further upwards movement in price.
This analysis is published @ 04:34 a.m. EST on 12th April, 2016.
I found this article that explains “spot” (cash) prices and how they relate to futures price. This is a gold site, but it works the same for oil.
http://www.jmbullion.com/investing-guide/pricing-payments/spot-prices/
This line is important “The spot price is determined by the front month futures contract with the most volume. Sometimes this contract may be the current month, and sometimes it may be two months or more out in time.”
From my own observations of Oil, the front month of the futures price usually equals the spot or cash price for oil as it has the most volume. As the official expiration date for the front month futures contract nears, the next month may have more volume and therefore becomes the new spot or cash price before the official expiration date. Different sites still “roll” on different dates, which is the confusing part and the part that I can’t explain. You would think they would all follow the same basic rules to reflect the spot price.
My other post below refers to the CME group official futures pricing. The official date for the CL crude oil May contract to expire is 4/20: however, the volume for the June contract exceeded the May contract on Monday, 4/18. Therefore, most sites already reflect the June futures price as the spot or “cash” price as of 4/18, Monday, 2 days before the official expiration date. I hope this helps.
I with Papudi!
Prices are based on what? unclear!
Hope Lara indicated this on all charts.
It’s in the FAQ.
This data is cash market data for WTI crude.
And no, I’ve not indicated that on charts.
oil should go back to somewhere around 26.05 over the next 15 days. my guess.
US Oil top HnS is formed having neckline across 40 in one hour period. If oil breaks 40 it may target Lara’s price point of 31.20????
Lara:”A new high above 41.90 at any stage by any amount would confirm the main wave count and invalidate the alternate. ”
The price marker of 41.90 was of April oil contract or US Oil spot price????
The current nearest contract is May and has not breached its high of 42.49 but it breached April contract’s recent high of 41.90.
Since there are differences in prices between contract months how EW analysis accommodate the price points ???
Is your EW analysis based on continuous spot price or nearest contract month?
I am confused???
This analysis is based on the continuous spot price, or in other words the cash price, of WTI crude.
The data feed I’m using is from FXCM.
Different data feeds may have slight differences.
None of my Elliott wave analysis will ever look at futures data. I always look at the cash markets.
Any one know what is the nearest future for oil and it s preice???
Finviz has spot oil at 41.60 and stockcharts.com has chart showing price higher than $42. It appears they have shifted data to next nearest future contract price??
Oils ( commodity) charts get confusing during these time.
https://finviz.com/futures.ashx
We are currently in the May contract which will expire on 4/20 and roll to June.
Official pricing here:
http://www.cmegroup.com/trading/energy/crude-oil/light-sweet-crude.html
Thanks Dreamer.
There is a huge contango between Jun-May vs other contracts .
It appears that Saudi has ruled out a production cut. The best that can come from the meeting on Sunday, the 17th is a freeze. It may even be difficult for the oil ministers to agree on a freeze since Iran has stated that they will not agree to a freeze until they get their production back up to pre sanction levels.
So, it seems that oil inventories are very important. The weekly report for US oil inventory is released on Wednesday @ 10:30 EST. This could trigger the next move in oil. Report will be posted here. https://www.eia.gov/petroleum/supply/weekly/
I got $42.49 as the high, as shown in this chart, we have been as high as $42.25 on the OIL May Contract, so fat, today.
http://www.bloomberg.com/quote/CL1:COM
We are getting prety, prety close to a breach of the highs.
and now its clear. The 12th of April breached the highs.
Only one wave count left now.
Is the main wave count confirm already?, we are at $42.12 in US Oil, May Contract, past the $41.90 mention above.
Is this intermediate wave 3 to the upside already? How can you tell whether you are in intermediate wave 3 or in wave b? Seems too confusing.
Thank you for your answer.
You can’t tell.
I know that’s not helpful, but that’s the way it is. Only above 48.31 would the idea of an expanded flat for intermediate (2) be discarded.
There is no rule stating the maximum length for a B wave within a flat. Nor an X wave within a combination.
There is an Elliott wave convention (which is not the same as a rule) which states the probability of an expanded flat is reduced to so low when the possible B wave is 2X the A wave, the idea should be discarded.
I have seen a few flats with B waves longer than 2X the A wave. But they’re rare.
Expanded flats are very common structures. That is still most likely what is unfolding for intermediate (2).
To see intermediate (2) over at the low I have labelled minor wave A would see it only 0.382 the length of intermediate wave (1) and lasting only 9 days compared to 28 days for intermediate wave (1).
In a new trend the first big second wave correction is very commonly deep and in better proportion than that.
So based on normal look and normal behaviour for a second wave, I have to make the judgement that it is most likely this upwards wave is a B wave. Not the start of intermediate (3).
Further: MACD now shows divergence with this last high on the day chart. It lacks momentum. During the upwards wave for minor B it is the downwards day of 7th April with strongest volume by a clear margin. That is a warning that there may be something off about this upwards wave.
The oil prices are still around 40.7..almost the week high…when it touched 41.74..??
Lara: ” A new high above 41.90 would invalidate the alternate below and indicate intermediate wave (2) is most likely unfolding as a flat correction.”
Yesterday chart from Stockchart.com shows oil touch $42.03. That means the bearish alternate wave count is invalidated.
Oil has only the bull wave count now?????
To add to my comment above on PMbull wtic chart oil did not take out the previous high???
http://www.pmbull.com/oil-price/
It has now. Stock charts data has a high at 43.57, FXCM data has a high at 42.25.
Lara It could be the break away gap on stockchart chart may be due to change in contract price data.
On PMbull.com wtic oil price is still below $41 and yet the chart shows $41,74.
This change in data on charts makes it difficult to analyse.
Thanks Papudi, that’s important info for me.
Lara, UKOIL (Brent) has invalidated its respective alternative yesterday and looks to be completing the 5th up. It was leading USOIL off the bottom too.
Thanks.