
The Elliott wave count is changed this week. There is a new monthly wave count with a main daily, and an alternate daily Elliott wave count.
Summary: A new high above 44.49 would confirm more upwards movement, with a target at 51.09. Volume favours a bullish move next. Alternatively, a new low below 37.61 would confirm more downwards movement, with a target at 33.73. So far volume favours a bullish outlook.
New updates to this analysis are in bold
MONTHLY ELLIOTT WAVE COUNT
Click chart to enlarge.
Thanks to our member Dreamer for sharing this idea from Elliott Wave International.
After charting this wave count and comparing with my prior monthly analysis, I have decided to discard my prior wave count. It suffered from a problem of structure within cycle wave b which this wave count resolves. This wave count would have a higher probability.
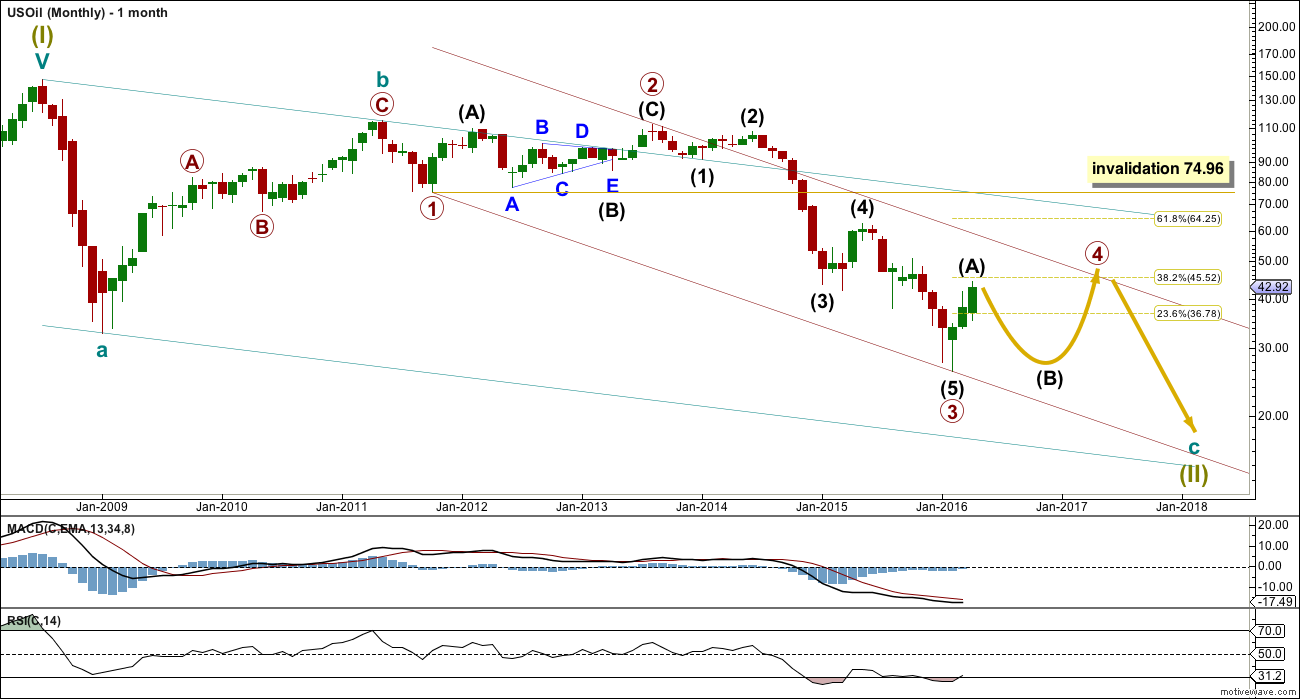
Within the bear market, cycle wave b is seen as ending earlier, in May 2011. Thereafter, a five wave structure downwards for cycle wave c begins.
Primary wave 1 is a short impulse lasting five months. Primary wave 2 is a very deep 0.94 zigzag lasting 22 months. Primary wave 3 is a complete impulse with no Fibonacci ratio to primary wave 1. It lasted 30 months.
Primary wave 4 is likely to exhibit alternation with primary wave 2. Primary wave 4 is most likely to be a flat, combination or triangle. Within all of these types of structures, the first movement subdivides as a three.
Primary wave 4 is likely to end within the price territory of the fourth wave of one lesser degree; intermediate wave (4) has its range from 42.03 to 62.58.
Primary wave 4 may end if price comes up to touch the upper edge of the maroon channel.
Primary wave 4 is most likely to be shallow to exhibit alternation in depth with primary wave 2. The 0.382 Fibonacci ratio at 45.52 is within the price range of intermediate wave (4), so this is the most likely target.
Primary wave 4 may not move into primary wave 1 price territory above 74.96.
DAILY ELLIOTT WAVE COUNT
Click chart to enlarge.
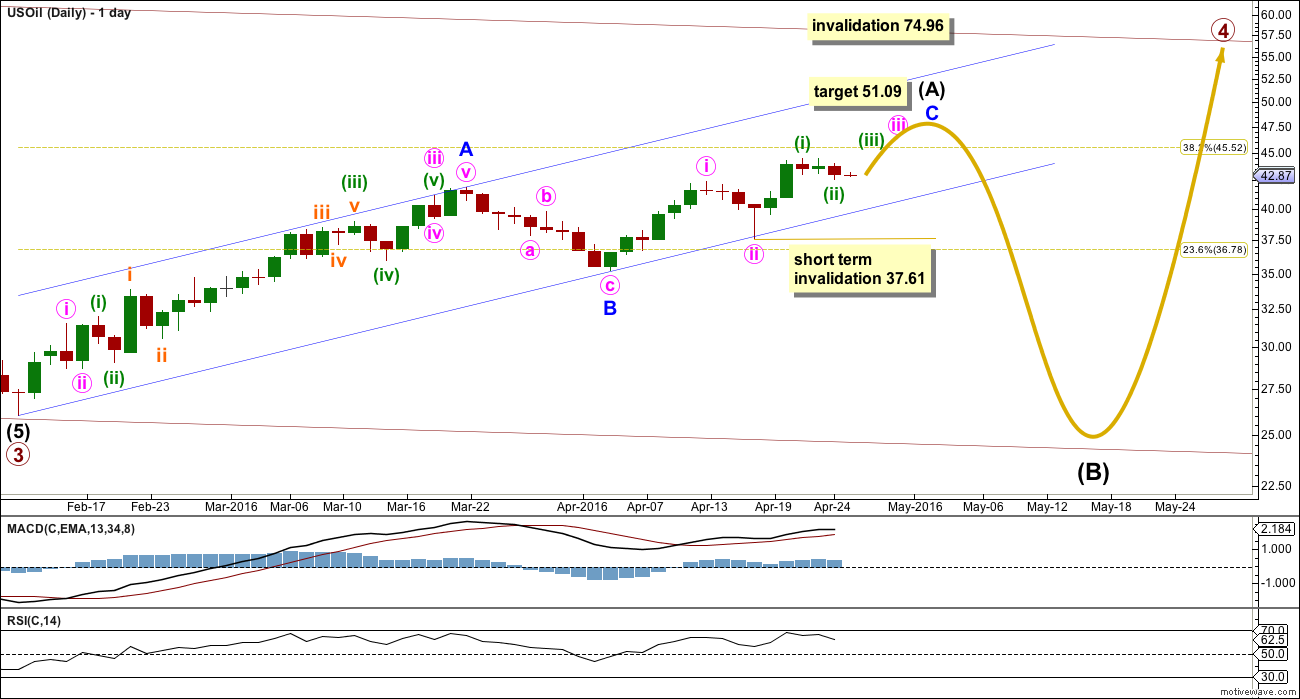
Intermediate wave (A) is incomplete. It looks like it is unfolding as a zigzag.
If minor wave B within the zigzag is complete, then at 51.09 minor wave C would reach equality in length with minor wave A.
Minor wave C must be a five wave structure. At this stage, it looks like it may be unfolding as an impulse. Within minor wave C, minuette wave (ii) may not move beyond the start of minuette wave (i) below 37.61.
A new high above 44.49 would invalidate the alternate daily count below and provide confirmation of this main daily wave count.
When intermediate wave (A) is a complete zigzag, then intermediate wave (B) downwards should be expected. It may be very deep. If it is over 0.9 the length of intermediate wave (A), then primary wave 4 may be a flat correction. Intermediate wave (B) of an expanded flat or running triangle may make a new low below the start of intermediate wave (A) at 26.06. There is no lower invalidation point at that stage for this wave count because there is no rule stating the limit for the length of a B wave within a flat or triangle, nor an X wave within a combination.
ALTERNATE DAILY ELLIOTT WAVE COUNT
Click chart to enlarge.
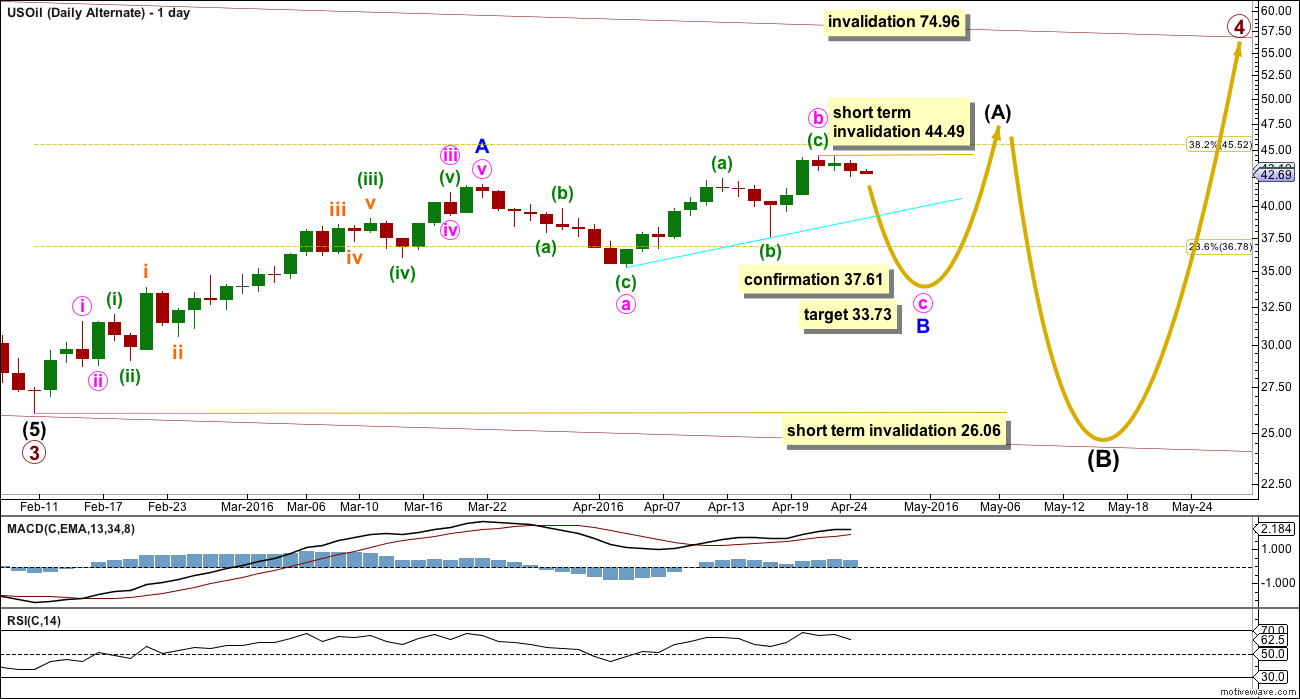
It is still possible that minor wave B is an incomplete expanded flat correction.
Minute wave b is a 1.39 length of minute wave a. This is just longer than the common range of 1 to 1.38 and is entirely acceptable.
At 33.73 minute wave c would reach 1.618 the length of minute wave a.
Minor wave B may not move beyond the start of minor wave A below 26.06 because minor wave A is a five wave structure.
Within minute wave c, no second wave correction may move beyond the start of its first wave above 44.49.
TECHNICAL ANALYSIS
MONTHLY CHART
Click chart to enlarge. Chart courtesy of StockCharts.com.
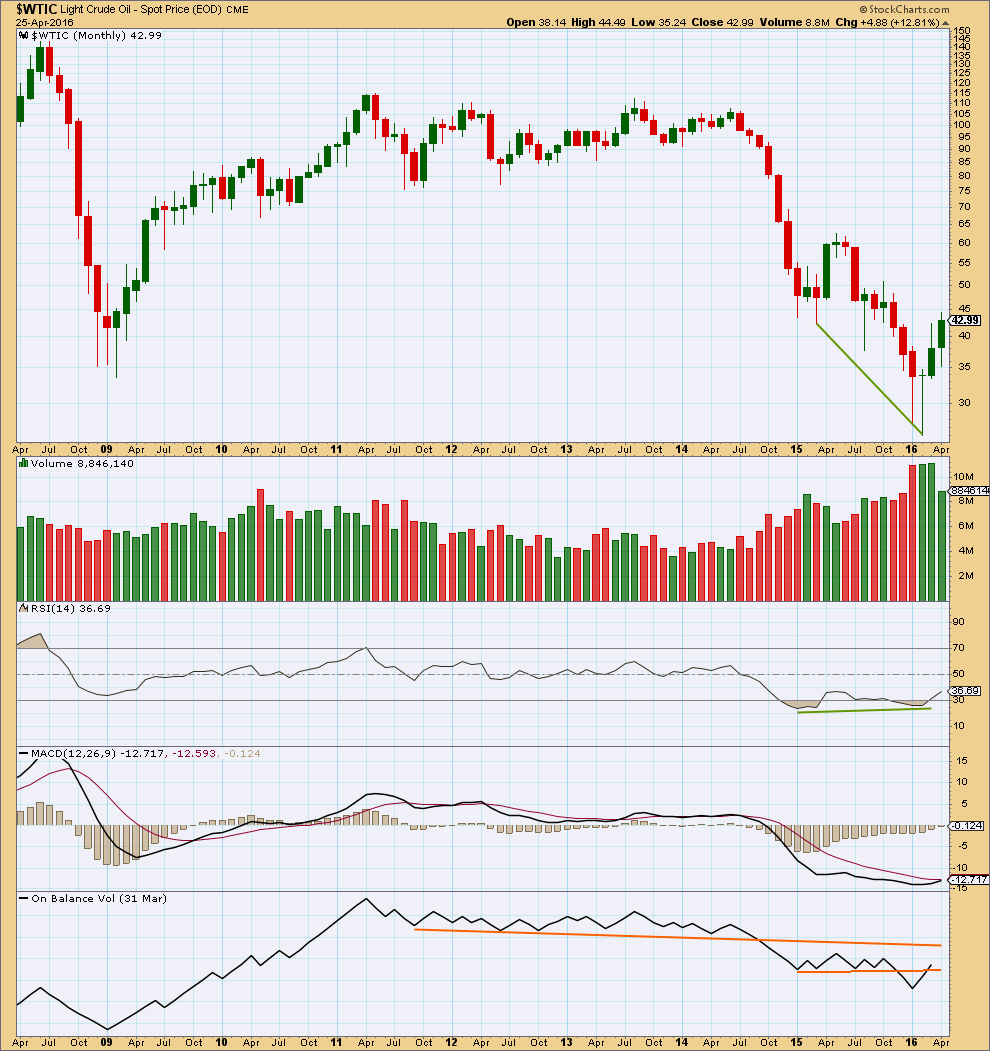
Price shows divergence with RSI as price moved lower.
The fall in price was supported by volume. The rise in price from the low in February is supported by volume. This favours a bullish outlook.
The three monthly candlesticks for January, February and March create a Morning Doji Star reversal pattern. However, this is a warning of a trend change and not definitive. There is an example of a stronger candlestick reversal pattern on this monthly chart for March and April 2015. April 2015 completed a bullish engulfing candlestick pattern; this is the strongest reversal pattern and this example was particularly strong. Yet it only translated to one more month of slight new highs in May before the downwards trend resumed.
On Balance Volume has broken below two trend lines. OBV is beginning to break above the lower line. If the month of April can close with OBV above the lower orange line, that would be a reasonably strong bullish signal in support of the main Elliott wave count.
DAILY CHART
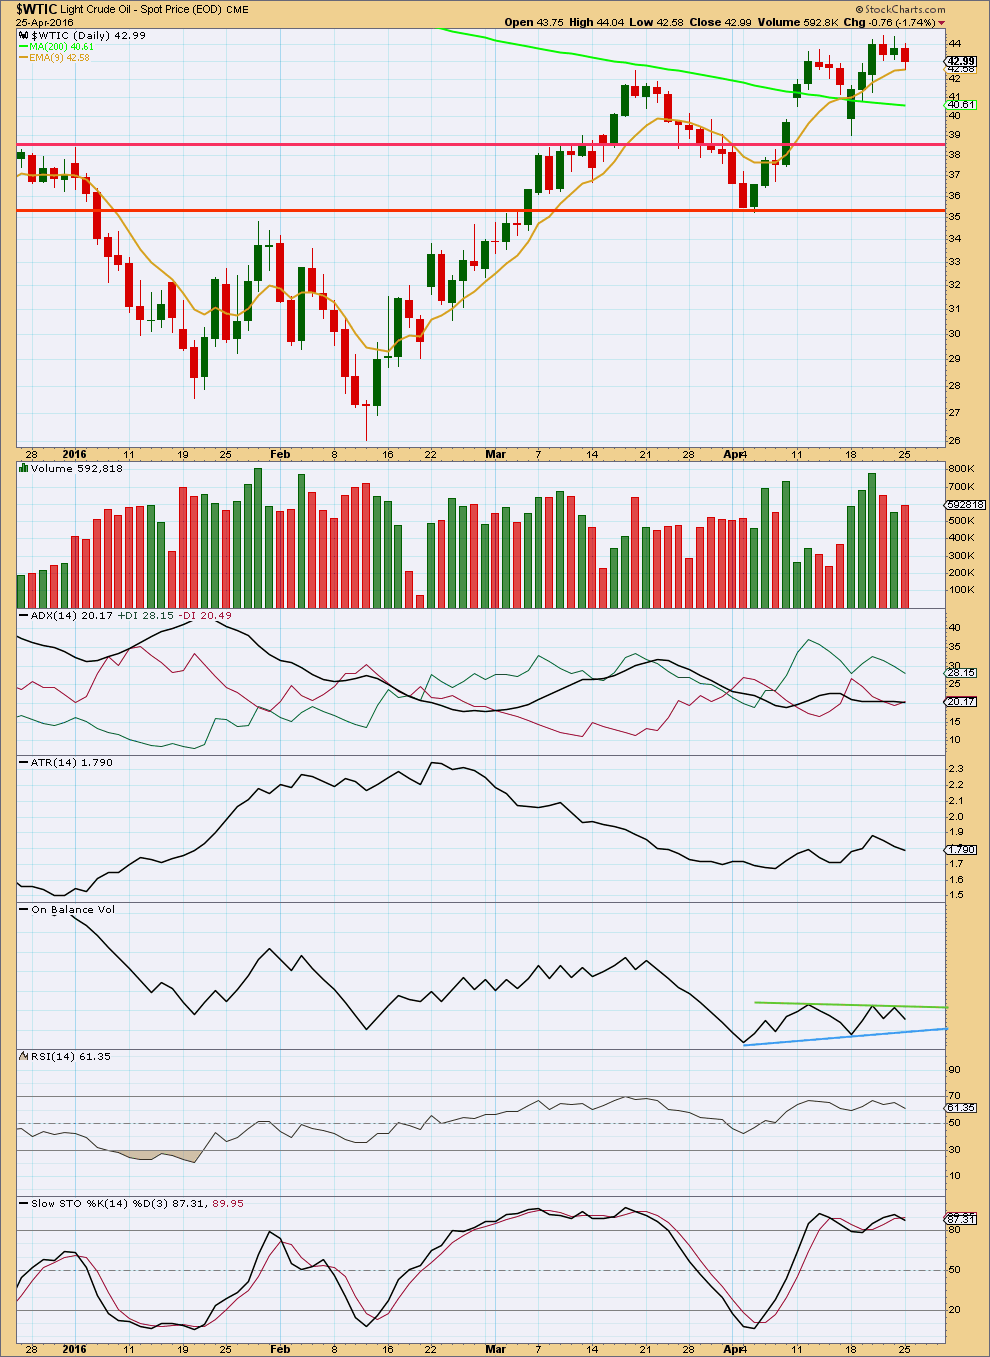
Click chart to enlarge. Chart courtesy of StockCharts.com.
Volume increases as price moves higher. The rise in price is supported by volume. This favours a bullish outlook short and mid term. It favours the main Elliott wave count over the alternate.
The last three days of downwards / sideways movement come on declining volume. This looks like a countertrend movement.
ADX is flat, not indicating a trend. ATR is declining; this too does not indicate a trend. These both indicate the market is currently consolidating. If they both turn up, that would again indicate a trend. If a trend resumes, it would be up; the +DX line remains above the -DX line.
On Balance Volume is constrained within two trend lines. A break above the green line would be bullish. A break below the blue line would be bearish.
This analysis is published @ 01:24 a.m. EST on 26th April, 2016.
Lara is wave 3 of A is completed here..??
Not quite.
Here is one possible count continuing on from Lara’s Main Daily Count. Although I have not shown it, Minuette iii may be extending, not ending here.
If it were to end here it would be shorter than Minuette i, meaning that Minuette v would have to shorter still, giving this impulse a very non-classical look.
However note that, at least so far, the MACD for this last wave is weaker than Minuette i. Normally wave iii would have a stronger if not the strongest momentum in an impulse.
Once this move up is complete in May, the seasonal trend should support the next move down.
Any wave count here ???
Volume continues to be strong as we move up. RSI is not yet overbought. ADX looks to be turning up. Looks like Lara’s main daily count is in play.