
Last week’s analysis of US Oil expected more downwards movement, which is what happened.
Summary: Downwards movement is expected to continue for several weeks although it may not be in a straight line, a B wave upwards may yet unfold within it. How low downwards movement goes may indicate which wave count is correct. Downwards movement may only be a second wave correction to end about 31.21. A new low below 26.06 would confirm an extending fifth wave to move substantially lower with the next target at 11.98. Classic technical analysis favours the main Elliott wave count.
New updates to this analysis are in bold.
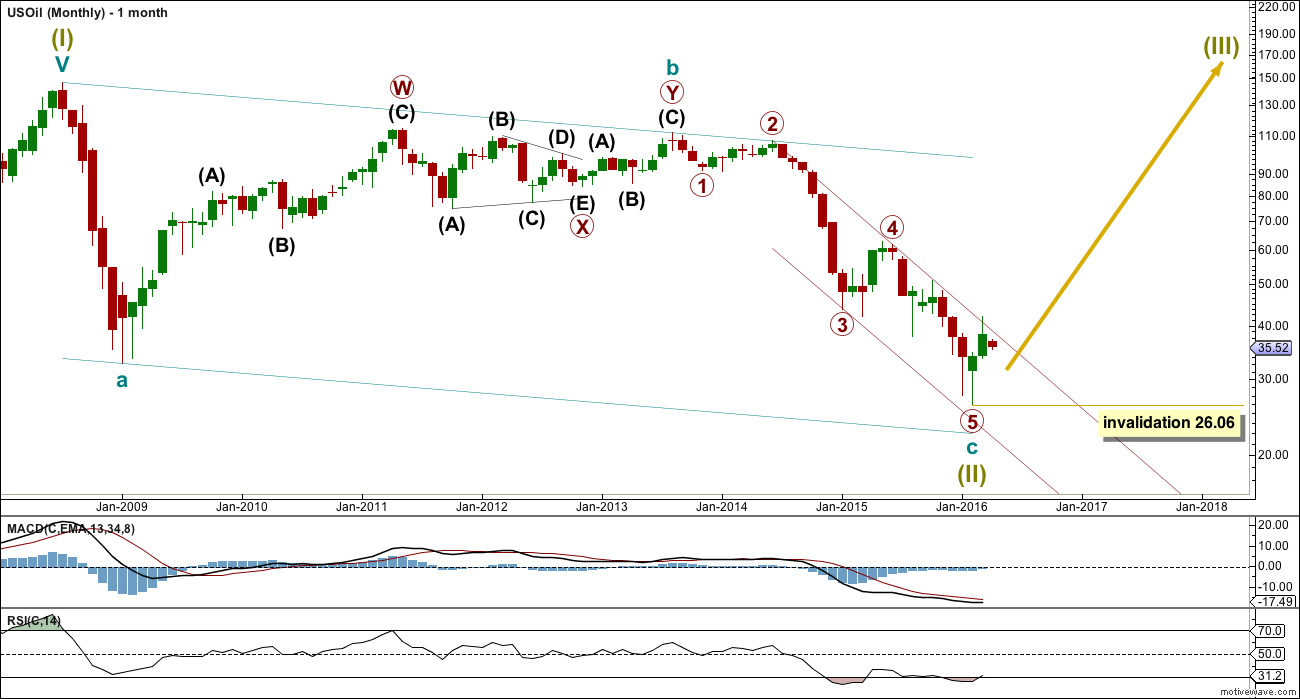
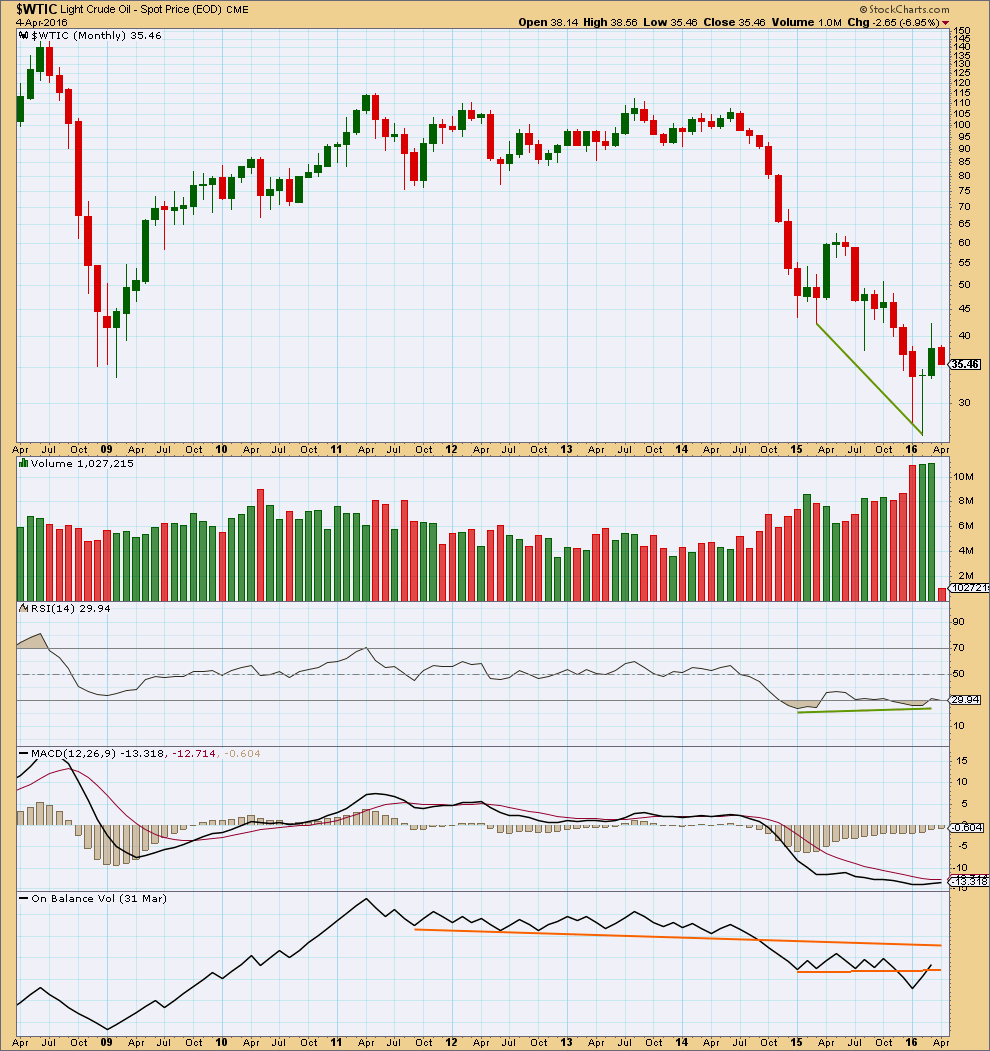
MONTHLY ELLIOTT WAVE COUNT
Click chart to enlarge.
US Oil has been in a bear market since August 2013. While price remains below the upper edge of the maroon channel drawn here and below the 200 day simple moving average it must be accepted that the bear market most likely remains intact. Price has turned back down from the 200 day moving average and back into the maroon channel.
The structure of primary wave 5 may be complete. This wave count has a problem though: primary wave 5 looks like a three wave structure at the monthly chart level. It may only subdivide as a five.
If primary wave 5 is complete, then the zigzag of Super Cycle wave (II) would also be complete. Super Cycle wave (III) must move above the end of Super Cycle wave (I) at 146.76. Within Super Cycle wave (III), no second wave correction may move beyond the start of its first wave below 26.06.
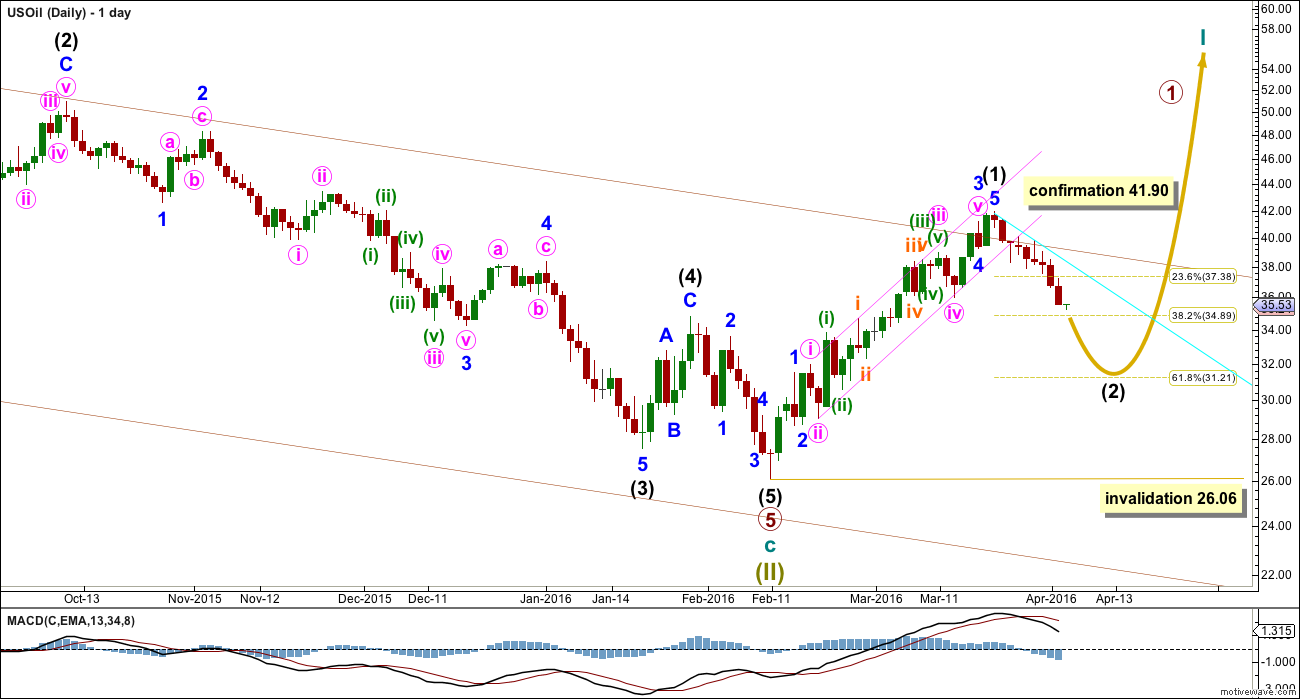
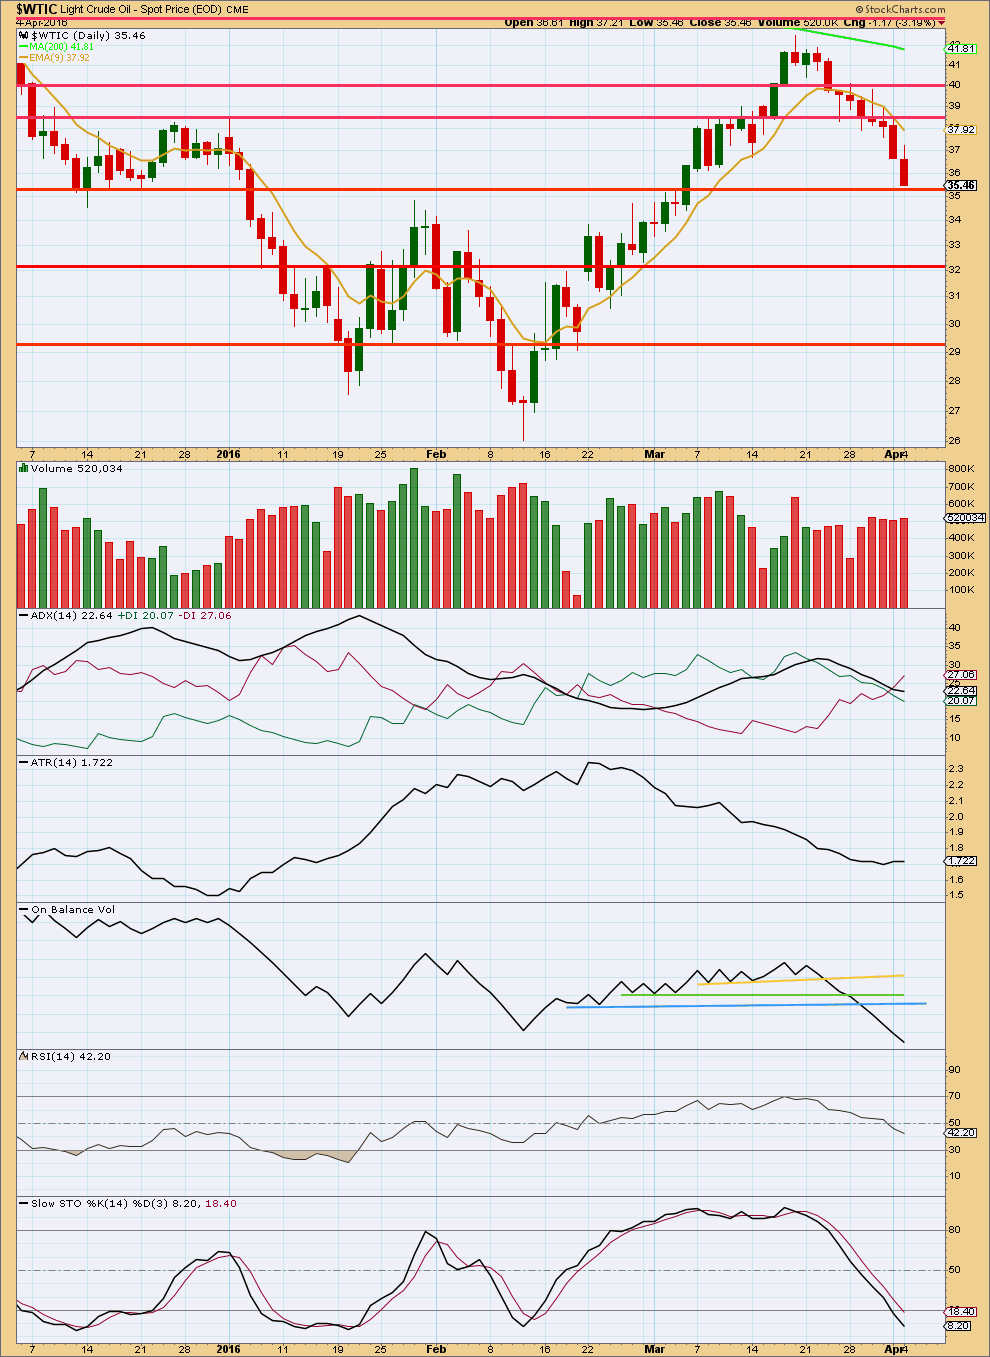
DAILY ELLIOTT WAVE COUNT
Click chart to enlarge.
This wave count is identical to the alternate below up to the high labelled intermediate wave (2).
The maroon channel is slightly redrawn. Draw the first trend line from the ends of primary waves 2 to 4, then place a parallel copy on the end of primary wave 3. The channel has been breached by one small daily candlestick. With price immediately returning into the channel, this breach is unconvincing, but it is a warning that the trend may have changed.
If Super Cycle wave (II) is a complete zigzag, then Super Cycle wave (III) must begin upwards. So far intermediate wave (1) may now be complete as an impulse.
Intermediate wave (1) lasted 28 days (not a Fibonacci number). Intermediate wave (2) should last longer; corrections are usually more time consuming than impulses, particularly first wave impulses. Intermediate wave (2) is most likely to be a zigzag and most likely to end about the 0.618 Fibonacci ratio at 31.21.
Intermediate wave (2) may not move beyond the start of intermediate wave (1) below 26.06.
Intermediate wave (2) is likely to have a three wave look to it on the daily chart. At some stage, a B wave must unfold within this correction.
The cyan trend line is drawn to show the upper limit for resistance to this new downwards trend. If price breaks above this line, then minor wave B would most likely have arrived.
Second wave corrections are most often deep. Sometimes they can be very deep.
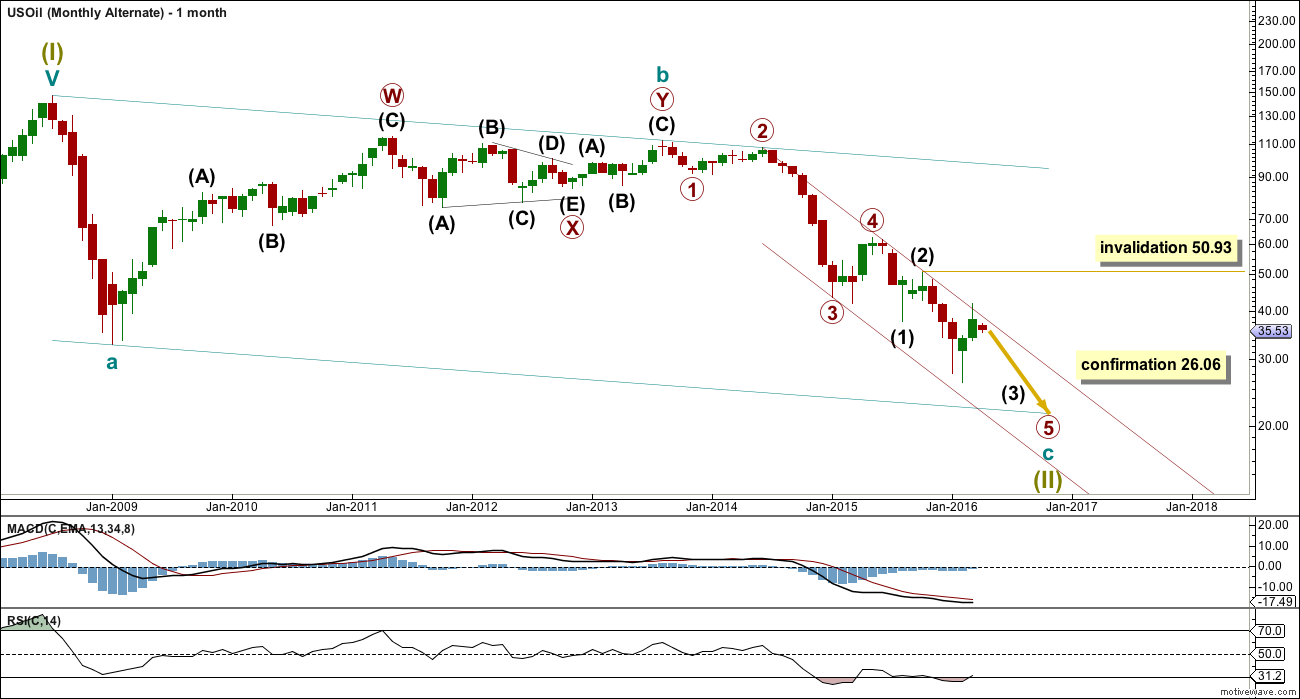
ALTERNATE MONTHLY ELLIOTT WAVE COUNT
Click chart to enlarge.
With the maroon channel being overshot, now this wave count has reduced in probability.
This wave count expects to see an extended wave for primary wave 5, which is common for commodities. This wave count expects primary wave 5 to look like a five wave structure on the monthly chart when it is complete.
Cycle wave c may end with an overshoot for the lower teal trend line for this wave count.
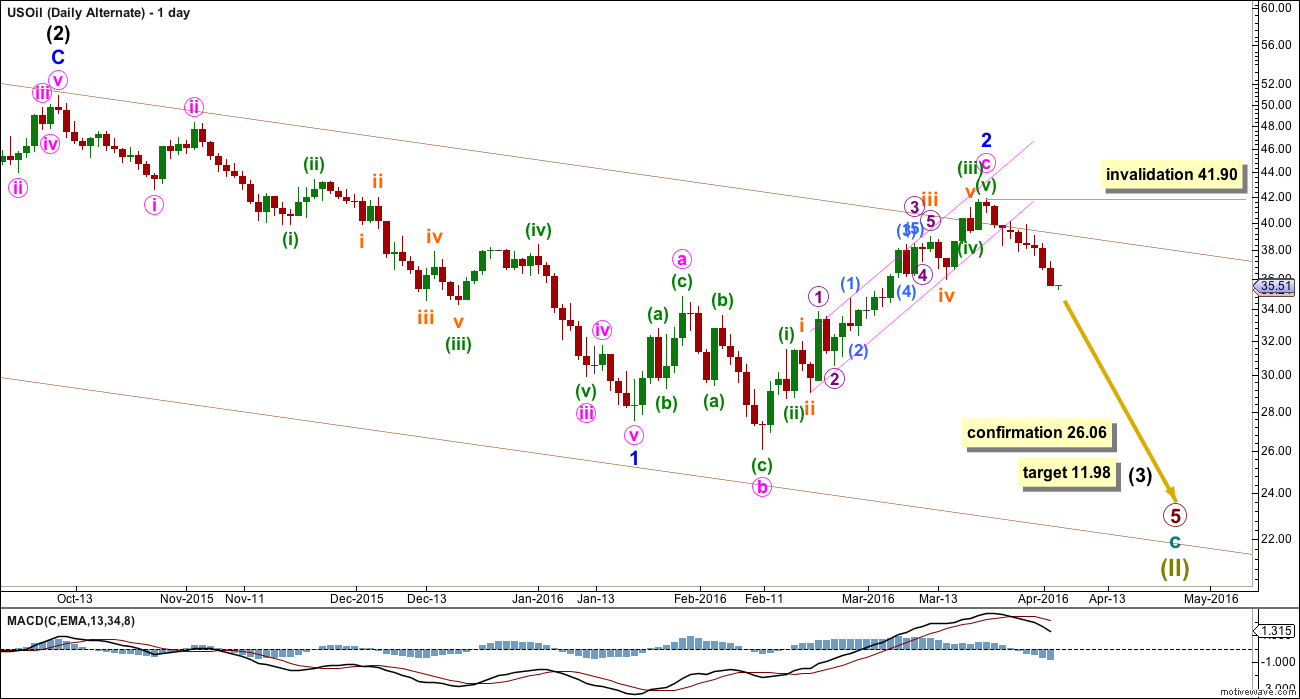
ALTERNATE DAILY ELLIOTT WAVE COUNT
Click chart to enlarge.
If there has been no trend change and if primary wave 5 is incomplete, then at this stage this is the best wave count I can see.
This wave count is identical to the main wave count up to the high labelled intermediate wave (2).
Thereafter, it sees only minor waves 1 and 2 within intermediate wave (3) complete. Minor wave 2 is seen as an expanded flat correction.
Minor wave 2 is ten days longer in duration than intermediate wave (2) one degree higher. This wave count now has a problem with proportions.
Minor wave 2 should have found strong resistance at the upper edge of the channel. It should not be showing up so strongly on the monthly chart. This now gives the wave count an atypical look which reduces its probability.
Minor wave 2 may have ended just above the 0.618 Fibonacci ratio of minor wave 1.
At 11.98 intermediate wave (3) would reach 1.618 the length of intermediate wave (1).
If price makes a new low below 26.06, this wave count would be confirmed.
Within minor wave 3, no second wave correction may move beyond the start of its first wave above 41.90.
TECHNICAL ANALYSIS
MONTHLY CHART
Click chart to enlarge. Chart courtesy of StockCharts.com.
Price shows divergence with RSI as price moved lower.
The fall in price was supported by volume. The rise in price from the low in February is supported by volume. This favours the main wave count.
The three monthly candlesticks for January, February and March create a Morning Doji Star reversal pattern. However, this is a warning of a trend change and not definitive. There is an example of a stronger candlestick reversal pattern on this monthly chart for March and April 2015. April 2015 completed a bullish engulfing candlestick pattern; this is the strongest reversal pattern and this example was particularly strong. Yet it only translated to one more month of slight new highs in May before the downwards trend resumed.
On Balance Volume has broken below two trend lines. If OBV can break above the lower line, this would be a bullish signal and would support the main Elliott wave count. The month of April needs to be complete before a break above this line would be indicated.
DAILY CHART
Click chart to enlarge. Chart courtesy of StockCharts.com.
Volume rises as price falls. This supports the fall in price.
Price may find some support about 35.50.
ADX has now indicated a trend change: the -DX line has crossed above the +DX line. ADX and ATR may both be beginning to flatten off indicating a new trend may be developing.
On Balance Volume has broken below three trend lines, all bearish indicators. However, OBV has made a new low below the prior low of 11th February while price has not. This indicates some weakness in price and favours the main Elliott wave count which sees this downwards movement as a counter trend movement.
Stochastics is reaching oversold, but this oscillator may remain extreme for reasonable periods of time during a trending market. RSI is not yet extreme. There is still room for price to fall.
This analysis is published @ 01:26 a.m. EST on 5th April, 2016.
US oil Inverted HnS in 4 hour period possibility??
NL: 40.18 across
Head : 35.54
LS : 38.44 in place
RS: 35.44????? to be formed
OR it is on its way down or sideways???
As Papudi stated below, it looks like Intermediate 2 may be turning into a flat or an expanded flat. A move above 41.19 is likely for a flat and it could go above 41.90 for an expanded flat. I don’t think Intermediate 2 is over. Thoughts?
My guess is a flat rather than an expanded flat.
As we approach the OPEC meeting on the 17th, I believe doubts will begin to accumulate preventing new highs. If there is a meaningful agreement (unlikely IMO) then all bets are off. More likely, Crude will top out soon and mark time until the meeting. Thereafter, could be fireworks to the downside.
What ever it is worth????
Perfect storm brewing in oil patch
http://thegreatrecession.info/blog/perfect-storm-for-oil-prices/
US Oil daily chart as of Friday has a bullish candlesticks pattern. Two rising white candle and small doji in between. As suspected Monday will be another white candle an up day.
Any clue what next for wave counts??? Expanded flat structure with wave A down complete and wave B to test 42.49???
Price topped at 39.81, very slightly above my target. That would very likely be it. It is very close to the 4th wave of Minor A (at 39.85), the 0.618 Fibonacci resistance, as well as minute c = minute a. The only way in which I might be wrong is if price movement continues upwards next week and breaches the 42.49 high.
If my analysis is correct, then Minor C would have begun. I am expecting a 5-wave decline targeting 32.56 (Minor C = Minor A), or 32.33 (Fib 0.618 retrace of Intermediate 2 vis-a-vis Intermediate 1).
On the hourly chart, the slow decline (5 hourly candles) into yesterday’s close appears to support the beginning of Minor C. If so, I will load up on shorts first thing Monday morning.
(If the alternate count is correct, the target will be even lower, so if it happen to happen, it will be a bonus).
Have a great weekend, everybody.
Sounds like a good plan.
Thanks Alan.
What would you call this wave structure ZZ or running flat from 42.49 top??
Lara’s blue line held the resistance.
Hi Papudi.
C waves must be 5-wave structures. Right now it is too early to tell what form they will take. The most common would be a simple zigzag, but it doesn’t matter. Unless of course you intend to play intra-wave. That may have to wait for more structure to show up.
At 1:30 US oil in 30 min period formed a candlesticks bearish chart part pattern Tower Top. Refer to Steve Nison book fig 6.59 on page 120.
Lets see if this holds and wave b is complete here. Plus weekly 30 ema at 39.17 is support and if this gives way oil may on way down.
I am EW illiterate ???
What if bottom at $26.05 is end of bear trend like main wave count???
The move from $26.05 is expanded flat and moved to $42.49 in wave a. Wave b down to retrace atleast 90% of wave a.
That will put the wave b target around $27.68
What determines int wave (I) vs expanded flat?????
thanks.
The move from $26.05 to $42.49 was an impulse with an extended 3rd wave. That’s how Lara has both her main and alternate wave counts labeled, and I think that’s correct.
It was either wave 1 of a new bull market (main bull wave count) or wave c of an expanded flat correction (alternate bear wave count).
The recent down-up movement since the $42.49 high is now looking corrective to me, which would seem to support Lara’s main wave count.
What we don’t know yet is whether the downward 3-wave move from the $42.49 to $35.24 is a complete correction in itself or merely the A wave of a larger 3-wave corrective structure.
(Lara, if I’m seeing this all wrong, please set me straight, okay? Thanks!)
Hi Curtis. I concur.
Only that I am more inclined to think that the move down to 35.24 is merely an A wave.
I agree. It looks too small to be an entire 2nd wave. So if the current upward move is B, then it could potentially make a new high above $42.49 before turning back down in a C wave.
Hi Papudi.
B waves are notorious in that there are too many possibilities. Your 90% retrace assumes a flat which may not be the case. It is still too early to tell whether it is so.
My updated count.
Price has gone higher than 38.30 just now which puts my original count in jeopardy. I now have two revised counts.
The one which aligns with Lara’s main count has us now beginning Minute C of Minor B. Minor B ended earlier at 35.24 (to avoid invalidation). Yesterday’s high of 38.30 was Minute A and the low at 36.69 Minute B. This count yields Minute C terminating at 39.75. At Intermediate 2 degree, Minor B will end at 39.72. The two counts produce targets which are pretty close, and so may be correct.
The other considers the scenario where a H&S had already formed. The current rise to 38.30+ is a pullback before a much larger fall. This aligns with Lara’s alternate count.
I can only say that if price proceeds much higher from now, then the first count is correct. But, if price moves lower, then the second count is favoured.
Apologies, I can’t produce a chart. The data feed I use does not allow annotation on the graphs. And to do annotation on a Word file takes an undue length of time. We traders do not have that luxury.
Yup… charts would help us here. I, too, have not figured out a slick way to annotate price charts. So I resort to written descriptions, which can get pretty confusing.
Alan
How high do you expect Minor wave B to be before Minor wave c down begins?
Probably wave B to retrace 90% of wave A??
Wave A 41.92 to 35.22= 6.7
Wave B 35.22 + 0.9*6.7= 41.25???
Am I correct?
My thought… if price exceeds 38.34 in the next few hours, we can have confidence that it’s either minor B or intermediate 3. Below 38.34, I’m thinking it could still be wave 4 of 5.
As always, I defer to brighter bulbs.
Hi Papudi.
I’m thinking Minor A will end between 35.36 and 35.91.
(I consider 38.26 as the end of minuette 4).
I have Minor A begin at 42.49.
So, if we consuder the common 0.618 retrace for Minor B, it would end at 39.77 or 39.98.
Still no certainty yet.
From: https://www.tradingview.com/chart/USOIL/9T16Ccr7-US-OIL-Possible-H-S-Pattern-Formation-in-Process/
What do you think?
Oil bounced hard off $35.50-ish, just like Lara expected. Good call!
I happily defer to Lara and all better EW students than me, but it appears that we may now have three waves down for either a very short and shallow intermediate wave (2) or, I suspect more likely, only minor wave A of (2).
If intermediate (2) is complete, then this upward movement would be the beginnings of intermediate (3). But I suspect it’s more likely that we’re seeing only minor B of (2) which, when complete, should be followed by a nice C wave down to perhaps near Lara’s target range.
OTOH, if the bear wave count is still in play, then it looks like we may be piling up a series of imbedded first and second waves downward.
Thoughts anyone?
My count is that we have reached the high of 38.26. This is minuette 4 of minute C of Minor A of Intermediate 2.
Shorted at market open this morning for a short play of sub-minuette 1. Exited 5 minutes ago. Gained just a bit more than 5%. Now undergoing sub-minuette 2. Expecting Minor A to complete between 35 and 36.
Lara is superb in her analysis. We’ll just have to fill in the gaps intra-day. Works perfectly!
Good play Alan. It’s great to have you back!
Thanks Curtis, old buddy. I mentioned in the gold forum that I was away for an eye operation. Glad to reconnect with friends again.
Yup. I saw that.
US Oil price is finding support at $35.50.
On Feb 29 report Lara:” That cannot be done yet because the structure is incomplete. Primary wave 5 has to unfold lower and must complete as a five wave structure. Within primary wave 5, intermediate waves (4) and (5) should show up clearly on the monthly chart.”
Did these above conditions met as regard to waves c and int (4) ????
Int wave (5) needs to be unfolding if bear wave count is in play????
Looks like the Downwards movement has ended?
Another blog on stage analysis with examples.
http://www.nextbigtrade.com/stage-analysis/
Enjoy!!!!!
Thanks Lara.
US oil has not shown bottom just yet. A bullish divergence on weekly just got resolved by RSI going higher than 50 and falling below.
Also according to Stan Weinstein’s 30 weekly ema model oil fell below it the third time and hope it continues down from here. It is still in Stage 4.
Stan Weinstein model site:
http://www.robertbrain.com/technicalanalysis/weinstein.html
Also on daily chart now oil is below 9ema and falling.
On monthly chart oil touched 9ema and is trading below it.
Let see if $31 will hold as wave b.