
Upwards movement was expected for Tuesday’s session. Price moved sideways to complete a small green doji.
Summary: It is still most likely that price will begin a third wave up from here or very soon. The target remains at 1,477 and risk remains at 1,237.97.
New updates to this analysis are in bold.
Last published weekly chart is here.
DAILY ELLIOTT WAVE COUNT
Click chart to enlarge.
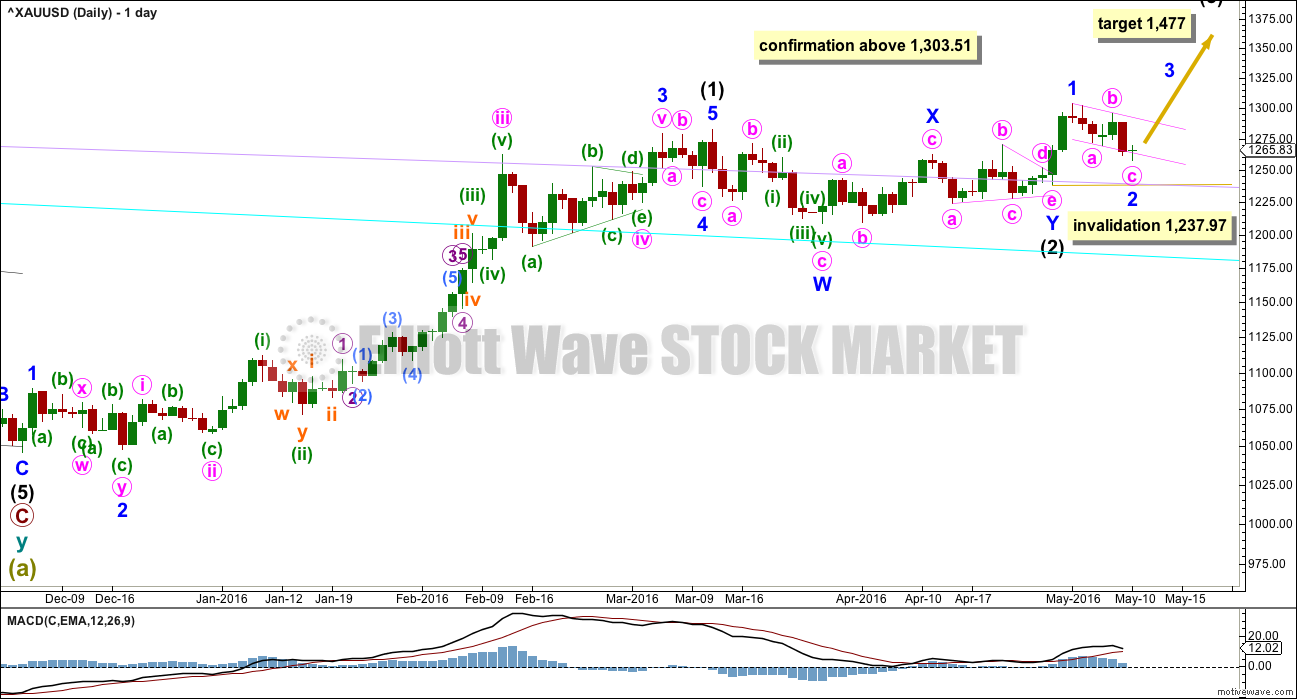
Intermediate wave (2) may be a double combination.
Minor wave W is a zigzag, the first structure in a double. The two structures in the double may be joined by a simple zigzag for minor wave X in the opposite direction.
Minor wave Y may be a running contracting triangle. The triangle is supported by MACD hovering at the zero line here on the daily chart.
Minor wave 2 may not move beyond the start of minor wave 1 below 1,237.97.
The next wave up for intermediate wave (3) should be swift and strong. It must move above the end of intermediate wave (1) at 1,282.68. It must move far enough above this point to allow room for intermediate wave (4) to unfold and remain above intermediate wave (1) price territory.
At 1,477 it would reach equality in length with intermediate wave (1). This target is reasonable because intermediate wave (2) was very shallow.
If intermediate wave (2) is over as labelled, then it may have totalled a Fibonacci 34 sessions.
Minor wave 2 has moved lower and is now 0.71 the depth of minor wave 1. Minor wave 1 lasted two days. Minor wave 2 now has lasted a six days. If it is over here, it would still have good proportion and look like a clear three wave structure on the daily and hourly charts.
HOURLY ELLIOTT WAVE COUNT
Click chart to enlarge.
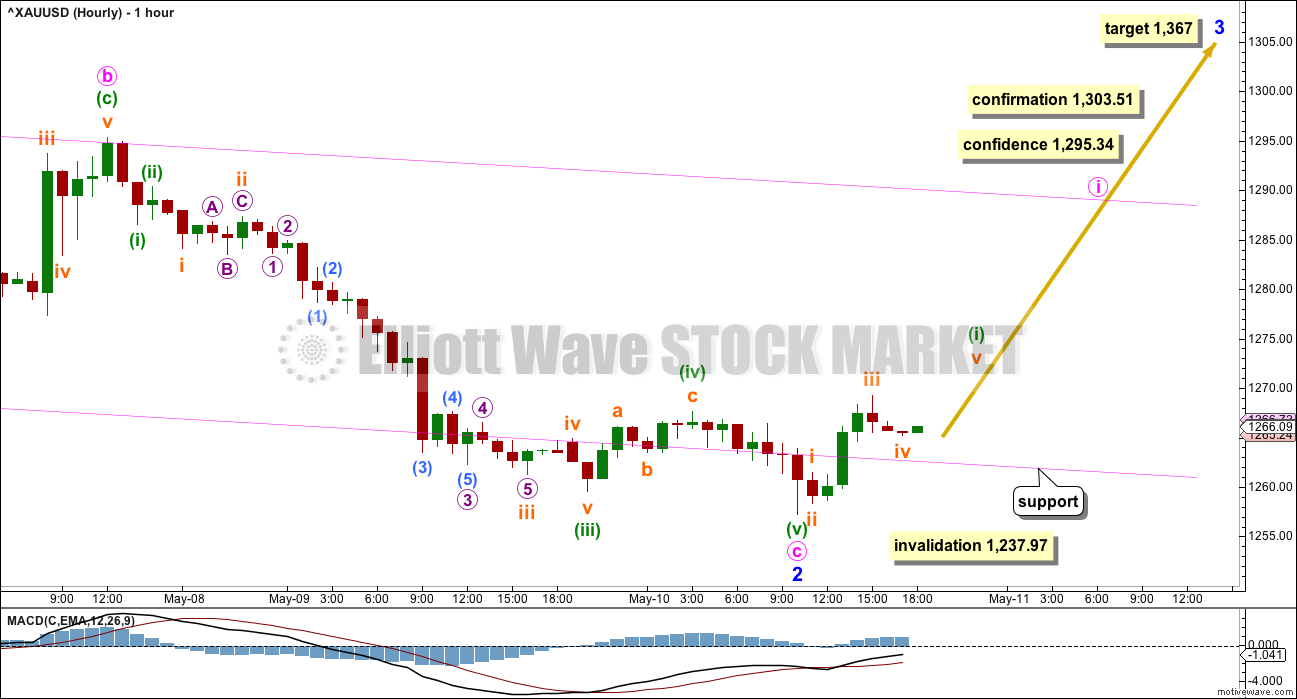
Minor wave 2 fits as a zigzag. Minute wave a must be seen as a five wave structure. This will fit although it does seem a little forced.
Minute wave c no longer has a Fibonacci ratio to minute wave a.
Within minor wave 3, a first wave may be close to completion for minuette wave (i). If upwards movement makes a new short term high, it may be subminuette wave v. If that is followed by a three wave structure downwards which does not make a new low, then some confidence may be had in a trend change.
When minuette wave (i) is a complete impulse, then the following three wave structure downwards for minuette wave (ii) may find support at the pink trend line, copied over from the daily chart. If price behaves like that in the next 24 hours, it may offer a good entry point for a long position on Gold.
The invalidation point and risk must remain at 1,237.97 while there is no confirmation of a trend change.
Confidence may be had in a trend change with each of these conditions being met, in order:
1. A five up followed by a three down which does not make a new low.
2. A breach of the upper edge of the pink channel.
3. A new high above 1,295.34.
4. A new high above 1,303.51. This will be final confirmation.
Depending upon risk appetite, members may choose to wait for one or more of these conditions to be met before entering long. Manage risk carefully. The risk of a loss on a long position here must be accepted. The alternate wave count does remain viable, although unlikely. Do not invest more than 3-5% of equity on any one trade, and always use a stop loss to protect your account.
At 1,367 minor wave 3 would reach 1.618 the length of minor wave 1. If this target is wrong, it may be too low. The next possible target would be at 2.618 the length of minor wave 1 at 1,433.
Minor wave 3 may only subdivide as an impulse. Within the impulse, minute wave i may begin about here. When it arrives minute wave ii may also be deep and may also be time consuming.
It would not be until the middle that acceleration to the upside may be expected to be clear for minor wave 3. The fourth wave corrections within it may be quick and shallow, and the fifth waves to end minor wave 3 and then the final fifth wave up of minor wave 5 also may be expected to be very strong movements, completing blowoff tops for Gold.
ALTERNATE DAILY ELLIOTT WAVE COUNT
Click chart to enlarge.
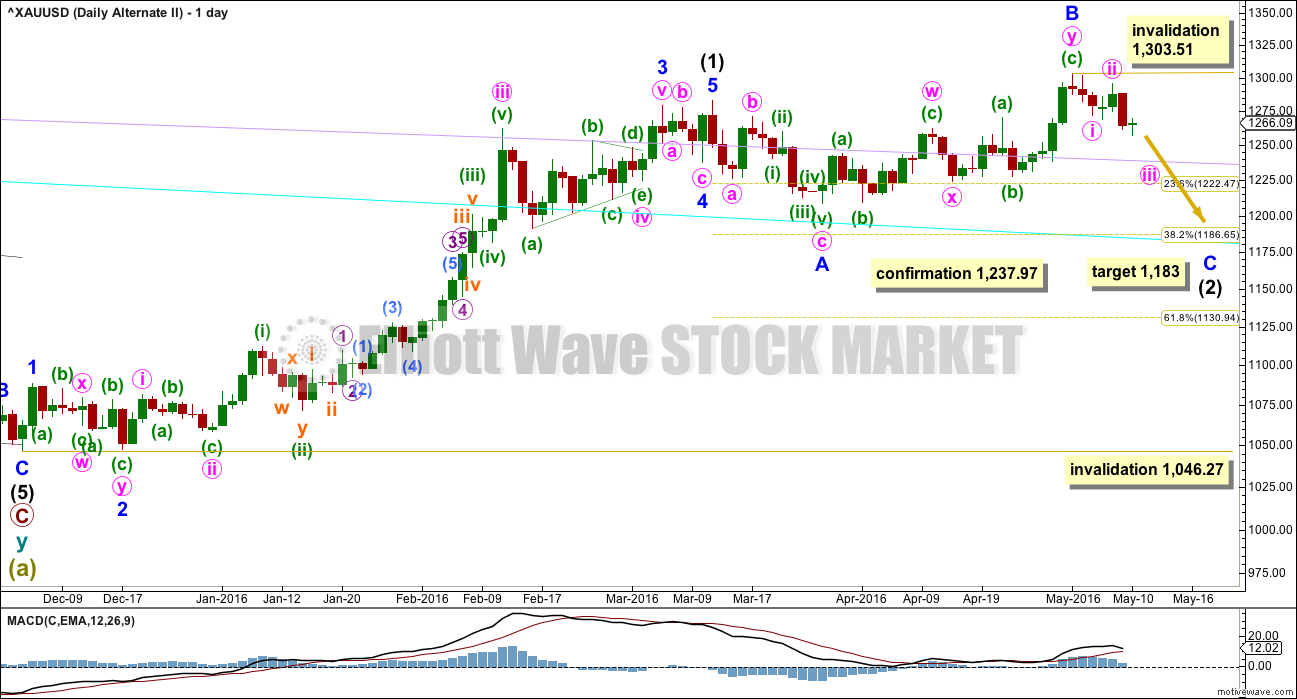
It is still possible that intermediate wave (2) is not over.
Normally, the first large second wave correction within a new trend is very deep, often deeper than the 0.618 Fibonacci ratio. The main wave count sees intermediate wave (2) as very shallow at only 0.19 of intermediate wave (1). This is unusual. And so this alternate must be considered.
If any members have long positions on Gold already it is essential that stops are used in case this alternate unfolds.
Intermediate wave (2) may be an expanded flat correction. Minor wave A is a three, minor wave B is a three and a 1.28 length of minor wave A. This is within the normal range of 1 to 1.38.
At 1,183 minor wave C would reach 1.618 the length of minor wave A. This would be the most likely target. If price keeps falling through this first target, then the second target would be at 1,108 where minor wave C would reach 2.618 the length of minor wave A.
Intermediate wave (2) may not move beyond the start of intermediate wave (1) below 1,046.27.
ALTERNATE HOURLY ELLIOTT WAVE COUNT
Click chart to enlarge.
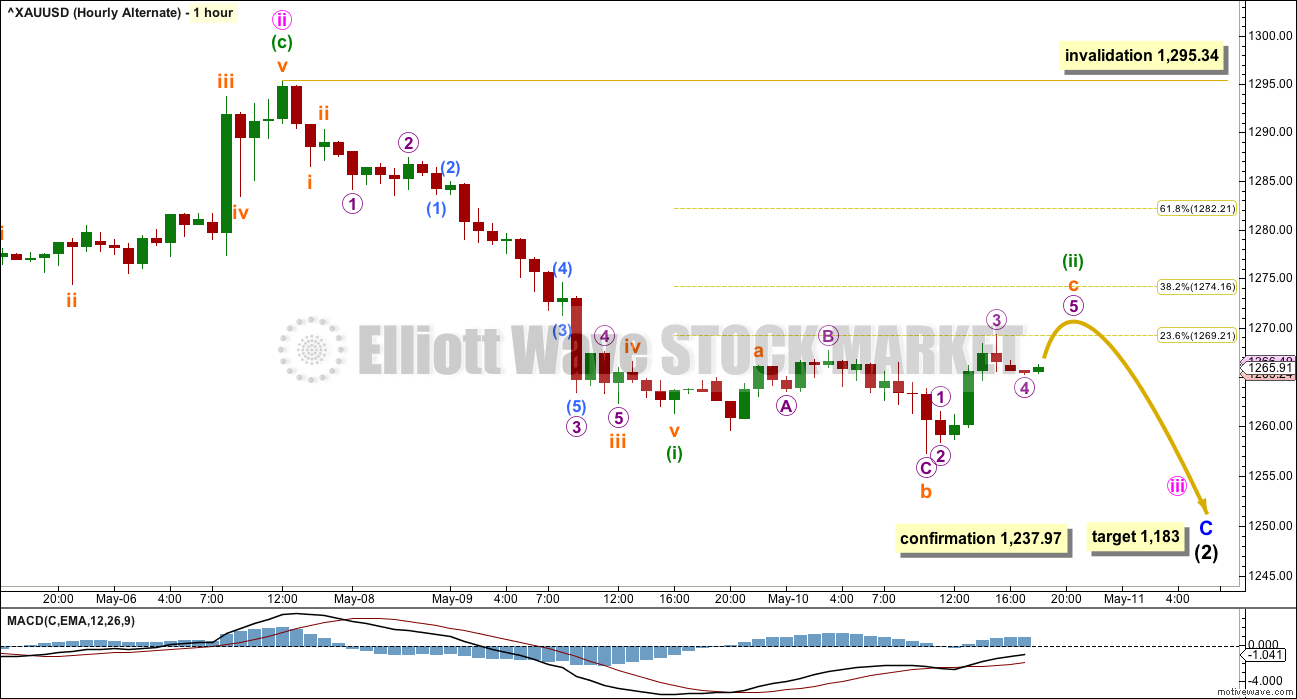
Minor wave C must subdivide as a five wave structure. So far only minute waves i and ii may be complete.
Minute wave iii must subdivide downwards as an impulse. It would be unlikely to be over because that does not allow enough room for upwards movement for minute wave iv to unfold and remain below minute wave i price territory.
Minute wave iii is most likely to be incomplete. Minuette wave (i) is a complete impulse. Minuette wave (ii) may be close to complete as an expanded flat correction. At 1,270 subminuette wave c would reach 2.618 the length of subminuette wave a. As soon as subminuette wave c is a complete five wave structure, then minuette wave (ii) should be over.
Thereafter, minuette wave (iii) must make a new low below the end of minuette wave (i).
Minuette wave (ii) may not move beyond the start of minuette wave (i) above 1,295.34.
TECHNICAL ANALYSIS
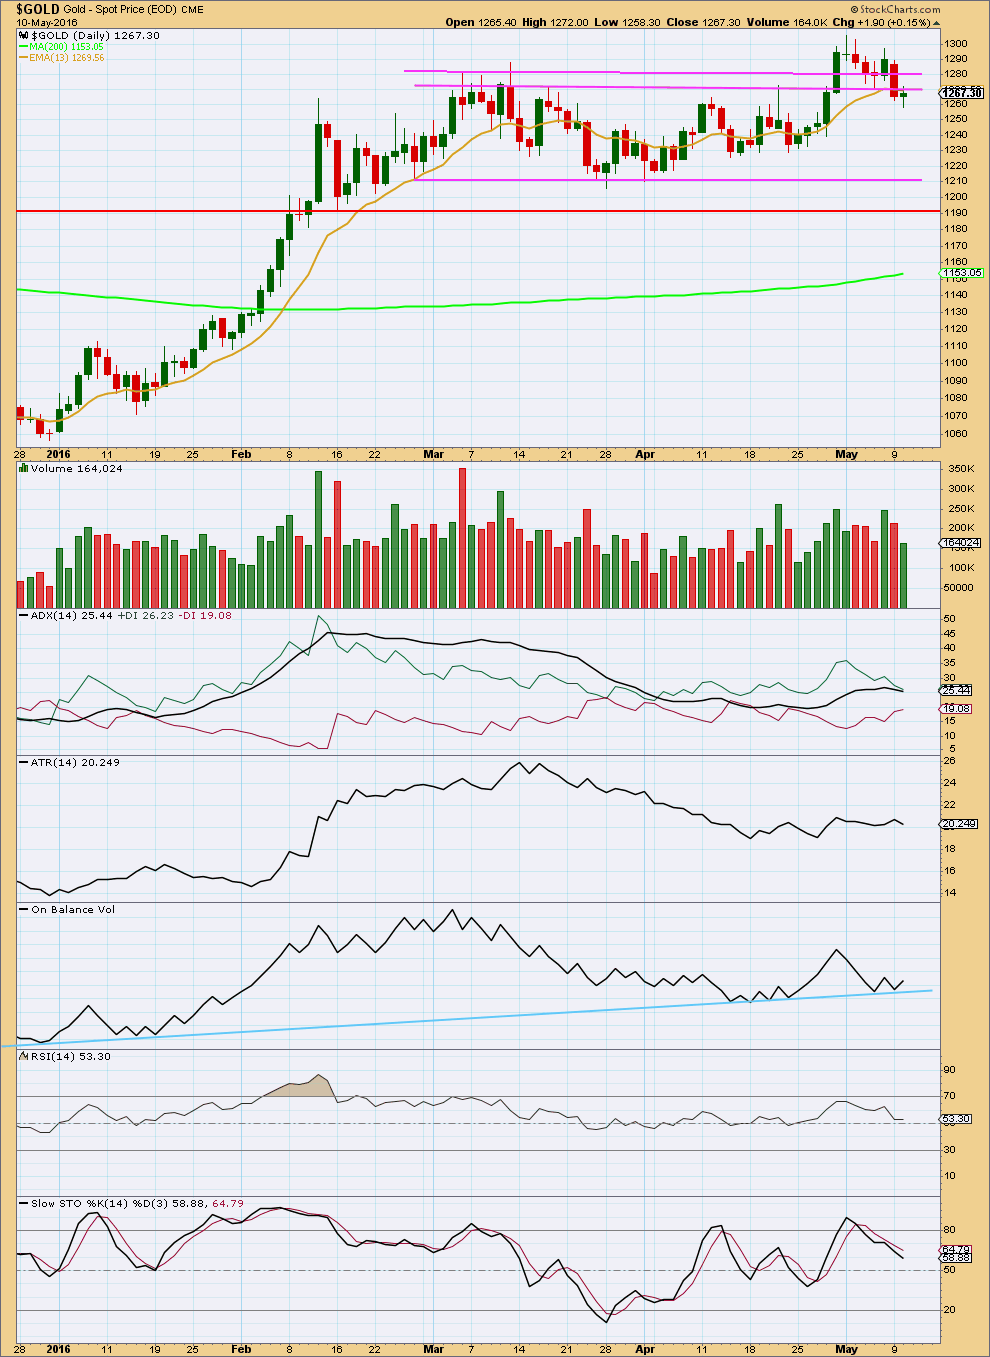
Click chart to enlarge. Chart courtesy of StockCharts.com.
A small green doji indicates indecision, a balance between bulls and bears. Overall, the bulls were slightly winning for the session.
A doji on light volume isn’t concerning for the bullish scenario, but the fact that the candlestick is green and volume is light is slightly concerning. This concern would be alleviated with one more upwards day on increasing volume.
So far as price rises volume rises (except for today). Volume declines as price falls. So far overall the volume profile remains bullish.
On Balance Volume is very clear today. It has found support and moved away from the blue trend line. This trend line has strong technical significance. It should serve to hold up price about here, and stop price falling much if at all further.
ADX is today declining indicating there is currently no clear trend. It has not indicated a trend change. When a trend returns at this stage it would remain upwards.
ATR is flat overall also indicating there is currently no clear trend. With the last six days price movement most likely corrective, this makes sense.
RSI is neutral. There is room for price to rise or fall.
Stochastics has returned from overbought. There is room for price to rise again.
This analysis is published @ 07:20 p.m. EST.
The question I’m trying to answer (for you all and for my own trading) is how low will each correction go?
Also, when will a correction begin?
I’m pretty confident that there is an upwards trend in the early stages, and that we shall see new highs for Gold within the next several days and sooner rather than later. So corrections are an opportunity to join the trend.
This current correction looks like a flat for minuette wave (ii). That has the best look overall. If it’s a regular flat then it may just end with sideways movement and may not get down low enough to touch the pink trend line. Target still about 1,270 as that is also the 0.382 Fibonacci ratio of minuette wave (i).
If my analysis is wrong in the next week or so it will be either targets not high enough, or corrections not turning up when I expect or being more shallow than I expect.
I’d still be expecting minute ii when it arrives to offer another nice entry point for the trend. But that is at least a week away I think.
Sounds great Lara thanks a lot.
THURSDAY, MAY 12
8:30 am EST US Weekly jobless claims May 7 Forecast 270,000 Previous 274,000
So far this is what I have for the rise today.
I just posted another idea below in response to Danna’s comment. That too is possible.
I’ll go with this idea though today because it has better proportions.
At 1,270 subminuette c would = subminuette a. I have subminuette a a leading contracting diagonal, and submineutte b an expanded flat (on the five min chart). It all fits neatly.
If my target is wrong it’s not low enough. If price moves lower then look for strong support at the pink trend line.
I’ll hold onto my buy and add each time price comes down for a larger correction. So far I’m leaving my stop at just below 1,237.97 to let the market have room to move.
Dollar snaps 6-day winning streak – May 11, 2016 3:13 p.m. ET
Investors focus on Friday’s retail-sales data
http://www.marketwatch.com/story/dollar-drops-sharply-versus-yen-as-investors-cash-in-on-recent-gains-2016-05-11
Wall St. Banks Bullish On Gold; Should Investors Worry? May 11, 2016
JP Morgan’s Solita Marcelli said that $1,400 is very well in the cards for gold this year.
http://www.kitco.com/news/video/show/Gold-Game-Film/1259/2016-05-11/Wall-St-Banks-Bullish-On-Gold-Should-Investors-Worry
Is it possible we had an extended 3rd wave on the move off of the lows and the correction wave from today’s high was a 4th wave….now in the 5th?
Yes. Entirely possible.
This is what it would look like.
Was the move from low of 1270.34 at 12:35 up to 1277.55 at 2:04 pm a second A-B-C or just A of A-B-C of the second set of 3 in the flat correction?
Does gold head down now for a final 5 wave or B then C then final 5 down.
This was one of those days where GDX and NUGT moved up in all pauses of gold on the way down. Miners were much more bullish than gold today.
11:25 am was buying time for GDX and NUGT today for a quick sell at 2:00 pm, even though gold bottomed at 12:35 pm.
B wave.
If correct, then C down will have increased momentum.
At the rate NUGT is holding up, it would most likely target the higher supports 95.89 or 91.09. The large drop during the A wave was probably panic selling or profit taking on a large scale.
So we may have 2 more opportunities to buy low. One maybe a quick intra day trade the other one for the much higher up bull move?
I sure hope we still have at least one more correction to the 1270 to 1260 area before much higher prices as I am getting some fairly strong bullish indicators signals now.
I doubt if an intraday trade is possible. This will be a C down. I am targeting the end of the wave when NUGT could drop to one of the supports. But I reckon there will not be enough time for the C wave to complete. Probably calling it a day soon.
It is also possible that B is not complete, and goes higher.
So now gold should stay below 1279.16 and the next drop is the final C wave down and time to buy and hold for the much higher move up toward 1,300 +.
Richard. I have the same idea.
Is gold still in the A wave of A-B-C down Lara mentioned as already at 1270.34 at 12:35 pm or did that just end the A wave?
Might the bottom of A and C only be about $5 difference?
Lara’s guess is close at 1,266 area?
I don’t want to miss buying GDX and NUGT by any miss count.
My best guess is that it is only micro 3 of subminuette A.
The other possibility is that ABC is a flat, 3-3-5. Then subminuette A ended at 1270.34. Let’s wait for more developments.
Price moved into wave 1 of subminuette A territory, so it is a flat. 1270.34 was subminuette A.
I’m really glad someone is keeping count, so many zig zags and GDX and NUGT seem to get little 30 minute bullish spurts when down trend stalls for short up waves.
For those who trade NUGT, I calculated the support levels at successively 95.89 (edit: now passed), 91.09, then a large gap to 77.35 (which is more likely). Gold price barely dropped $6 from the high, and NUGT has dropped almost $10.
GDX support is mainly 23.93 with a possible drop to 21.53 or 20.71.
Hope this helps.
It does help thanks. Tuesday day lows Gold 1256.91, GDX 23.34, NUGT 85.00.
I think the A wave down from 1279.16 the 8:25 high ended at 1272.18 at 11:28 am.
WOW… Alan suggests not to touch DUST but these figures give DUST a compelling case. Using $98.50 for NUGT(current trade price), the gap mentioned of $77.35 would equate to a 21.4% decline.
I guess I’m hoping that Lara’s mentioning of the word “may” retrace to the pink line doesn’t happen.
Hi Stephen.
I have formed some opinion of these ETFs, rightly or wrongly. There was a time last year when NUGT was in the low 10’s. Nobody wanted to touch it as its movement was abysmal. It was only when gold price rose that NUGT took off. DUST is now facing a similar fate. It would take off when the primary trend of gold is down. Since the general perception is that gold is shooting for the moon, nobody now would want DUST although it is dirt cheap.
DUST is dangerous as you’d be trading against the trend and tricky timing.
Thank you both… Alan and Richard! Your commentary is very valuable.
Richard. Good trade on GDX. I too, sold the NUGT I bought yesterday.
Minuette 1 completed at the high of 1279.16. Price movement from there would target 1265.41, the 0.618 retrace. We are now in subminuette a, dropping in micro 3. Price movement so far indicates that we are on track.
Second waves are normally quite fast, but so far this appears to be slow. If the movement drags on, I reckon it would be safe to call it a day. I would not think of touching DUST. The overall sentiment is still up.
Alan, awesome NUGT trade. Thanks for clarifying we are still in A of A-B-C down and 1,265.41 target. I won’t trade DUST either.
I might trade the B wave up intra day.
Do you think the C wave down to 1,265.41 area will be finished before the close?
Lara did mention, “When minuette wave (i) is a complete impulse, then the following three wave structure downwards for minuette wave (ii) may find support at the pink trend line, copied over from the daily chart. If price behaves like that in the next 24 hours, it may offer a good entry point for a long position on Gold.”
At 4 am Lara’s comment, “Maybe a pullback to find support at the pink trend line?
In the interests of not staying up too late I’ve entered a buy already at 1,266. “
Hi Richard. I think how fast minuette 2 can play out would depend on the B wave. B waves are usually drawn out. So I guess either we can get to the bottom very close to the end of day or more likely tomorrow.
Morning Tham!
Congrats on your trade!
I was still in at 103.45 from Friday, so Monday’s 92.80 looked meager to today @99.21. Its all okay. Ready for re-positioning after this 2nd wave.
See you later — btw, how’s your eyeballs doing?
Thanks dsprospering for your concern. My eyes are totally healed now.
As mentioned in a post above, I am looking at the vicinity of 77.35 for a NUGT entry. It should be a profitable trade.
S&P should also make a good trade. Currently it is dropping from its high yesterday. It could be a large third wave down or the B wave of the 2nd wave. I’m also monitoring that.
Good to hear.
Your post (yesterday?) about XAU 1260.66 helped me out- it was right on. Will be watching Nugt hrly now with EW count for re-entry. Thanks for your insight.
On http://www.pmbull.com at 30 minutes and 1 hour time frames there is a trend line that crosses at $1,266.
Thanks for the guidance, Richard! Nice trade on your part as well!!
Any wave counts?
I just sold my GDX at 25.27 at 9:49 am.
I think top of the 5 up was 1279.16 at 8:25 am.
Now waiting for what I think is the 3rd of a 3rd wave down to the 1266 area/range and look for a turnaround in that area.
Using a 5 minute MACD on Gold and GDX may help clarify that and some other super indicators like DMI, etc.
Guessing on my EW counts on the way down. Also checking http://www.pmbull.com multiple time frames like 1, 5, 15, 30 minutes and 1 hour along the way and any trend lines that show up.
Sold my nugt 99.21. Woke up just minutes too late to process the sale nearer to open. Will wait now on re-buy, near minute/minuette ii end? Minimnal profit, but profit none-the-less.
Gettin positioned on that train – stay vigilant considering that alt hrly not invalidated.
Richard, your nimbleness is my envy. 🙂
Profits are great congrats!
Morning high was 1279.16 at 8:25 am there may be another high but under 1279.16 soon, But then drop to 1265 area?
Gold climbs as highflying dollar stalls
May 11, 2016 8:52 a.m. ET
http://www.marketwatch.com/story/gold-climbs-as-highflying-dollar-stalls-2016-05-11
Like all of us, (even those that can’t handle roller coasters any more), I think we all want to buckle up and ride Alan’s roller coaster description (in reverse) of Minor 3.
Lara jumped in at $1,266 and opted for rest as opposed to waiting for the three down move. I hope she sleeps well and keeps the thought of sharks out of her dreams.
Based on the commentary, “confidence that Minor 2 is over is if a clear five up and a three down is viewed on the hourly chart.” Can someone advise if $1,279 was subminuette wave v? Also, can someone advise when the 3 down move is nearing completion (timing of expected completion (morning/ afternoon, etc…?))… expected to reach $1,260 again… pink trend line?
Naturally, this would help all of us know the best time to make our entry or add more. Most importantly, it would also help to confirm that Minor 2 is finally over!
Thanks!
LOL
I have surfed with dolphins and stingrays. But I’ve never seen a shark.
The stingrays bother me though. They ride just under the nose of my board in the shallows as I’m finishing my ride, makes me nervous to jump off. Don’t wanna get an electric shock!
IMHO Gold price is top heavy under 1269/73 set up for a pullback (possible short term down move) likely to test a break below 1260-57….
Maybe a pullback to find support at the pink trend line?
In the interests of not staying up too late I’ve entered a buy already at 1,266. Stop just below 1,237.97
The 10 Best Surfing Videos
for Lara’s waiting until 3 waves down for a Buy.
http://www.dailymotion.com/hub/x7pa_10-Best-Surfing-Videos#video=xpfjbv
I didn’t watch these yet, I just goggled World’s best surfing videos.
I think this may be one of the best waves I’ve ever seen.
Kelly Slater against John John Florence at Teahupo’o this year.
At 10:54 here.
The wave is huge, fat, steep and powerful crashing on a sharp shallow reef. IMO it’s pretty scary. Slater is deep in the barrel and within it he rides up and over the foam-ball. So skilful, and so graceful and casual in style.
Lara I watched the full 30 minutes between them and totally awesome the both of them, Kelly Slater and John John Florence, two of the world’s best.
IKR
I could watch that stuff for hours.
When my teenager finishes school I want to go and live in Tahiti for a few months. I’m pretty sure I don’t have the guts to surf Teahupo’o, I know I’d find the steepness of that wave a challenge, I’d end up muched on the reef 🙁 But I sure want to have a look see…