
Upwards movement was expected for Wednesday’s session, which is exactly what happened.
Summary: It is likely that a third wave upwards is in the very early stages. The target remains at 1,477. Risk remains at 1,237.97. The wave count is supported by volume analysis.
New updates to this analysis are in bold.
Last published weekly chart is here.
DAILY ELLIOTT WAVE COUNT
Click chart to enlarge.
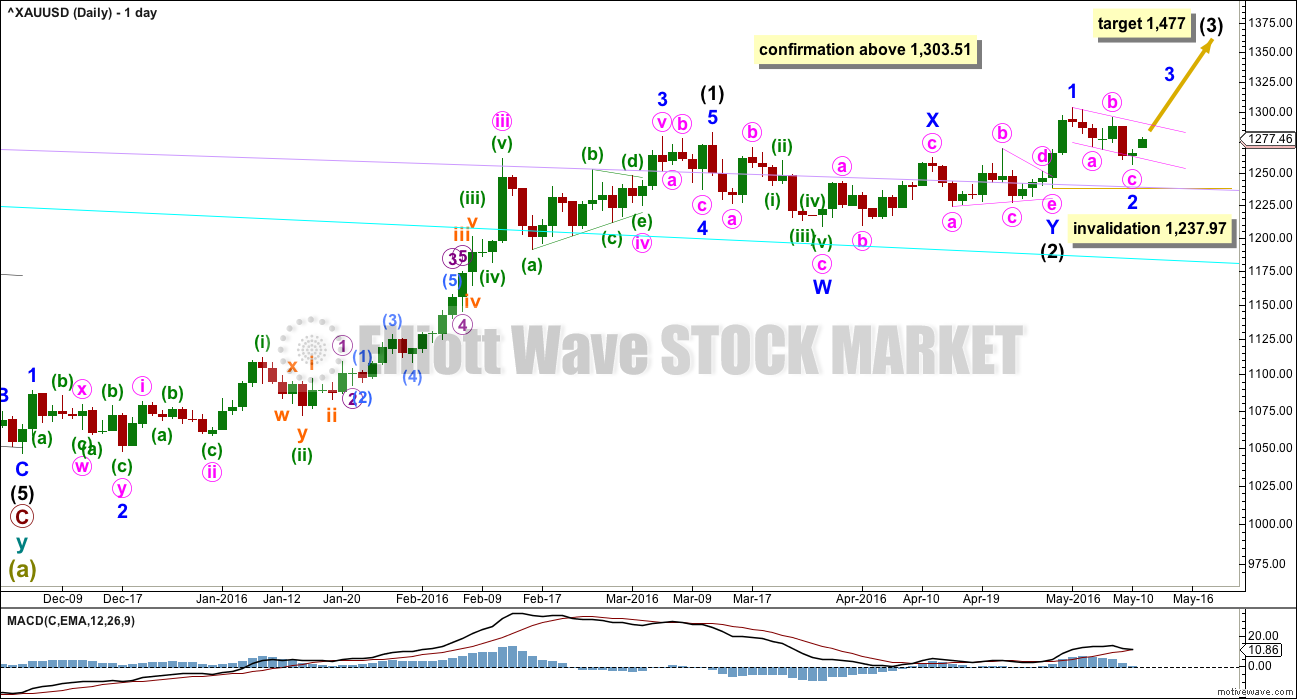
Intermediate wave (2) may be a double combination.
Minor wave W is a zigzag, the first structure in a double. The two structures in the double may be joined by a simple zigzag for minor wave X in the opposite direction.
Minor wave Y may be a running contracting triangle. The triangle is supported by MACD hovering at the zero line here on the daily chart.
Minor wave 2 may not move beyond the start of minor wave 1 below 1,237.97.
The next wave up for intermediate wave (3) should be swift and strong. It must move above the end of intermediate wave (1) at 1,282.68. It must move far enough above this point to allow room for intermediate wave (4) to unfold and remain above intermediate wave (1) price territory.
At 1,477 it would reach equality in length with intermediate wave (1). This target is reasonable because intermediate wave (2) was very shallow.
If intermediate wave (2) is over as labelled, then it may have totalled a Fibonacci 34 sessions.
Minor wave 2 has moved lower and is now 0.71 the depth of minor wave 1. Minor wave 1 lasted two days. Minor wave 2 now has lasted six days. If it is over here, it would have good proportion and look like a clear three wave structure on the daily and hourly charts.
HOURLY ELLIOTT WAVE COUNT
Click chart to enlarge.
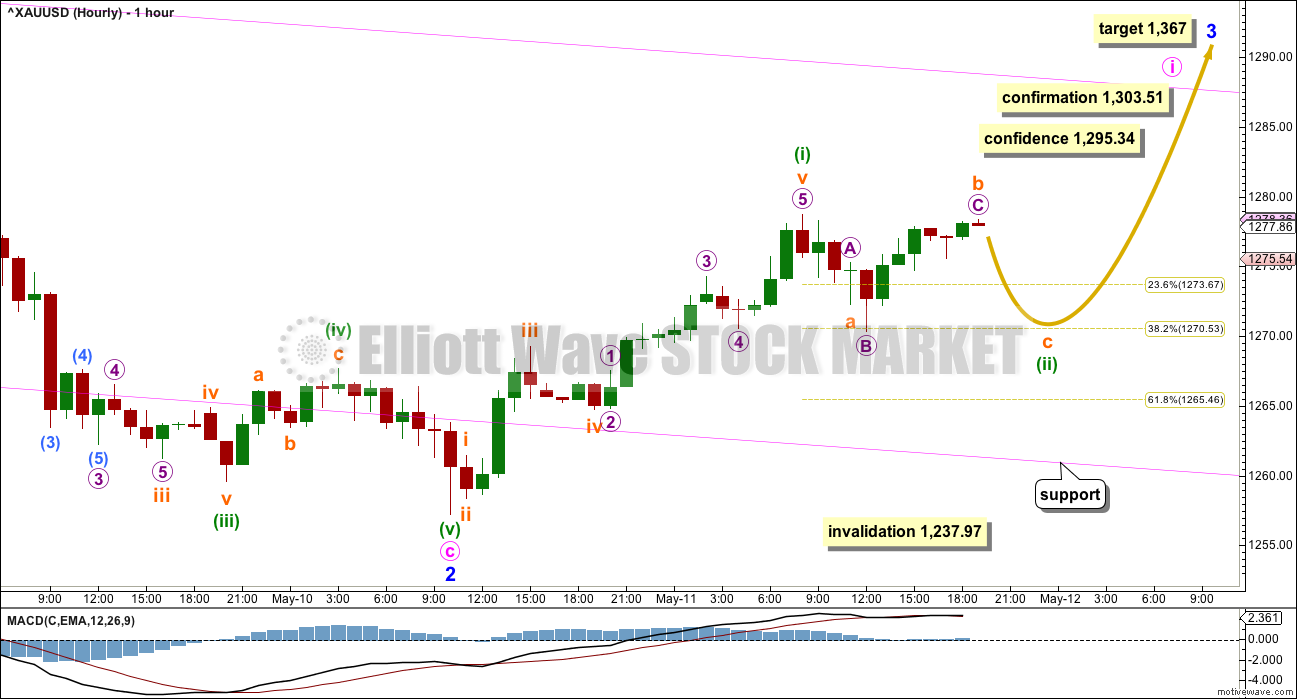
Minor wave 2 fits as a zigzag.
Within minute wave i so far, it looks now like the first five up is complete for minuette wave (i). On the five minute chart, subminuette wave iii has strongest momentum and all subdivisions within this impulse fit neatly.
At this stage, the sideways movement labelled minuette wave (ii) looks like a separate wave to minuette wave (i). This wave count has reasonable proportions.
Minuette wave (ii) must be a corrective structure. So far within it, subminuette wave a will fit as either a three or a five on the five minute chart, so minuette wave (ii) may be either a zigzag or a flat correction. Subminuette wave b has retraced 0.92 the length of subminuette wave a, so the minimum requirement of 0.9 for a flat is met.
Unfortunately, within a flat correction, subminuette wave b may make a new high above the end of subminuette wave a as in an expanded flat. A new high above 1,278.75 does not indicate that the correction for minuette wave (ii) is over. Expanded flats are very common structures, and that would see subminuette wave b a minimum 1.05 length of subminuette wave a at 1,279.11. There is no rule stating a maximum length for a B wave within a flat, but there is an Elliott wave convention that states when the potential B wave is twice the length of the potential A wave a flat should be discarded due to a very low probability. That price point would be at 1,285.26. A new high above 1,285.26 would indicate that minuette wave (ii) was quick, shallow and complete.
It is an outside possibility that minuette wave (ii) is over already as a quick shallow zigzag complete at the low for this last session. But the probability is low; the proportion does not look right and it should last longer.
Subminuette wave c would be likely to make at least a slight new low below the end of subminuette wave a at 1,272.24 to avoid a truncation.
Minuette wave (ii) may end at either the 0.382 or 0.618 Fibonacci ratios.
If subminuette wave c moves deeper than the 0.618 Fibonacci ratio, then it should find strong support at the lower pink trend line.
The invalidation point and risk must remain at 1,237.97 while there is no confirmation of a trend change.
Confidence may be had in a trend change with each of these conditions being met, in order:
1. A five up followed by a three down which does not make a new low. If the wave count unfolds as expected in the next 24 hours, then this first condition may be met.
2. A breach of the upper edge of the pink channel.
3. A new high above 1,295.34.
4. A new high above 1,303.51. This will be final confirmation.
Depending upon risk appetite, members may choose to wait for one or more of these conditions to be met before entering long. Manage risk carefully. The risk of a loss on a long position here must be accepted. The alternate wave count does remain viable, although unlikely. Do not invest more than 3-5% of equity on any one trade, and always use a stop loss to protect your account.
At 1,367 minor wave 3 would reach 1.618 the length of minor wave 1. If this target is wrong, it may be too low. The next possible target would be at 2.618 the length of minor wave 1 at 1,433.
Minor wave 3 may only subdivide as an impulse. Within the impulse, minute wave i may begin about here. When it arrives minute wave ii may also be deep and may also be time consuming.
It would not be until the middle that acceleration to the upside may be expected to be clear for minor wave 3. The fourth wave corrections within it may be quick and shallow, and the fifth waves to end minor wave 3 and then the final fifth wave up of minor wave 5 also may be expected to be very strong movements, completing blowoff tops for Gold.
ALTERNATE DAILY ELLIOTT WAVE COUNT
Click chart to enlarge.
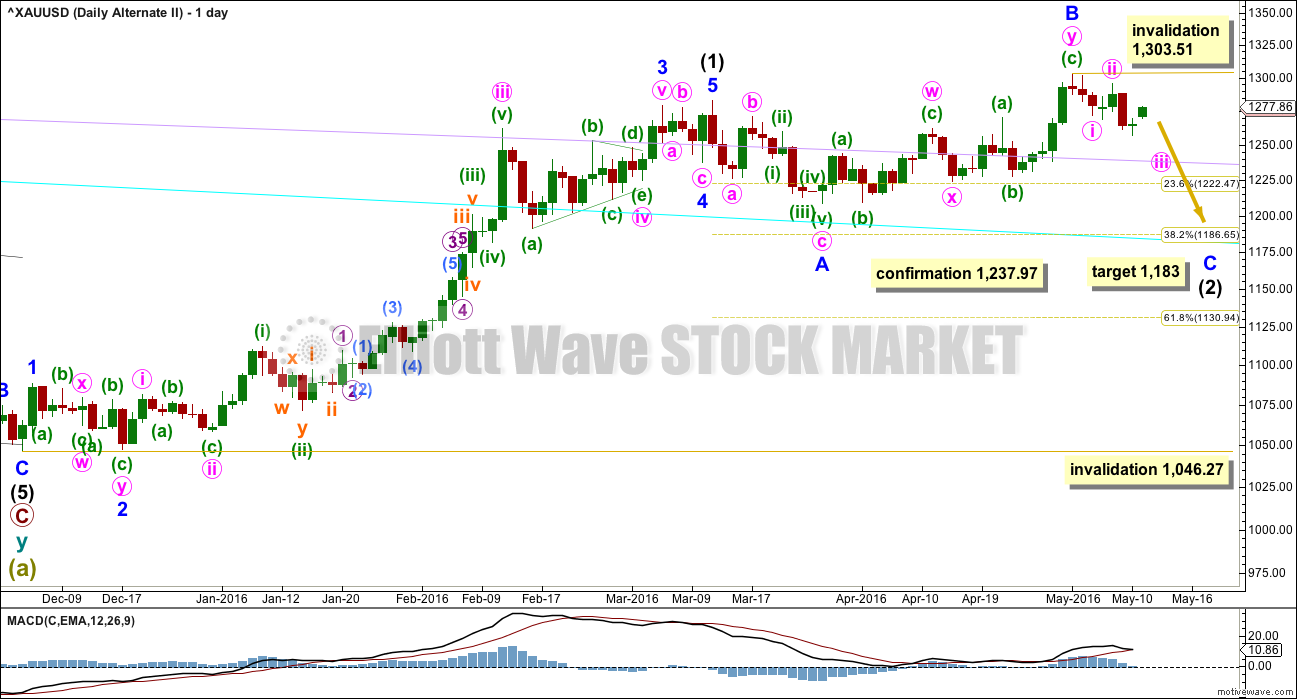
It is still possible that intermediate wave (2) is not over.
Normally, the first large second wave correction within a new trend is very deep, often deeper than the 0.618 Fibonacci ratio. The main wave count sees intermediate wave (2) as very shallow at only 0.19 of intermediate wave (1). This is unusual. And so this alternate must be considered.
If any members have long positions on Gold already it is essential that stops are used in case this alternate unfolds.
Intermediate wave (2) may be an expanded flat correction. Minor wave A is a three, minor wave B is a three and a 1.28 length of minor wave A. This is within the normal range of 1 to 1.38.
At 1,183 minor wave C would reach 1.618 the length of minor wave A. This would be the most likely target. If price keeps falling through this first target, then the second target would be at 1,108 where minor wave C would reach 2.618 the length of minor wave A.
Intermediate wave (2) may not move beyond the start of intermediate wave (1) below 1,046.27.
ALTERNATE HOURLY ELLIOTT WAVE COUNT
Click chart to enlarge.
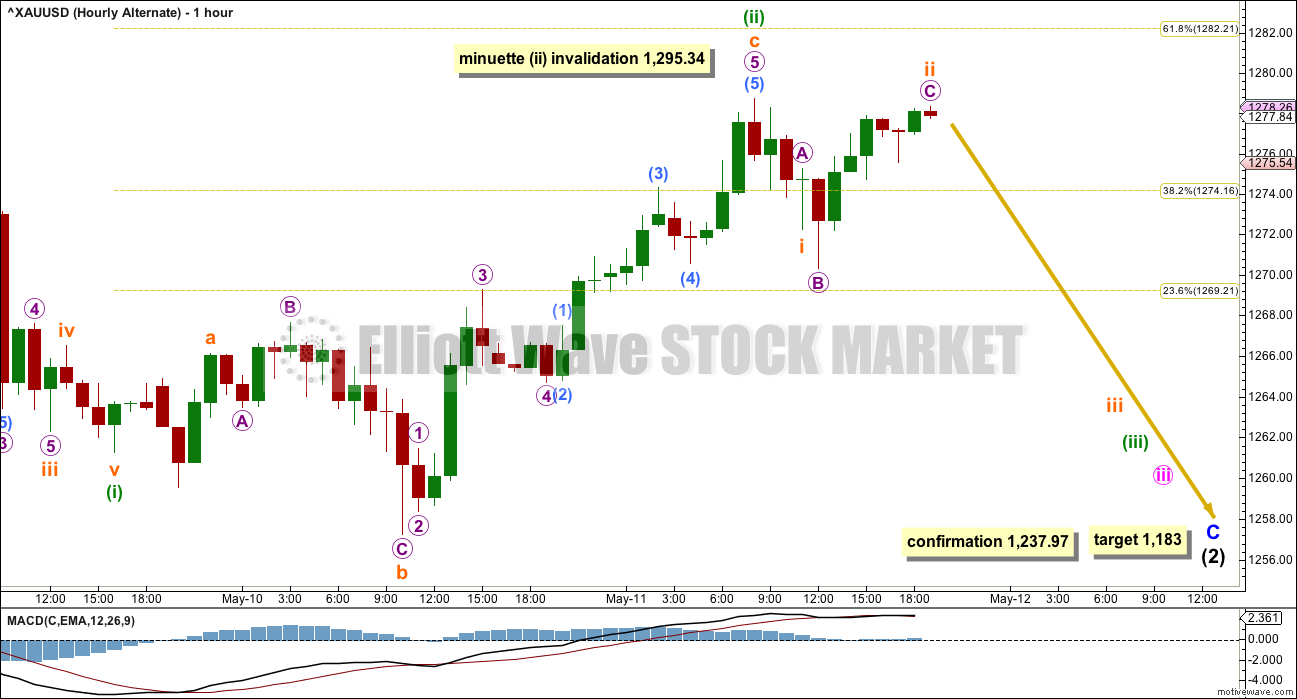
Minor wave C must subdivide as a five wave structure. This may be either an impulse (as labelled) or an ending diagonal (not charted but considered in this analysis).
If minor wave C is unfolding as the more common impulse, then within it there would now be overlapping first and second waves for minute waves i and ii, then minuette waves (i) and (ii). Now today subminuette waves i and ii may be complete. With three overlapping first and second waves complete, an increase in downwards momentum should be expected if an impulse is unfolding.
Minuette wave (ii) may not move beyond the start of minuette wave (i) above 1,295.34.
A new high above 1,295.34 would invalidate an impulse unfolding downwards for minor wave C.
At that stage, the other less common structure of an ending diagonal would need to be considered for this alternate.
All subwaves must subdivide as zigzags within an ending diagonal. To the low of 10th May, downwards movement will subdivide as a 5-3-5 structure, so it may be a complete zigzag (as per labelling on the main daily and hourly wave count). That may be the end of a zigzag for minute wave i, the first wave down of an ending diagonal.
The normal depth of second and fourth waves within diagonals is from 0.66 to 0.81 the prior wave. Minute wave ii of a diagonal would have a normal range of 1,288 to 1,295.
If a diagonal is indicated, then the invalidation point is at where it is placed on the daily chart. Minute ii of a diagonal may not move beyond the start of minute wave i at 1,303.51.
Only a new high above 1,303.51 would fully invalidate this alternate idea at this stage.
TECHNICAL ANALYSIS
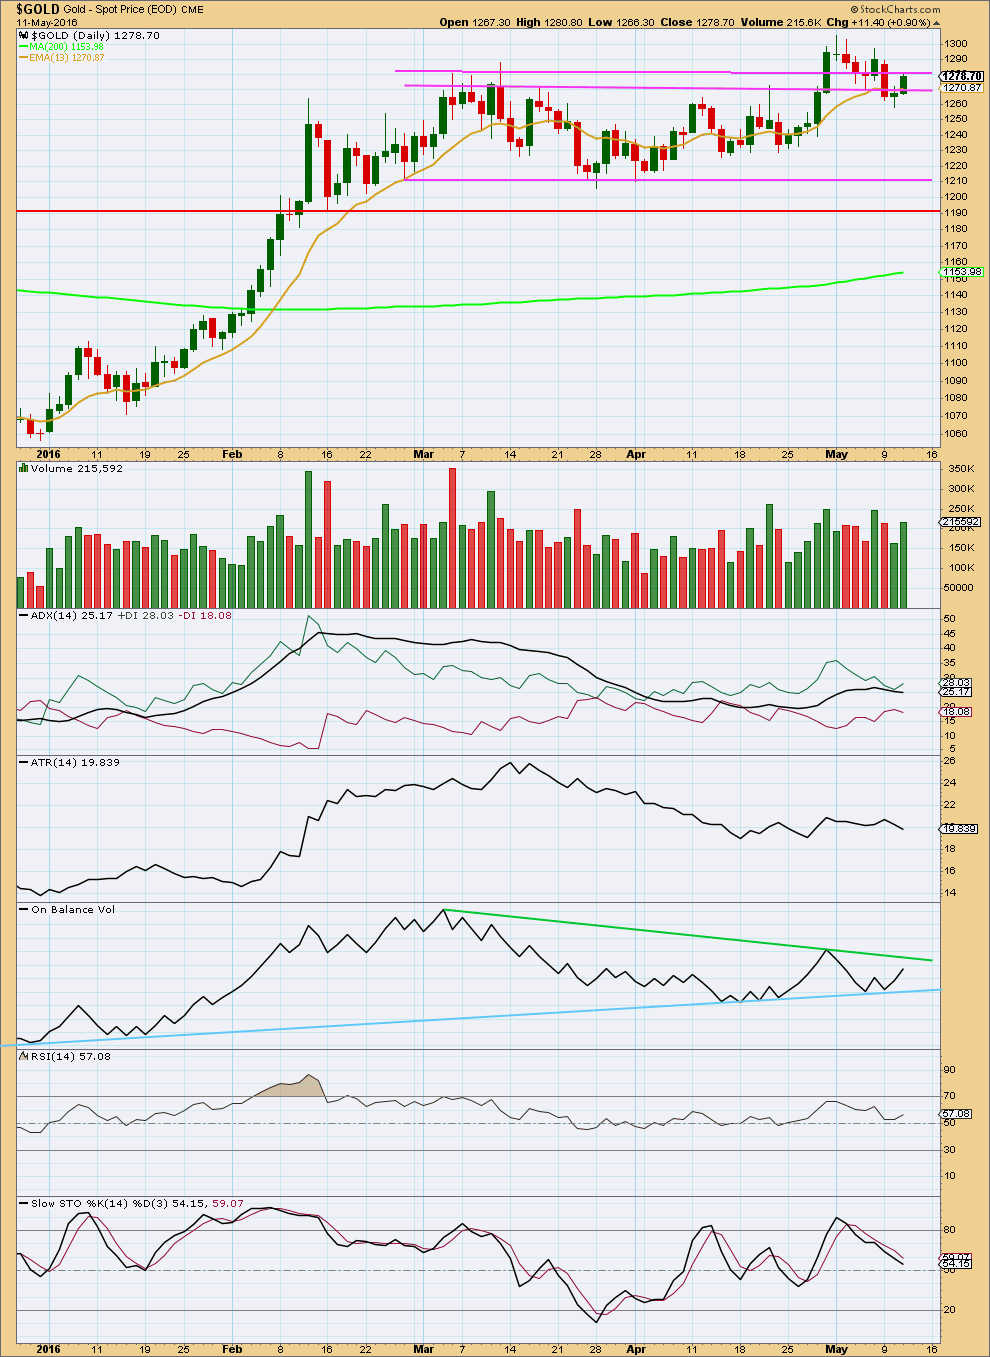
Click chart to enlarge. Chart courtesy of StockCharts.com.
There is now a Morning Doji Star candlestick pattern complete with today’s green candlestick. This comes after a small decline. This is not the strongest reversal pattern so one more day of upwards movement would add confidence to the reversal implications of it. There is stronger volume on the third candlestick than the first and the body of the third candlestick closes well into the body of the first candlestick. This adds some strength to the pattern. There is an overlap between the body of the first candlestick and the body of the second candlestick which detracts a little from the strength of the pattern.
Today saw reasonable upwards movement on clearly stronger volume. The rise in price is well supported by volume, so it supports the main Elliott wave count.
Price is finding a little resistance about the upper horizontal line at 1,280. A downwards reaction from here may find some support now about the next line at 1,270.
ADX today is slightly declining, indicating the market is not currently trending. It has not indicated a trend change. If a trend returns, it would still be up.
ATR is also declining agreeing with ADX that this market is not currently trending. With a counter trend movement of six days to the last low, and both of these indicators based on 14 day averages, this makes sense at this stage. They are both lagging indicators.
On Balance Volume gave a strong bullish signal when it moved up and away from the blue trend line. That trend line is reasonably shallow, long held and repeatedly tested. It offers strong technical support. A new line is added today to OBV in green. This line may offer some resistance, but it does not have good technical strength. When OBV comes up to that line, it may initiate a small correction in price (but it does not have to). If OBV breaks above the green line, it would offer a weak bullish signal.
RSI is close to neutral. There is room for price to rise or fall. Stochastics is close to neutral also. There is room for price to rise or fall.
Once the trend is established, then the 13 day moving average may show where corrections against the trend find support. This may assist to find entry points to join the trend.
This analysis is published @ 08:14 p.m. EST.
Lara,
Is is possible that Minor 2 is not over?
Could it be that the price action since the low at $1256 is Wave X, and that the decline today from $1280 is the beginning of Wave Y?
Low of 1261.74 at 4:45 pm. Main hourly count so far so good as the pink support trend line held and “no new low” as not lower than 1,256.91 at 10:29 am on May 10th.
“If subminuette wave c moves deeper than the 0.618 Fibonacci ratio, then it should find strong support at the lower pink trend line. A five up followed by a three down which does not make a new low. If the wave count unfolds as expected in the next 24 hours, then this first condition may be met.”
Gold making new lows…i was really hoping this was gonna turn the corner today. Appears to be tracking lower. Hopefully 1260 holds
Yes I saw that shocking drop down to the day low of 1261.74 at 4:45 pm and a $4.61 drop the last minute, ouch. That’s at the pink support line area. Glad I sold my NUGT, felt things were too bearish for an over nighter and NUGT after hours price now is $4 less that what I sold it for at 3:18 pm. GDX after hours is now down again to the day low of $24.42.
Is it safe to buy some more GDX now as only 10 cents above the day low?
Sold my NUGT at 3:18 pm for a $3.14 a share profit.
Seeing multiple indicators turning negative so took my profit for today.
I did buy and keep some GDX.
Will see how today closes and Lara’s analysis before buying NUGT again.
Only like to do intra day trades on NUGT.
Well this is a frustrating sideways day. So far on the daily chart there is a small doji.
Again, on the daily chart take a look at the first movements off the low in December 2015. See how the first waves up are relatively quick, and the second wave corrections (the first three of them; minor, minute and minuette) are time consuming and deep.
When Gold begins its impulses it does it slowly.
Acceleration comes as the middle is approached. Then explodes in the fifth waves.
Short term outlook: nothing really changes. My concern today is whether or not minuette (ii) is complete. So far it has reached down to the 0.618 Fibonacci ratio. But the concern is the next correction is also so very deep.
Initially my labelling would see subminuette waves i and ii also complete. But I am also needing to consider, what if minuette (ii) isn’t over? what if it is going to continue sideways as a double combination?
Strong volume for the two upwards hours during this session for subminuette i adds a little confidence to this labelling.
Don’t know why gold only moved up $5.40 in over 3 hours up from 1266.35 at 11:11 am
Gold went up $15.32 in 1 hour and 25 minutes from 1265.27 at 8:31 am to 1280.99 at 9:55 am.
Either a very short first wave, or possibly minuette (ii) isn’t over.
The depth of the following correction has me a bit concerned that minuette (ii) may not be over.
Fired bullish starting at 12:36 pm for GDX and 12:45 pm for NUGT. Good news!
Alan is gold retrace down movement complete now at the 1266.35 at 11:11 am?
Or does gold have to do any B and C wave still or can gold move back up toward 1280 area?
Richard. I think it is complete.
That was a pretty deep correction, almost reaching this morning’s low.
Cheers to our good trades.
Yes cheers to our well time trades Alan.
Bought NUGT at 11:14 am
Bought GDX at 10:58 am
Retrace dropped down to 1,266.35 at 11:11 am at this point.
Morning low was 1,265.67 at 8:31 am
BUYING TIME ANY MINUTE NOW!
Minuette (ii) ended at 8:31 am low of 1,265.67 and now waiting for .618 drop from 1280.99 high at 9:55 am, which may be 1271.52 Retrace Target area?
1,280.99 9:55 am high
– 1,265.67 8:31 am low
= 15.32
x .618
=9.47
-1,280.99
= 1,271.52 .618 Retrace Target area and gold already dropping now.
It may be an A-B-C down since a correction.
Any comments.
What do you think is expected after the retrace?
Likely gold heads up.
Hi Stephen.
The low at 1266.35 most likely completed subminuette 2 of minuette 3 of minute 1.
It should be up from here towards Lara’s target of 1367 (or possibly 1429) for Minor 3. Then 1477 Intermediate 3.
Sounds wonderful.
Any chance gold may drop a little from 1278 at 9:28 am?
Missed buying miners at correction bottom at 8:31 am.
I would expect that the reversal would target around 1281 followed by a wave 2 drop. First drops are usually quite deep, probably 0.618 retrace.
Apparently now in the fourth wave of the first up. Alternatively the first wave is already over.
Good luck.
Great thanks Alan, if it is over already then
1278.23 at 9:28 am possible high
– 1265.67 at 8:31 am low
= 12.56
x .618
= 7.76
-1278.23
= 1,270.47 possible retrace target
Otherwise if gold continues up to around 1,281 then .618 down from there.
Hopefully it is today and gold and miners drop fast, steady and deep down to a great buying opportunity before the close.
Any comments?
Richard. That is correct.
I too am waiting. I don’t have access to pre-market trades. So no other choice.
I’m doing my best to follow along, but must admit that I’m a little confused. I was thinking that this morning’s bounce off of $1,265 was that last time it would retrace.
Based on the road map from today’s commentary, it appears that gold will retrace again to the $1,270 level at some point today.
Lara mentioned in her note below: “So now we have a complete five up for minuette (i), and a complete three down for minuette (ii).” This was when price reached $1,270. It subsequently reached $1,265 this morning at around 8:30. Ultimately, I’m just trying to get an idea of forthcoming action.
Thanks!
Everything retraces
Read Lara’s note bwlow she thought it ended , however it went lower to 831 an low 1271.52.
Now a .618 retarace so time to buy any minute now.
Sorry the 8:31 low today was 1265.67
And what u think on oil lara…
Is this the 5th wave or just a bounce before fall..??
At this stage I’m sorry, Oil isn’t clear.
The move down from the last high looks corrective, and it found support at the lower edge of the channel.
If Oil makes a new hight then expect it to keep going up. There has been no confirmation of a trend change at this stage.
Lara this analysis mentions “1. A five up followed by a three down which does not make a new low.”
To clarify what was left to complete as of your analysis when gold was at 1,278.
I guess from where ever subminuette wave b ends up, gold just needs a 3 wave down on the hourly chart to complete minuette wave (ii).
Of course the other guidelines apply.
We have that now I think Richard.
After these charts were published Gold has moved lower, as I make this comment it has reached down to 1,270.59.
So now we have a complete five up for minuette (i), and a complete three down for minuette (ii).
Gold dropped down to a low of 1265.67 at 8:31 am today.
That appears to be the end of minuette wave (ii) correction.
Now it is already back up to 1275.69 at 9:18 am and miners had dropped and are back up as well.
So the correction is over while we slept!
Any chance of the correction dropping down a bit down from 1276 at 9:18 for another chance to buy some miners?
Lara, what might be the probabilities of the main and the alternate counts?
I’m curious of the risk factor considering that you recently added the hourly alternate count to the analysis.
Fair enough.
I would give the alternate little weight. Maybe as low as 10%?
It’s not the count I’m trading.
This is based mostly on classic TA, and a heavy weighting to what volume is doing. Volume is bullish.
It still looks like Gold had a classic breakout from a consolidation period on 29th April, followed by a slow corrective movement down to retest the upper range of the consolidation which is now providing support. A typical throwback.
That is my favourite trade set up to join a trend: consolidation – breakout – back test, enter the trend direction on the back test.
As we know there is always risk. The alternate is published predominantly to illustrate the risk to the main wave count at this stage. Which is why risk can be pinpointed to 1,237.97.