
The main hourly Elliott wave count expected upwards movement which is overall how Friday unfolded.
Summary: The trend at intermediate degree still is most likely up. Risk remains at 1,237.97. The target remains at 1,477. It is possible that price may move lower on Monday to 1,255 to complete a correction.
New updates to this analysis are in bold.
Last published weekly chart is here.
DAILY ELLIOTT WAVE COUNT
Click chart to enlarge.
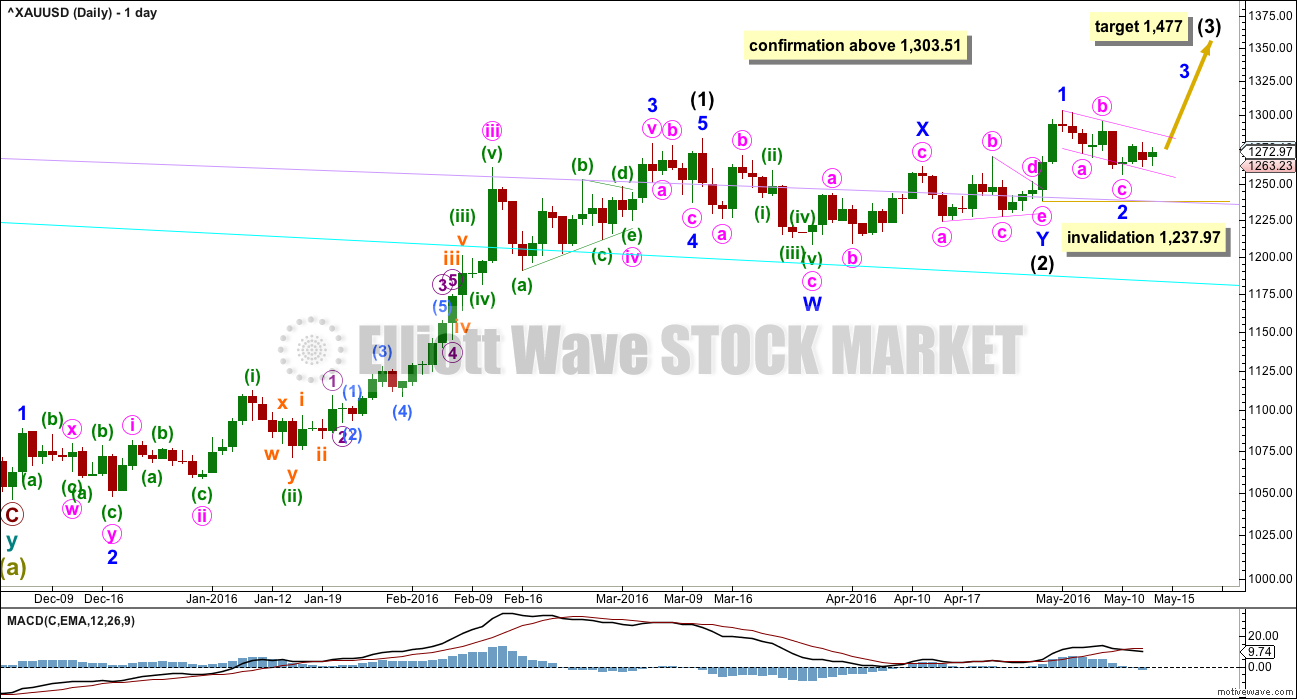
Intermediate wave (2) may be a double combination.
Minor wave W is a zigzag, the first structure in a double. The two structures in the double may be joined by a simple zigzag for minor wave X in the opposite direction.
Minor wave Y may be a running contracting triangle. The triangle is supported by MACD hovering at the zero line here on the daily chart.
Minor wave 2 may not move beyond the start of minor wave 1 below 1,237.97.
The next wave up for intermediate wave (3) should be swift and strong. It must move above the end of intermediate wave (1) at 1,282.68. It must move far enough above this point to allow room for intermediate wave (4) to unfold and remain above intermediate wave (1) price territory.
At 1,477 it would reach equality in length with intermediate wave (1). This target is reasonable because intermediate wave (2) was very shallow.
If intermediate wave (2) is over as labelled, then it may have totalled a Fibonacci 34 sessions.
Minor wave 2 has moved lower and is now 0.71 the depth of minor wave 1. Minor wave 1 lasted two days. Minor wave 2 now has lasted six days. If it is over here, it would have good proportion and look like a clear three wave structure on the daily and hourly charts.
If minor wave 2 continues lower for another one or two days, as per the first hourly alternate wave count, it would still look reasonable in proportion to minor wave 1.
Gold often begins new trends slowly. There is a good example on this daily chart: the beginning of intermediate wave (1) saw brief impulses and time consuming deep second wave corrections at minor, minute and minuette wave degrees.
Golds impulses, particularly its third waves, normally accelerate at the middle and explode in a blowoff at the end of the fifth wave.
All hourly charts today will show all movement from the low labelled minute wave a on 4th May.
HOURLY ELLIOTT WAVE COUNT
Click chart to enlarge.
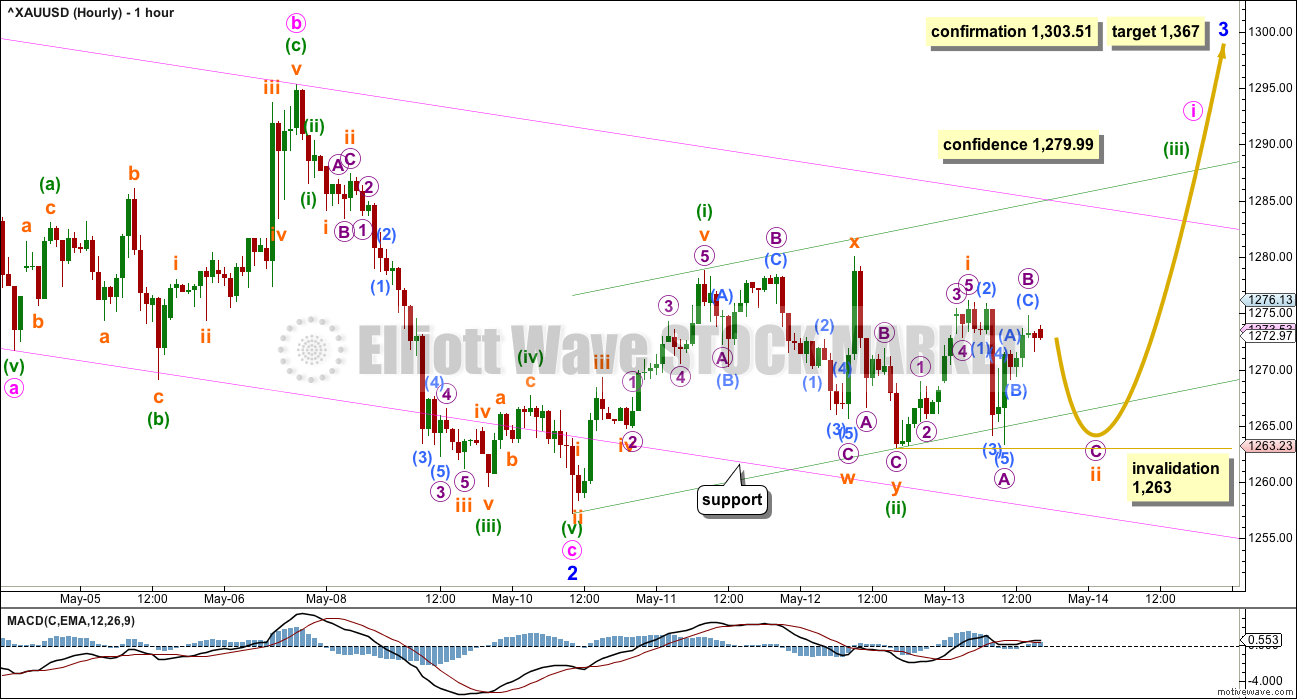
Minor wave 2 fits as a zigzag.
Minor wave 3 may only subdivide as an impulse. Minute wave i is incomplete.
Within minute wave i, a first and second wave may be complete for minuette waves (i) and (ii).
Within minuette wave (iii), a first wave may be complete for subminuette wave i.
Subminuette wave ii looks incomplete because the downwards wave labelled micro wave A subdivides as a five, not a three. This cannot be subminuette wave ii in its entirety if it is a five.
Subminuette wave ii may not move beyond the start of submineutte wave i below 1,263.
A green base channel is added about minuette waves (i) and (ii). Lower degree corrections along the way up should find support at the lower green trend line.
At 1,367 minor wave 3 would reach 1.618 the length of minor wave 1. If this target is wrong, it may be too low. The next possible target would be at 2.618 the length of minor wave 1 at 1,433.
Confidence may be had in a trend change with each of these conditions being met, in order:
1. A five up followed by a three down which does not make a new low. This first condition is now met.
2. A breach of the upper edge of the pink channel.
3. A new high above 1,279.99 would invalidate the first alternate below.
4. A new high above 1,303.51. This will be final confirmation.
It would not be until the middle that acceleration to the upside may be expected to be clear for minor wave 3. The fourth wave corrections within it may be quick and shallow, and the fifth waves to end minor wave 3 and then the final fifth wave up of minor wave 5 also may be expected to be very strong movements, completing blowoff tops for Gold.
FIRST ALTERNATE HOURLY ELLIOTT WAVE COUNT
Click chart to enlarge.
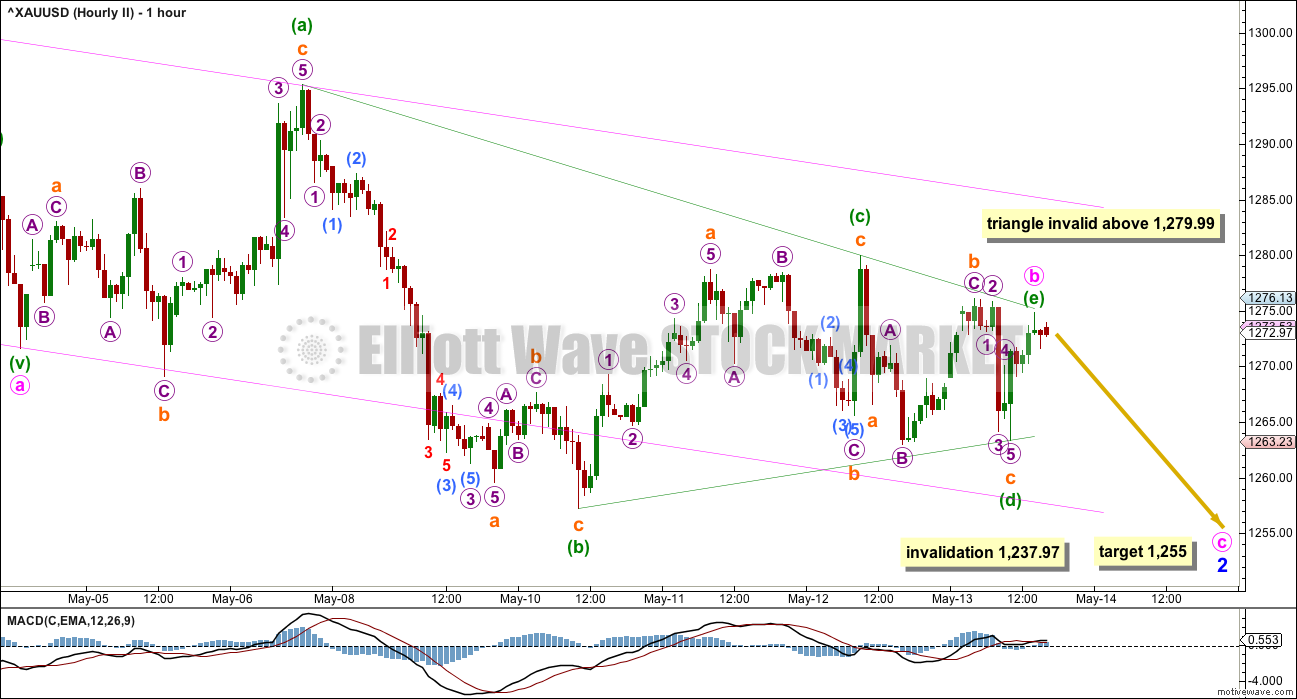
What if minor wave 2 is not over?
Sideways movement of the last three sessions is not convincing as another impulse up so far. Two inside days on declining range in a row was not expected market behaviour.
Minor wave 2 may be continuing further as a more time consuming correction, still subdividing as a zigzag. The last three days may be a running contracting triangle for minute wave b which may now be complete.
Direction of price entry into the triangle is down, so direction of price exit from the triangle should be down.
If minute wave b is complete at Friday’s high, then at 1,255 minute wave c would reach 0.618 the length of minute wave a. If minute wave b moves any higher when markets open for the new week, then this target must also move correspondingly higher.
Within the triangle, minuette wave (e) may not move beyond the end of minuette wave (c) above 1,279.99.
This wave count illustrates why risk remains at 1,237.97. If minor wave 2 continues, then it may not move beyond the start of minor wave 1.
This alternate wave count has a reasonable probability. It nicely explains price behaviour for the last three sessions.
ALTERNATE DAILY ELLIOTT WAVE COUNT
Click chart to enlarge.
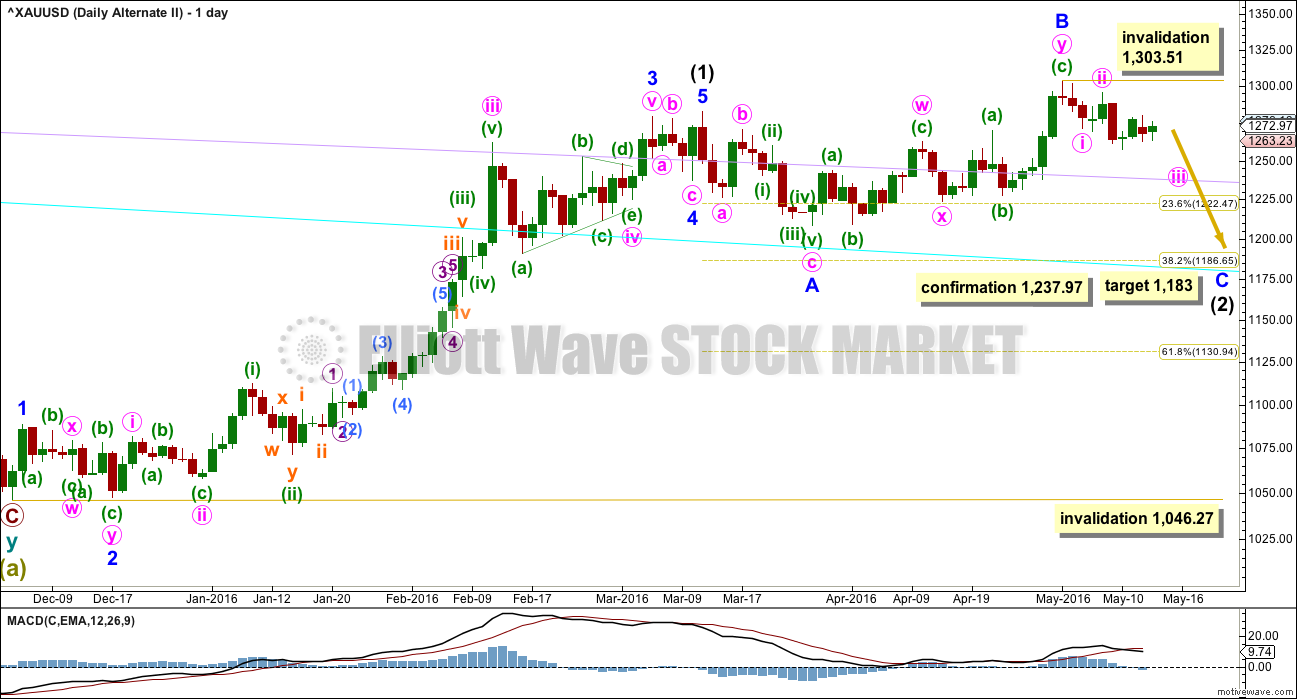
It is still possible that intermediate wave (2) is not over. It is my judgement that this alternate is unlikely. If asked to put a number on it, I would give it about a 10% probability. This judgement is based upon classic technical analysis, not Elliott wave.
Normally, the first large second wave correction within a new trend is very deep, often deeper than the 0.618 Fibonacci ratio. The main wave count sees intermediate wave (2) as very shallow at only 0.19 of intermediate wave (1). This is unusual. And so this alternate must be considered.
If any members have long positions on Gold already it is essential that stops are used in case this alternate unfolds.
Intermediate wave (2) may be an expanded flat correction. Minor wave A is a three, minor wave B is a three and a 1.28 length of minor wave A. This is within the normal range of 1 to 1.38.
At 1,183 minor wave C would reach 1.618 the length of minor wave A. This would be the most likely target. If price keeps falling through this first target, then the second target would be at 1,108 where minor wave C would reach 2.618 the length of minor wave A.
Intermediate wave (2) may not move beyond the start of intermediate wave (1) below 1,046.27.
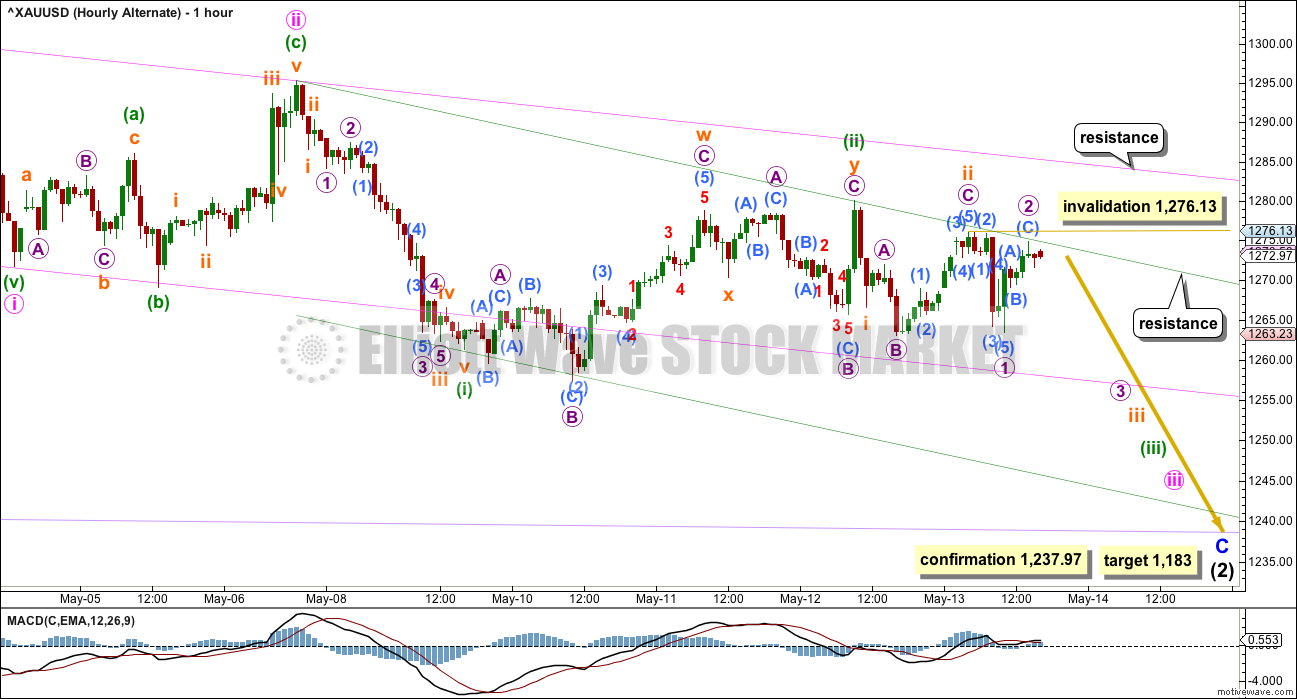
ALTERNATE HOURLY ELLIOTT WAVE COUNT
Click chart to enlarge.
The main purpose in publishing an hourly chart for this alternate is to determine what price points need to be passed to reduce the probability of this alternate and increase the probability of the main wave count.
A secondary purpose is to remain open to considering what this alternate looks like at a lower time frame. Alternates should always be considered; what if the main wave count is wrong? Alternates provide a road map for what should happen next if the main wave count is wrong.
Minor wave C must subdivide as a five wave structure. This may be either an impulse (as labelled) or an ending diagonal (not charted but considered in this analysis).
If minor wave C is unfolding as the more common impulse, then within it there would now be overlapping first and second waves for minute waves i and ii, minuette waves (i) and (ii), then subminuette waves i and ii.
A new high above 1,276.13 would invalidate an impulse unfolding downwards for minor wave C.
At that stage, the other less common structure of an ending diagonal would need to be considered for this alternate.
All subwaves must subdivide as zigzags within an ending diagonal. To the low of 10th May, downwards movement will subdivide as a 5-3-5 structure, so it may be a complete zigzag (as per labelling on the main daily and hourly wave count). That may be the end of a zigzag for minute wave i, the first wave down of an ending diagonal.
The normal depth of second and fourth waves within diagonals is from 0.66 to 0.81 the prior wave. Minute wave ii of a diagonal would have a normal range of 1,288 to 1,295.
If a diagonal is indicated, then the invalidation point is at where it is placed on the daily chart. Minute ii of a diagonal may not move beyond the start of minute wave i at 1,303.51.
Only a new high above 1,303.51 would fully invalidate this alternate idea at this stage.
TECHNICAL ANALYSIS
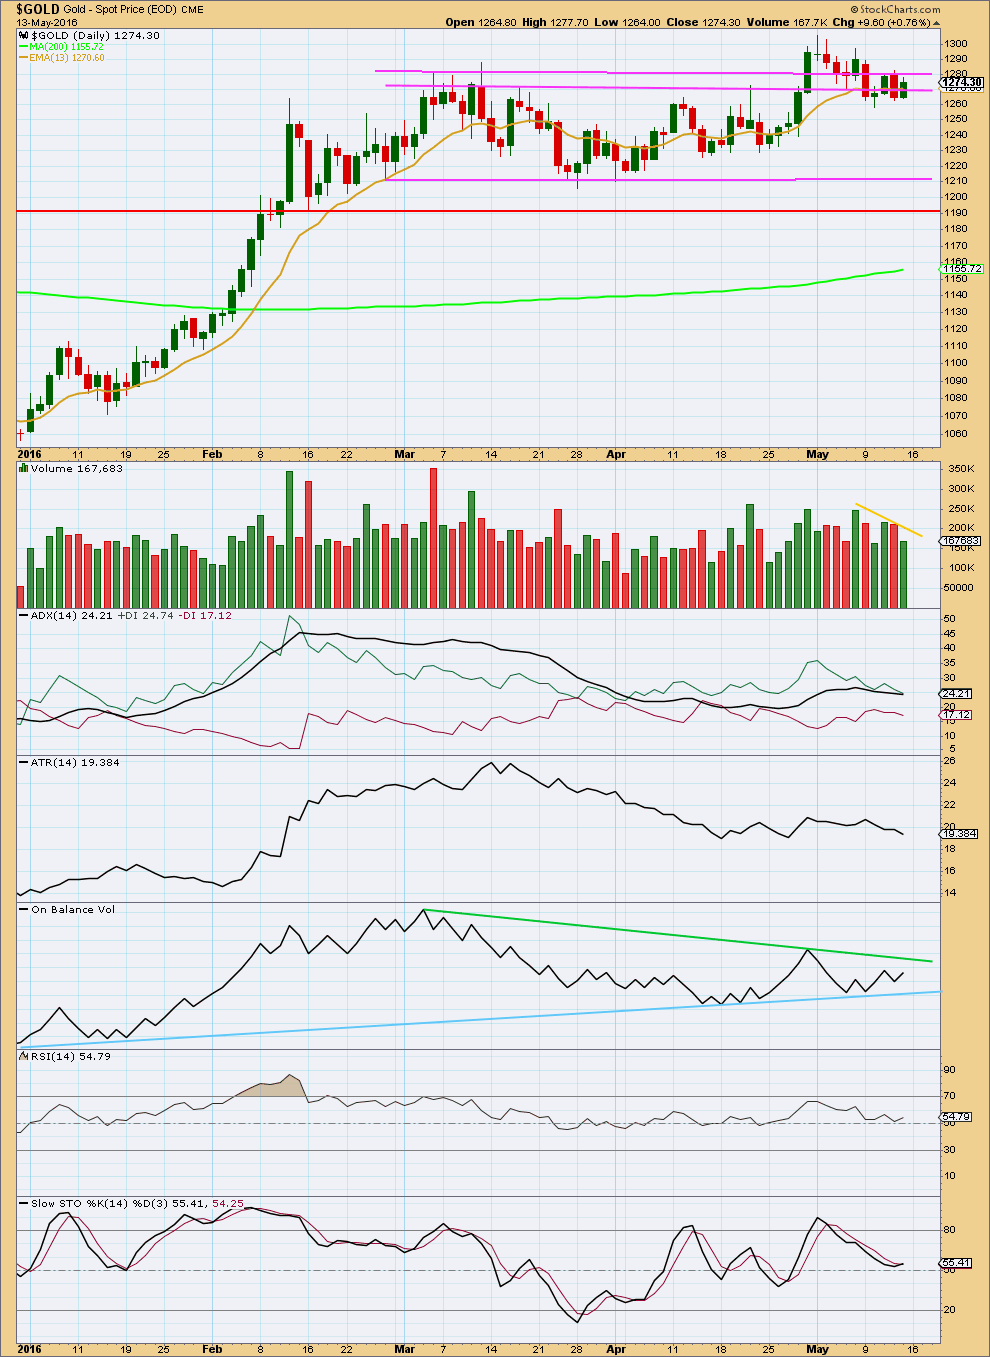
Click chart to enlarge. Chart courtesy of StockCharts.com.
Friday’s upwards day completed another small range day this time on light volume. The rise in price for Friday was not supported by volume, so it is suspicious. This favours the first alternate Elliott wave count; this would be expected for a triangle.
Of the last six days it remains two upwards days which have stronger volume. Price broke above a consolidation on a day with strong volume and now has come down to test support. So far this still looks like a fairly typical throwback.
ADX is flat indicating the market is not currently trending. The +DX line remains above the -DX line; no trend change is indicated.
ATR is also declining indicating the market is not trending, in agreement with ADX.
On Balance Volume is constrained within two converging trend lines. The closer these lines get to each other the closer the next strong movement from Gold will be. OBV will be watched carefully; it may breakout before price does and if so would indicate the next direction for price.
To the downside, the blue line on OBV has strong technical significance. It should offer strong support. A break below this line would be a strong bearish signal. A break above the green line would be a bullish signal, but this line does is not as technically significant because it is not as often tested.
There is some hidden bearish divergence between price and OBV from the price high of 6th May to the high for Friday 13th May. Price has made a lower high while OBV has made a higher high. While OBV has made a new high, this has failed to translate to a new high for price; price is weak.
OBV works more reliably with trend lines than divergence, and so a bullish breakout by OBV would be given more weight than bearish divergence by OBV.
RSI is neutral. There is room for price to rise or fall.
Stochastics is neutral.
Price is finding support a little below the 13 day moving average.
This analysis is published @ 05:10 a.m. EST on 14th May, 2016.
FYI:
We are upgrading our servers today for this website. There may be a little down time.
Once done this should make the site load faster.
Down time should be brief, if at all. It’s possible it could be up to 15-20mins worst case scenario.
Lara,
What do you make of the weekly having higher volume recently on down weeks and OBV not supporting the move up over the last few weeks (although the bottom trend line is holding).
When the weekly is like this and the recent daily volume does support the up days, what do you give more credibility to? the weekly or daily?
Weekly.
I’ll be updating weekly analysis today.
That is a serious concern. It favours the alternate.
Although, the daily is “looking inside” the weekly.
So price has been rising on increasing volume. The weeks which are overall downwards have stronger volume, but when you look at what happened within that week it is the upwards days which contribute more to total volume.
So I don’t think it’s as simple as my first comment suggests.
Anyway, my conclusion for now is I’ll recap the weekly analysis today. I’ll do a video as well to clarify everything as much as possible.
Once I’ve gone through that process I may have a clearer conclusion.
Main hourly updated:
The end of minuette (ii) is moved. This sideways chop subdivides as a double zigzag or double combination, the first structure of subminuette w will fit as either a flat or zigzag.
I am happy with the subdivisions of this piece of movement now, it all fits. The wave down labelled micro C to end subminuete y of minuette (ii) most especially can be seen as a five with this labelling. That is important.
For all wave counts today I will label this portion (the double of minuette (ii) )movement in the same way.
For this main wave count now there would be three overlapping first and second waves. This would expect some acceleration upwards in the next 24 hours.
The green base channel should provide support. The upper edge should be breached if a third wave up is underway.
There will be alternates of course in todays analysis, but for now this is still the main wave count.
And what if today’s high 1288,79 was the top of minute II in an ending diagonal for
minor C in the alternate daily count…???
We have still one month to go until 15 June to hear the FED’s rate hike decision.
Wednesday 2:00 pm the FED releases the minutes from the last meeting.
Gold now dropping even lower than 10:56 am low of 1273.36 now at 1272.46 at 1:05 am.
How low might gold drop before moving above 1288.79 today’s high at 8:46 am.
May this be a quick mid day or a multi day correction before moving higher?
This may well be only the A wave of a 4th. I can discern 5 waves down.
Today high 1288.79
Friday low 1263
x .618
Possible retrace 1,272.85 just my guess.
Any comments or alternate retrace targets?
Gold finally dipping fast down at 10:23 am.
How deep and time frame of a dip might we expect for a low now before gold turns much higher?
Yes I know that 1963 and 1955 are no longer valid.
Just a View: With 1261-60 holding, not expecting Gold price to break below 1272-71 but could still possibly drop for 1266-64…..Hope not~! Would look to go long on it anyway….. 🙂
First alternate is now invalidated.
3. A new high above 1,279.99 would invalidate the first alternate below.
Within the triangle, minuette wave (e) may not move beyond the end of minuette wave (c) above 1,279.99.
With the price touching a high of 1284.05 @ 2:15 am ET, it stands to reason that subminuette 2 ended earlier at the point labelled Micro A in the main count, i.e. 1263.
The continuation cannot be as described in the main count, that Micro B becomes 1284.05 because the resulting expanded flat in subminuette 2 demands that Micro C = 2.618 Micro A, bringing it well below the beginning of Minute 1 @ 1256.91. The only possibility for this to happen is that that value becomes Minor 2.
If my reckoning as detailed in the first paragraph above is correct, then we are now in a strong third (micro 3) of a third (subminuette 3) of a third (minuette 3) up. My strategy would then be to buy at any available dip once the market opens.
So both lower targets of 1263 and 1255 sound like won’t happen.
Thanks to news MONDAY 8:30 am EST Empire state index
Gold hit 1288.79 at 8:46 am
2. A breach of the upper edge of the pink channel.
Big US news
MONDAY 8:30 am EST Empire state index
TUESDAY 8:30 am Consumer price index
WEDNESDAY 2:00 pm FED FOMC minutes