
The main Elliott wave count expected upwards movement for Friday’s session.
Price moved sideways in a small range.
Summary: At the end of the week the situation is unclear. Classic technical analysis at the weekly chart level this week favours the alternate Elliott wave count, but at the daily chart level it favours the main Elliott wave count. The bottom line is price is again range bound. A break above 1,288.30 is required for confidence in the main wave count. If that happens, expect price to continue upwards for a big third wave to reach the target at 1,477. A break below 1,237.97 would indicate more downwards movement to a target at 1,183.
New updates to this analysis are in bold.
To see last weekly charts click here.
DAILY ELLIOTT WAVE COUNT
Click chart to enlarge.
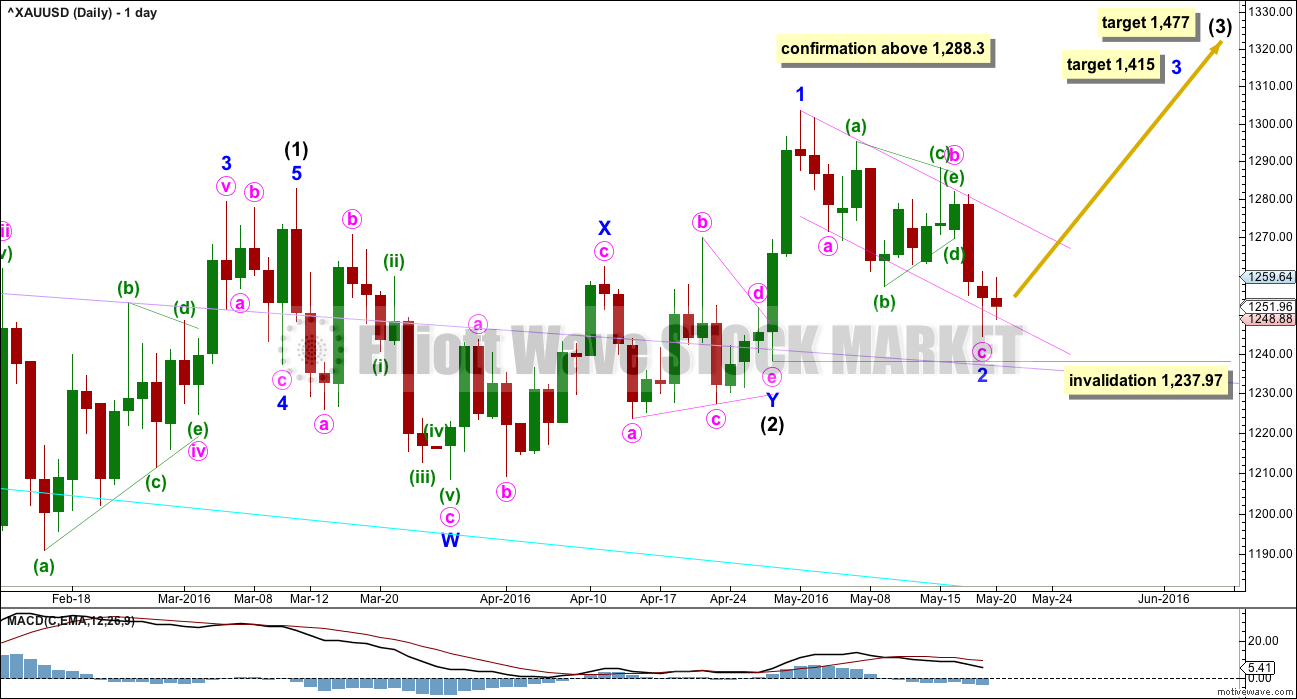
Intermediate wave (2) may be a shallow 0.19 double combination.
Minor wave W is a zigzag, the first structure in a double. The two structures in the double may be joined by a simple zigzag for minor wave X in the opposite direction.
Minor wave Y may be a running contracting triangle. The triangle is supported by MACD hovering at the zero line here on the daily chart.
The next wave up for intermediate wave (3) should be swift and strong. It must move above the end of intermediate wave (1) at 1,282.68. It must move far enough above this point to allow room for intermediate wave (4) to unfold and remain above intermediate wave (1) price territory.
At 1,477 it would reach equality in length with intermediate wave (1). This target is reasonable because intermediate wave (2) was very shallow.
If intermediate wave (2) is over as labelled, then it may have totalled a Fibonacci 34 sessions.
Minor wave 2 is a zigzag with a triangle for minute wave b within it. Minor wave 2 may be a very deep correction. So far it is 0.90 the depth of minor wave 1. Draw a small channel (pink) about minor wave 2 using Elliott’s technique for a correction as shown. Copy this over to the hourly chart.
Minute wave a lasted two sessions. Minute wave b triangle lasted nine sessions. Minute wave c may be complete also lasting two sessions. Minor wave 2 now totals a Fibonacci 13 sessions. It is very likely to be over here.
Minor wave 2 may not move beyond the start of minor wave 1 below 1.237.97.
Gold often begins new trends slowly. The beginning of intermediate wave (1) saw brief impulses and time consuming deep second wave corrections at minor, minute and minuette wave degrees.
Golds impulses, particularly its third waves, normally accelerate at the middle and explode in a blowoff at the end of the fifth wave.
HOURLY ELLIOTT WAVE COUNT
Click chart to enlarge.
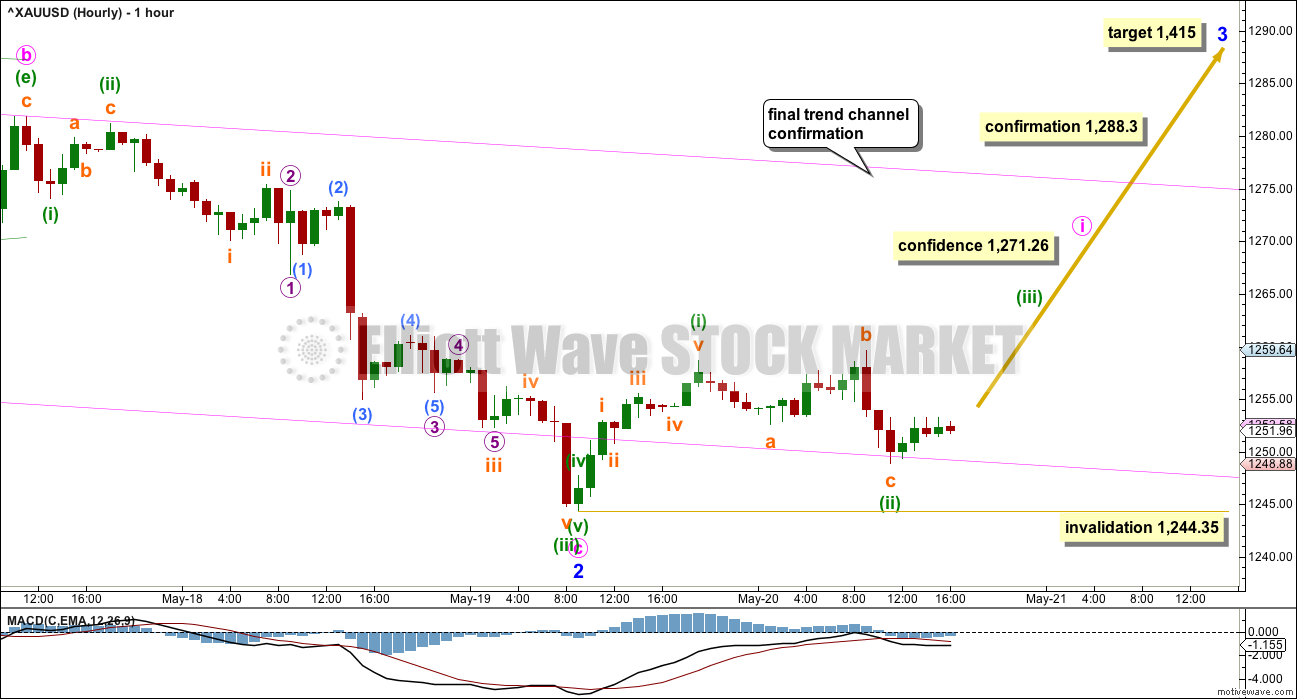
The impulse downwards for minute wave c begins at the high 1,281.88 on 17th May.
The hourly chart shows all of minute wave c. It is possible to see this downwards movement as a complete impulse.
At 1,415 minor wave 3 would reach 1.618 the length of minor wave 1.
The next correction downwards is finding support at the lower pink trend line now that price is back within the pink channel. Keep drawing this channel on daily and hourly charts as it may continue to be useful.
At the hourly chart level, with a five up and now a three down within the pink channel, the invalidation point may be moved up to the start of minuette wave (i). Minuette wave (ii) may not move beyond the start of minuette wave (i) below 1,244.35.
A new high above 1,271.26 would add confidence to this main wave count and reduce the probability of the alternate.
A breach of the upper edge of the pink trend channel would add further confidence.
Finally, a new high above 1,288.30 would add final price confirmation for this wave count. At that stage, the alternate would be discarded.
Depending upon risk appetite, members may choose to enter long here or wait for one or more confirmation conditions to be met first. Risk today remains at 1,237.97. It is still possible that minor wave 2 may continue a little lower.
ALTERNATE DAILY ELLIOTT WAVE COUNT
Click chart to enlarge.
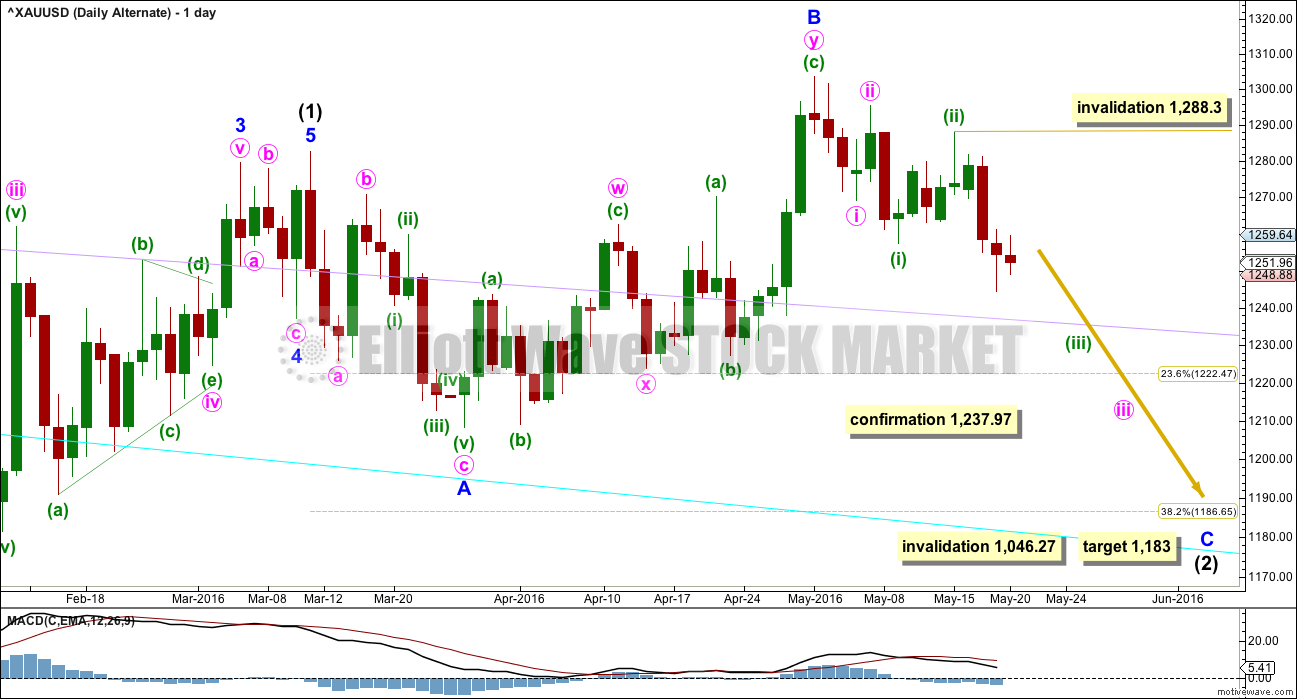
It is still possible that intermediate wave (2) is not over. The probability of this wave count has slightly increased. It would be my judgement that this alternate has about a 30% probability and the main count about a 70% probability.
Normally, the first large second wave correction within a new trend is very deep, often deeper than the 0.618 Fibonacci ratio. The main wave count sees intermediate wave (2) as very shallow at only 0.19 of intermediate wave (1). This is unusual. And so this alternate must be considered.
If any members have long positions on Gold already it is essential that stops are used in case this alternate unfolds.
Intermediate wave (2) may be an expanded flat correction. Minor wave A is a three, minor wave B is a three and a 1.28 length of minor wave A. This is within the normal range of 1 to 1.38.
For this alternate wave count, it is extremely likely that minor wave C would move at least slightly below the end of minor wave A at 1,208.32 to avoid a truncation and a very rare running flat.
At 1,183 minor wave C would reach 1.618 the length of minor wave A. This would be the most likely target. If price keeps falling through this first target, then the second target would be at 1,108 where minor wave C would reach 2.618 the length of minor wave A.
Intermediate wave (2) may not move beyond the start of intermediate wave (1) below 1,046.27.
A new low below 1,237.97 by any amount at any time frame would immediately invalidate the main wave count and confirm this alternate. At that stage, more downwards movement would be expected.
There are two structural options for minor wave C: either an impulse or an ending diagonal. If minute wave c is an ending diagonal as yesterday’s alternate expected, then it would now be a contracting diagonal. It would not be able to move below the end of minor wave A; it would be enormously truncated. The probability of that is so low it must be discarded.
This alternate reverts again to looking at minor wave C as a simple impulse.
Within the impulse, minute waves i and ii would be complete. Minute wave iii may only subdivide as an impulse. Within minute wave iii, minuette waves (i) and (ii) would be complete. Minuette wave (iii) cannot be complete because it has not moved below and stayed below the end of minuette wave (i) price territory.
This change makes no difference to the invalidation point. Within minuette wave (iii), no second wave correction may move beyond the start of minuette wave (i) above 1,288.30.
ALTERNATE HOURLY ELLIOTT WAVE COUNT
Click chart to enlarge.
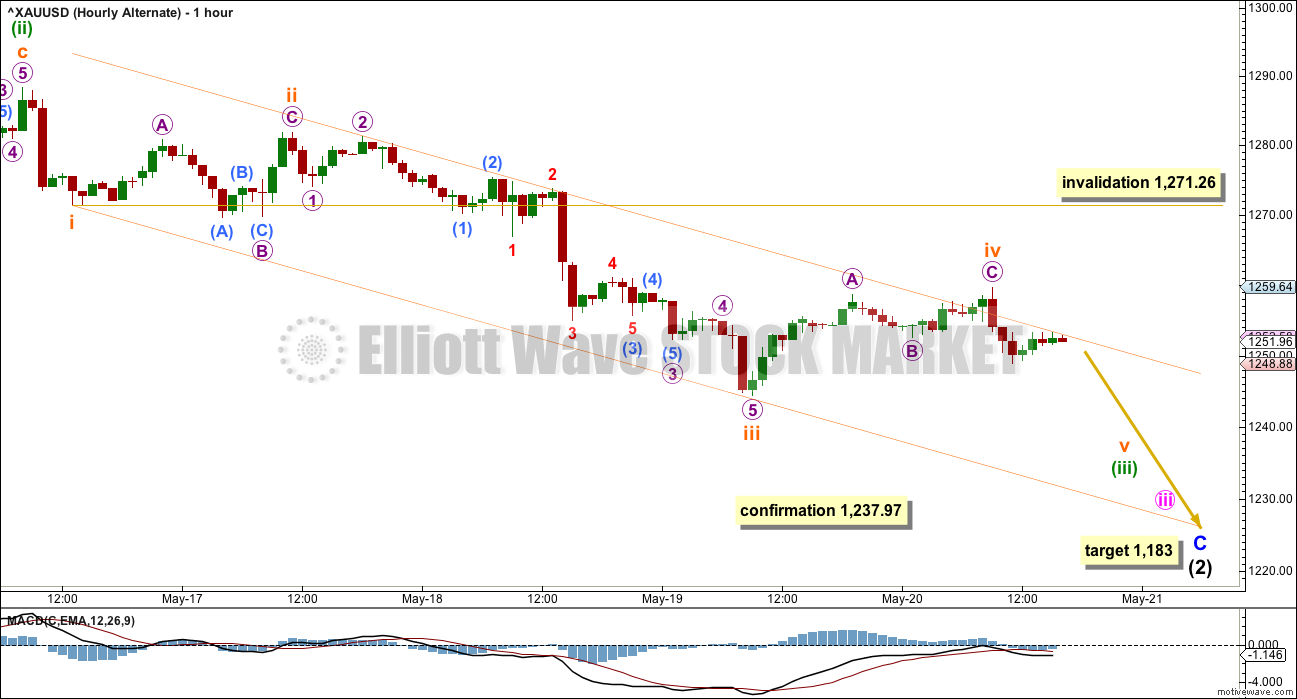
The impulse downwards for this alternate begins at a different point than the impulse downwards for the main wave count. Here, minuette wave (iii) begins at 1,288.30, the high of 16th May. This makes a difference to how the impulse is counted and how the channel about it is drawn.
So far within minuette wave (iii) the final fifth wave down only may be required to compete the structure. Gold often exhibits swift strong fifth waves to end its third wave impulses. That may happen here to the downside.
Draw a channel about minuette wave (iii) using Elliott’s first technique: draw the first trend line from the ends of subminuette waves i to iii, then place a parallel copy on the end of subminuette wave ii. Subminuette wave iv may now be complete, if it is to remain contained within the channel.
Subminuette wave iv may not move into subminuette wave i price territory above 1,271.26.
If price breaks above the upper edge of the orange channel, then the probability of this alternate would be slightly reduced. However, sometimes fourth waves are not always nicely contained within channels which is why Elliott developed a second technique to redraw the channel when the first technique does not work.
If this channel holds, then subminuette wave v may end about the lower edge. If it does not, then subminuette wave v may overshoot the lower edge with very strong downwards movement.
This alternate will remain viable while price remains below 1,271.26. This wave count illustrates risk to any long positions on Gold at the week’s end.
TECHNICAL ANALYSIS
WEEKLY CHART
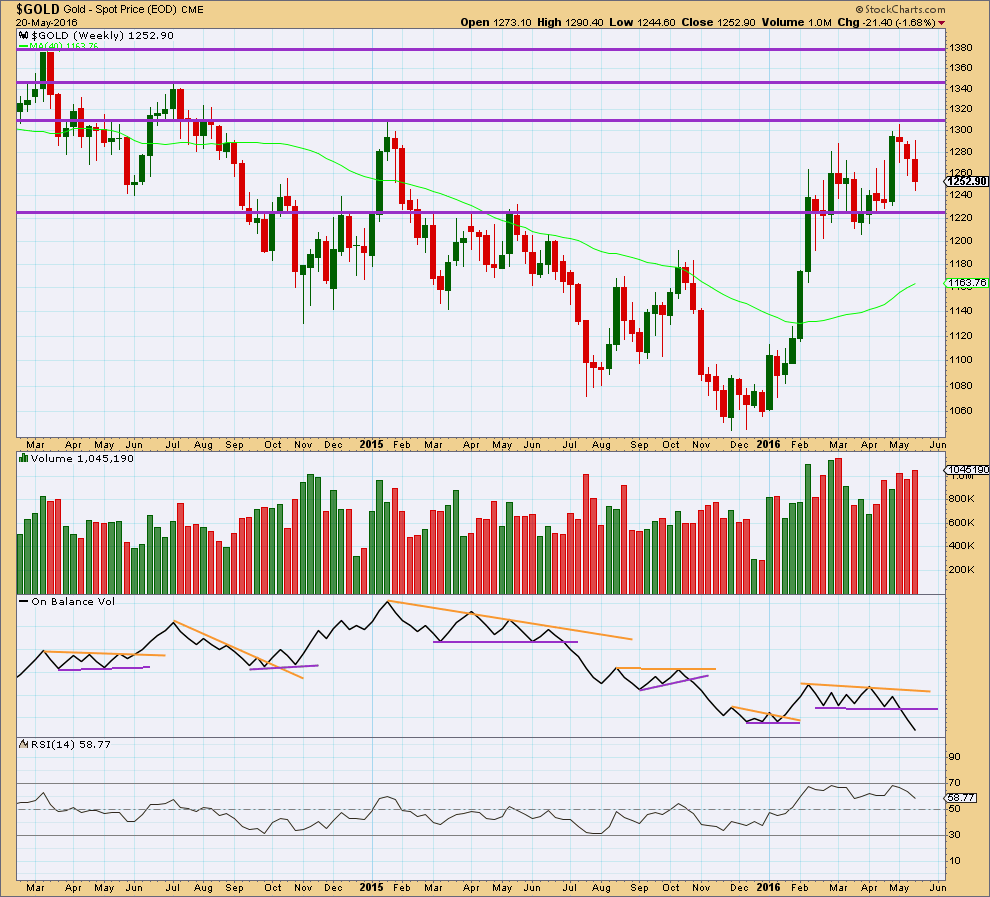
Click chart to enlarge. Chart courtesy of StockCharts.com.
On Balance Volume is breaking below a reasonably long held and clearly defined consolidation zone. It would be entirely reasonable to expect price to follow by continuing lower for a few weeks. This piece of evidence strongly supports the alternate daily Elliott wave count.
Price has found resistance at the horizontal line about 1,310. The first support line may be about 1,225.
At the end of this week, overall, volume has been increasing on downwards movement from price for three weeks. This also supports the alternate daily Elliott wave count over the main wave count.
This weekly candlestick completes a Three Black Crows reversal pattern. Because the pattern is supported by overall increasing volume and it is on the weekly chart, this is a reasonably strong reversal pattern.
DAILY CHART
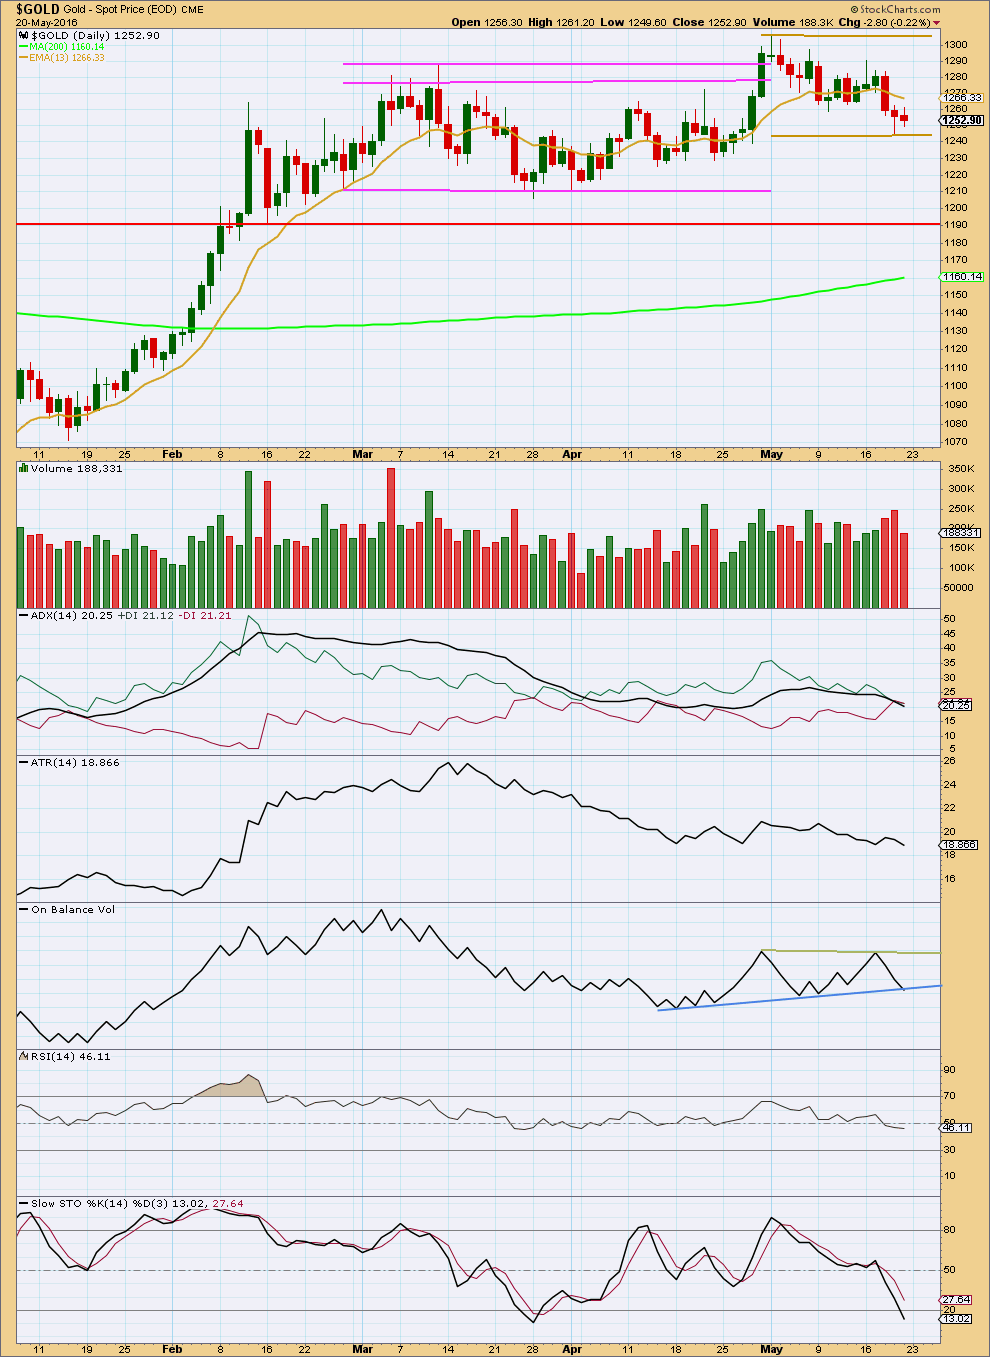
Click chart to enlarge. Chart courtesy of StockCharts.com.
The candlestick for Thursday’s session completes as a hammer. From “Japanese Candlestick Charting Techniques” by Steve Nison, page 34:
“The hammer and hanging man may be recognised by three criteria:
1. The real body is at the upper end of the trading range. The colour of the real body is not important.
2. It has a long lower shadow that should be at least twice the height of the real body.
3. It should have no or a very short upper shadow”
and
“A hammer is valid even if it comes after a short-term decline, but a hanging man should emerge after an extended rally…”
This candlestick comes after a short decline and meets the criteria for a hammer. This is a reversal candlestick pattern. It is important to remember that a reversal does not mean a shift from down to up or vice versa. It means a trend change. That could be from down to sideways or up to sideways equally as well as a full reversal.
The hammer candlestick pattern supports the main Elliott wave count.
The breakout above resistance on high volume for 29th April now looks like it may have been a false breakout. Price today has returned to close comfortably back down in the prior consolidation zone, delineated by pink trend lines.
If it is accepted that the consolidation began in February, then the day with the strongest volume during this period is the downwards day of 4th March, suggesting a downwards breakout.
However, if it is accepted that the consolidation began after the high of 11th March, then the days with strongest volume are 29th April and 21st April, suggesting an upwards breakout.
It may be more helpful to break the consolidation into separate zones. A new consolidation may be forming delineated by brown lines. The lower edge is moved lower today. This smaller consolidation began from the high on 2nd May. So far within it the upwards day of 6th May still has strongest volume suggesting an upwards breakout.
ADX is declining today and for several days has been flat to declining, so no clear trend is indicated. The +DX and -DX lines are crossing over. ADX is indicating a possible trend change. ATR overall still agrees; it is still flat to declining.
On Balance Volume is constrained within two contracting lines. A break above the green line would be a bullish signal. A break below the blue line would be a bearish signal. Friday’s downwards movement has brought OBV down to find support at the blue line. If the main Elliott wave count is correct, then this should initiate upwards movement from price. If the alternate Elliott wave count is correct, then this blue line may be breached on Monday or Tuesday. A bounce up from the blue line would favour the main Elliott wave count. A breach of the blue line would strongly favour the alternate wave count.
RSI is still close to neutral. There is room for price to rise or fall.
Stochastics is now oversold and price may have found support. A range bound trading approach may now expect upwards movement from price about here, to continue until price finds resistance and Stochastics reached overbought.
There is no divergence between price and either of Stochastics or RSI to indicate weakness at this stage.
This analysis is published @ 07:47 p.m. EST on 21st May, 2016.
The main wave count reduces in probability today with a slight new low. Minute c has moved slightly lower, but the structure of it no longer has a very good look.
The main wave count would still require a new low below 1,237.97 for final invalidation.
The alternate wave count can now see minuette wave (iii) over. If that is the case then minuette (iv) may be now moving sideways, it must remain below 1,257.24. Alternatively this could be another first wave down complete and now another second wave up beginning for the alternate. The final invalidation point for the alternate must remain at 1,288.30.
Overall the wave counts don’t change much, and the confirmation / invalidation points are the same.
Probability has slightly shifted to the alternate wave count today.
Gold and NUGT – SMA/EMA is still bullish 5 minute and longer time frames still bullish may not continue bullish much longer as gold may of peaked at 1251.82 at 1:28 pm?
Getting many sell signals on the faster MACD.
Just sold half my nugt at 91, expecting to go above 92 though, but nugt is really sluggish at the moment
Good to get out of NUGT then as at 3:38 pm gold and GDX heading down.
Also believe may retrace from today’s high of 1251.86 at 2:12 pm
Gold may of hit the top of a 5th wave up at 1:17 pm high of 1,251.30?
Any wave count?
Any idea how high gold may retrace back up from today’s low of 1,243.23 at 9:31 am?
With Alan on holiday, I’m not sure we’ll get a reply during the day today?
Yes Alan on Singapore holiday .
Hi guys. I’m back. It was just a short weekend holiday.
If the alternate is in play, I see subminuette 5 begin at 1260.32. Micro 1 and micro 2 were over at 1248.85 and 1256.16 respectively. We are now in micro 3 down.
Of this, 1243.23 is submicro 1. The rise to 1250.10 so far is part of submicro 2. At 0.618 retrace, it would reach 1251.22 before turning down in a third wave. We shall see if this is correct. The alternate is confirmed if price drops below 1237.97, Lara’s point of differentiation between the main and alternate counts.
Which means, there is still a slight chance that the main count may still be in play, and that the drop to 1243.23 terminates Minor 2, and we are now in a huge third wave up (Minor 3, targeting 1416 thereabouts). If this is correct, price will turn up soon. So, uncertainty still looms.
Alan would gold movement above .618 retrace at 1251.22 perhaps signal main hourly action or would gold still have to drop down in a 2nd wave but stay above 1243.23 then bounce back up in a main hourly bullish signal in minor 3, while any movement below 1243.23 today may signal further alternate hourly bearish drop in a third wave?
Perhaps $1,243.23 may be a turning point today between main and alternate and as Lara says let price decide the path.
Hi Richard.
I will consider a rise above 1270.94, subminuette 1 of the alternate count, to be the point in which the main count can have some confidence.
So, I am gunning for either 1270.94 or 1237.97 as the determining factor of the two counts. Of course, a drop below 1243.23 gives some confidence for the alternate count, but since the overall sentiment is still bullish, I’d rather go for 1237.97.
In the meantime, price is still fluctuating within a tight track so, for me, the only safe trade is a scalp.
Alan yes scalping wise move until either the confidence or invalidation point is met and especially with 3x ETFs and with your EW count skills many opportunities for fast and the furious scalps.
Main hourly chart invalidated below the May 19th low of 1,244.35 at 9:29 am and dropped to today’s low of 1,243.23 at 9:31 am likely the end of a 5 wave count down, then turned up.
Gold reached $1,243 and change earlier this morning…. Alternate is in play.
“At the hourly chart level, with a five up and now a three down within the pink channel, the invalidation point may be moved up to the start of minuette wave (i). Minuette wave (ii) may not move beyond the start of minuette wave (i) below 1,244.35.”
Great analysis!!
Is this an ending diagonal for USD?? Or a falling wedge??
A falling wedge is the classic TA equivalent of an Elliott wave ending diagonal when the diagonal is in a downwards trend.
For that to be an ending diagonal though I’m not sure the wave lengths would fit. I think the third wave would be too long. But that depends on where it begins.
Thanks Lara. I remember you writing about the waves lengths in ending diagonal. Great learning.
Without trying to figure out the entire count for GDX, when you look just at the correction so far from the top, the move down looks incomplete. I think it needs one last move down to a new low. Two targets are given in the chart. Also, the .382 retracement for the entire move up comes in @20.91
Therefore, I believe that Gold has a good probability for the Alternate Daily.
Or, you could label it a-b-c instead of w-x-y.
The first wave down for a finishes where you have your a within W. A truncation is avoided.
B would then be a three wave structure.
C down could now be complete, it’s moved beyond the end of A.
You’re right, there is a small truncation which I overlooked.