
Sideways movement in a small range has not clarified the situation, but On Balance Volume today indicates which Elliott wave count is more likely.
Summary: The wave counts are swapped over today. It looks more likely now that Gold will continue lower for several days, possibly a week to two, to a target at 1,183. This outlook would be confirmed with a new low below 1,237.97. Alternatively, a new high above 1,288.30 would confirm more upwards movement to a target at 1,477.
New updates to this analysis are in bold.
To see last weekly charts click here.
DAILY ELLIOTT WAVE COUNT
Click chart to enlarge.
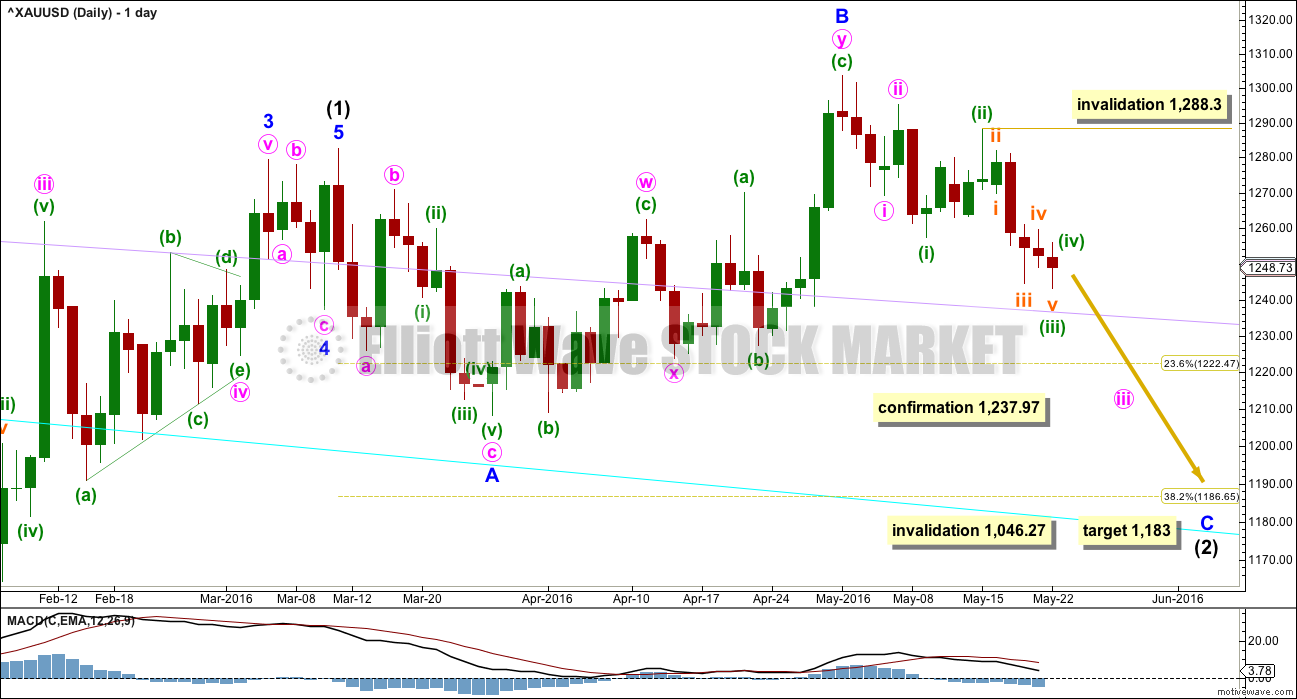
It is still possible that intermediate wave (2) is not over. The probability of this wave count has further increased today to about 60% likely with the alternate the remaining 40%.
Normally, the first large second wave correction within a new trend is very deep, often deeper than the 0.618 Fibonacci ratio.
Intermediate wave (2) may be an expanded flat correction. Minor wave A is a three, minor wave B is a three and a 1.28 length of minor wave A. This is within the normal range of 1 to 1.38.
For this wave count, it is extremely likely that minor wave C would move at least slightly below the end of minor wave A at 1,208.32 to avoid a truncation and a very rare running flat.
At 1,183 minor wave C would reach 1.618 the length of minor wave A. This would be the most likely target. If price keeps falling through this first target, then the second target would be at 1,108 where minor wave C would reach 2.618 the length of minor wave A.
Intermediate wave (2) may not move beyond the start of intermediate wave (1) below 1,046.27.
A new low below 1,237.97 by any amount at any time frame would immediately confirm this wave count. At that stage, more downwards movement would be expected.
There are two structural options for minor wave C: either an impulse or an ending diagonal. If minute wave c is an ending diagonal as yesterday’s alternate expected, then it would now be a contracting diagonal. It would not be able to move below the end of minor wave A; it would be enormously truncated. The probability of that is so low it must be discarded.
Within the impulse, minute waves i and ii would be complete. Minute wave iii may only subdivide as an impulse. Within minute wave iii, minuette waves (i) and (ii) and now (iii) may be complete as labelled. If current sideways movement is minuette wave (iv), then it may not move into minuette wave (i) price territory above 1,257.24. It is also possible to move the degree of labelling within minuette wave (iii) down one degree; it may still be incomplete. Within minuette wave (iii), no second wave correction may move beyond the start of its first wave above 1,288.30.
HOURLY ELLIOTT WAVE COUNT
Click chart to enlarge.
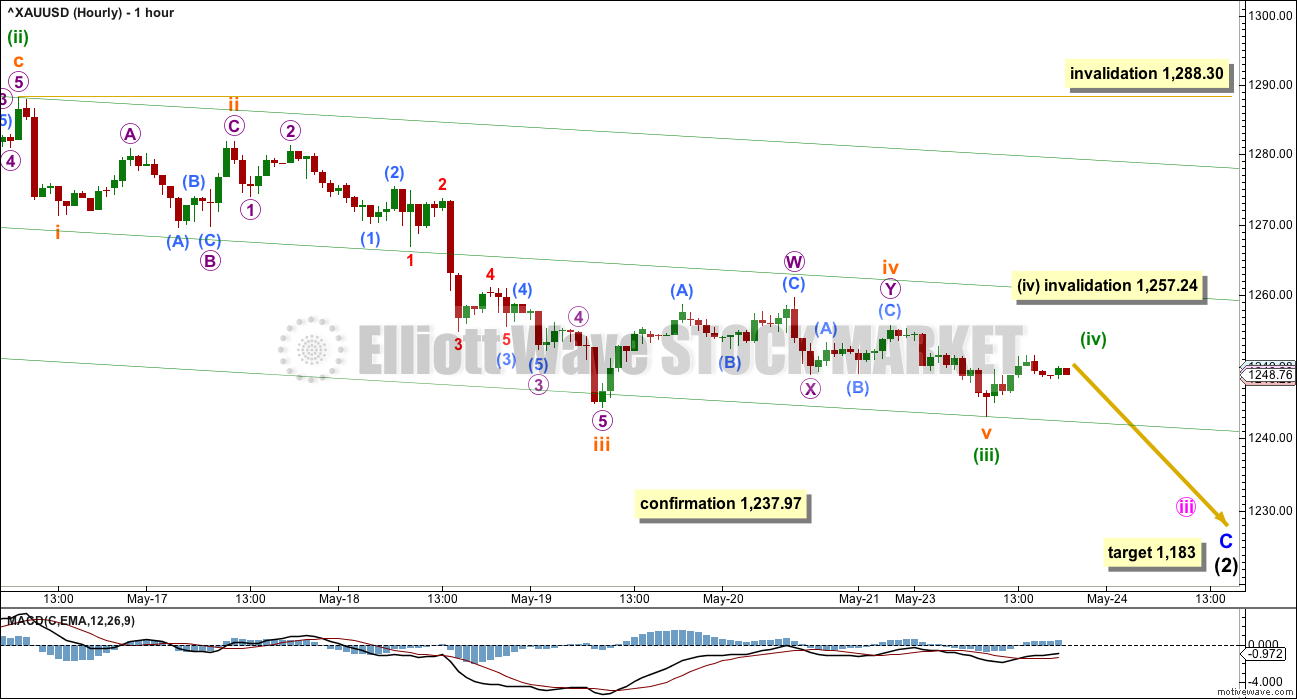
The impulse downwards for this main wave count begins at a different point than the impulse downwards for the alternate wave count. Here, minuette wave (iii) begins at 1,288.30, the high of 16th May. This makes a difference to how the impulse is counted and how the channel about it is drawn.
The structure of minuette wave (iii) may now be complete. There is alternation between the expanded flat of subminuette wave ii and the combination of subminuette wave iv. The strongest part of downwards movement is subminuette wave iii and there is divergence with price and MACD at the end of subminuette wave v.
If this degree of labelling within minuette wave (iii) is correct, then the correction now beginning should be a shallow sideways correction of minuette wave (iv) which must not move above 1,257.24.
If the degree of labelling within minuette wave (iii) is wrong and it is one degree too high, then the correction beginning now may be another second wave correction. It may not move beyond the start of its first wave above 1,288.30.
This wave count would be confirmed with a new low below 1,237.97.
ALTERNATE DAILY ELLIOTT WAVE COUNT
Click chart to enlarge.
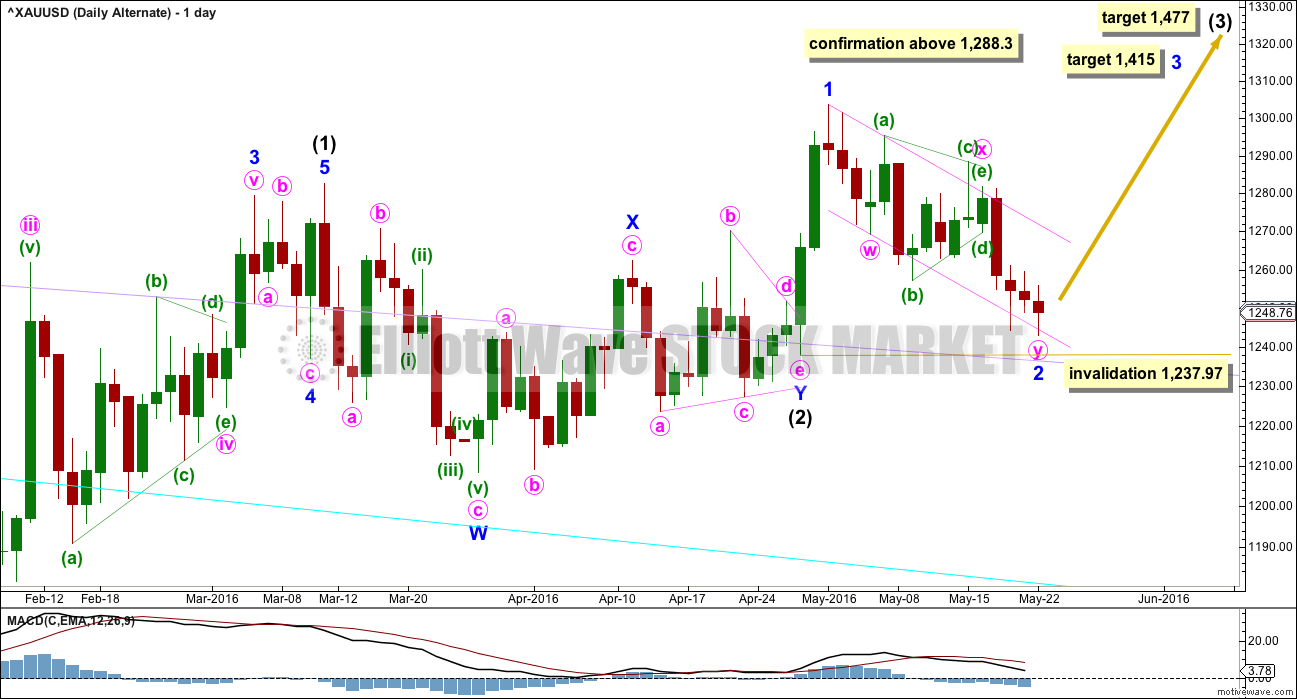
Intermediate wave (2) may be a shallow 0.19 double combination.
Minor wave W is a zigzag, the first structure in a double. The two structures in the double may be joined by a simple zigzag for minor wave X in the opposite direction.
Minor wave Y may be a running contracting triangle. The triangle is supported by MACD hovering at the zero line here on the daily chart.
The next wave up for intermediate wave (3) should be swift and strong. It must move above the end of intermediate wave (1) at 1,282.68. It must move far enough above this point to allow room for intermediate wave (4) to unfold and remain above intermediate wave (1) price territory.
At 1,477 it would reach equality in length with intermediate wave (1). This target is reasonable because intermediate wave (2) was very shallow.
If intermediate wave (2) is over as labelled, then it may have totalled a Fibonacci 34 sessions.
Minor wave 2 will subdivide as a double zigzag with a running contracting triangle for minute wave x within it. Minor wave 2 has now lasted 15 sessions and is a very deep 0.92 length of minor wave 1.
Gold often begins new trends slowly. The beginning of intermediate wave (1) saw brief impulses and time consuming deep second wave corrections at minor, minute and minuette wave degrees.
Golds impulses, particularly its third waves, normally accelerate at the middle and explode in a blowoff at the end of the fifth wave.
ALTERNATE HOURLY ELLIOTT WAVE COUNT
Click chart to enlarge.
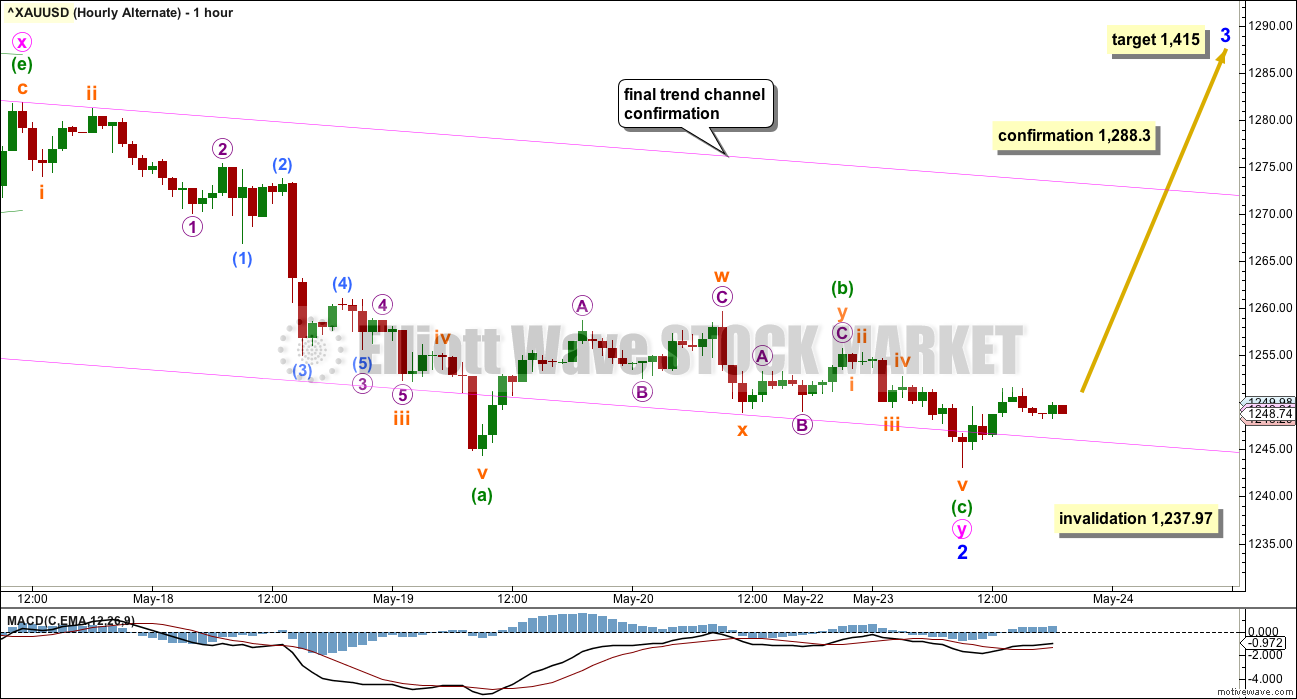
The zigzag down for minute wave y begins at the high 1,281.88 on 17th May.
A breach of the pink channel would provide confidence in this main wave count.
The first confidence point must be removed today. The only price point which would add confidence to this wave count at this stage is 1,288.30. A new high above that point would invalidate the main wave count at the hourly and daily chart levels.
At 1,415 minor wave 3 would reach 2.618 the length of minor wave 1.
There is some divergence today with the new low and MACD. While price made a slight new low MACD made a higher low. This divergence is bullish and indicates downwards movement today was weak.
TECHNICAL ANALYSIS
WEEKLY CHART
Click chart to enlarge. Chart courtesy of StockCharts.com.
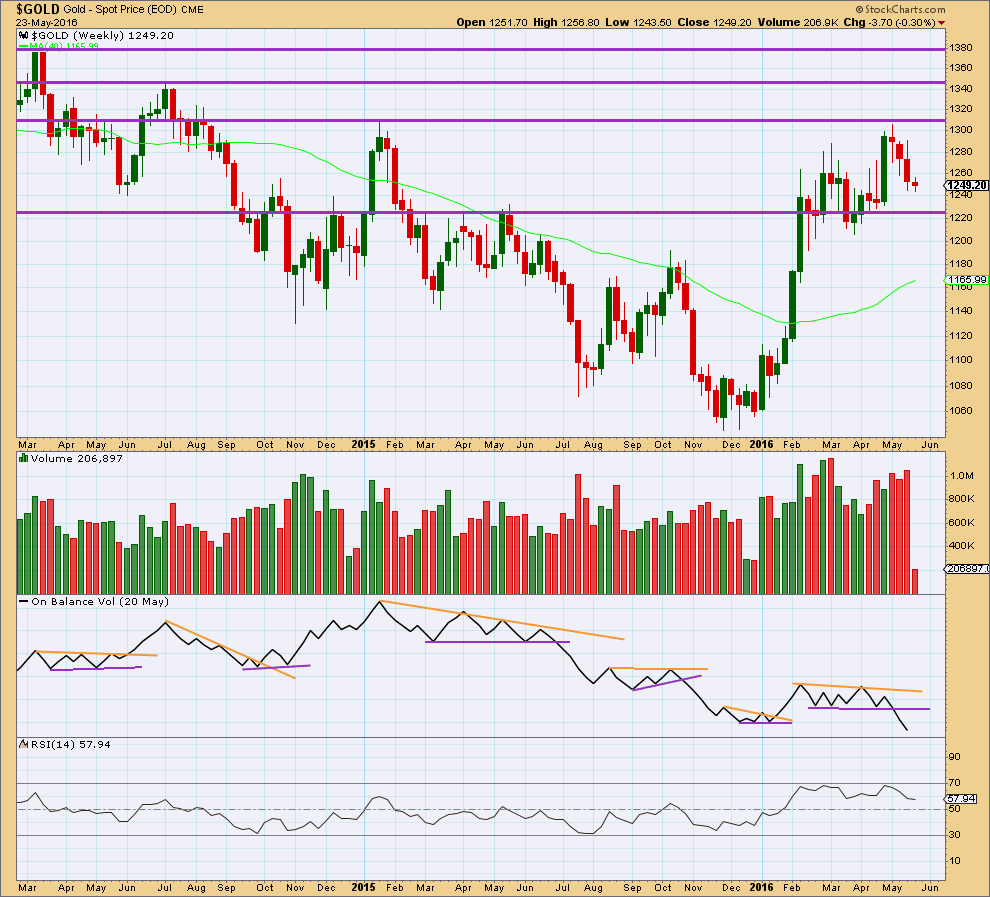
On Balance Volume is breaking below a reasonably long held and clearly defined consolidation zone. It would be entirely reasonable to expect price to follow by continuing lower for a few weeks. This piece of evidence strongly supports the alternate daily Elliott wave count.
Price has found resistance at the horizontal line about 1,310. The first support line may be about 1,225.
At the end of last week, overall, volume has been increasing on downwards movement from price for three weeks. This also supports the alternate daily Elliott wave count over the main wave count.
Last weekly candlestick completes a Three Black Crows reversal pattern. Because the pattern is supported by overall increasing volume and it is on the weekly chart, this is a reasonably strong reversal pattern.
DAILY CHART
Click chart to enlarge. Chart courtesy of StockCharts.com.
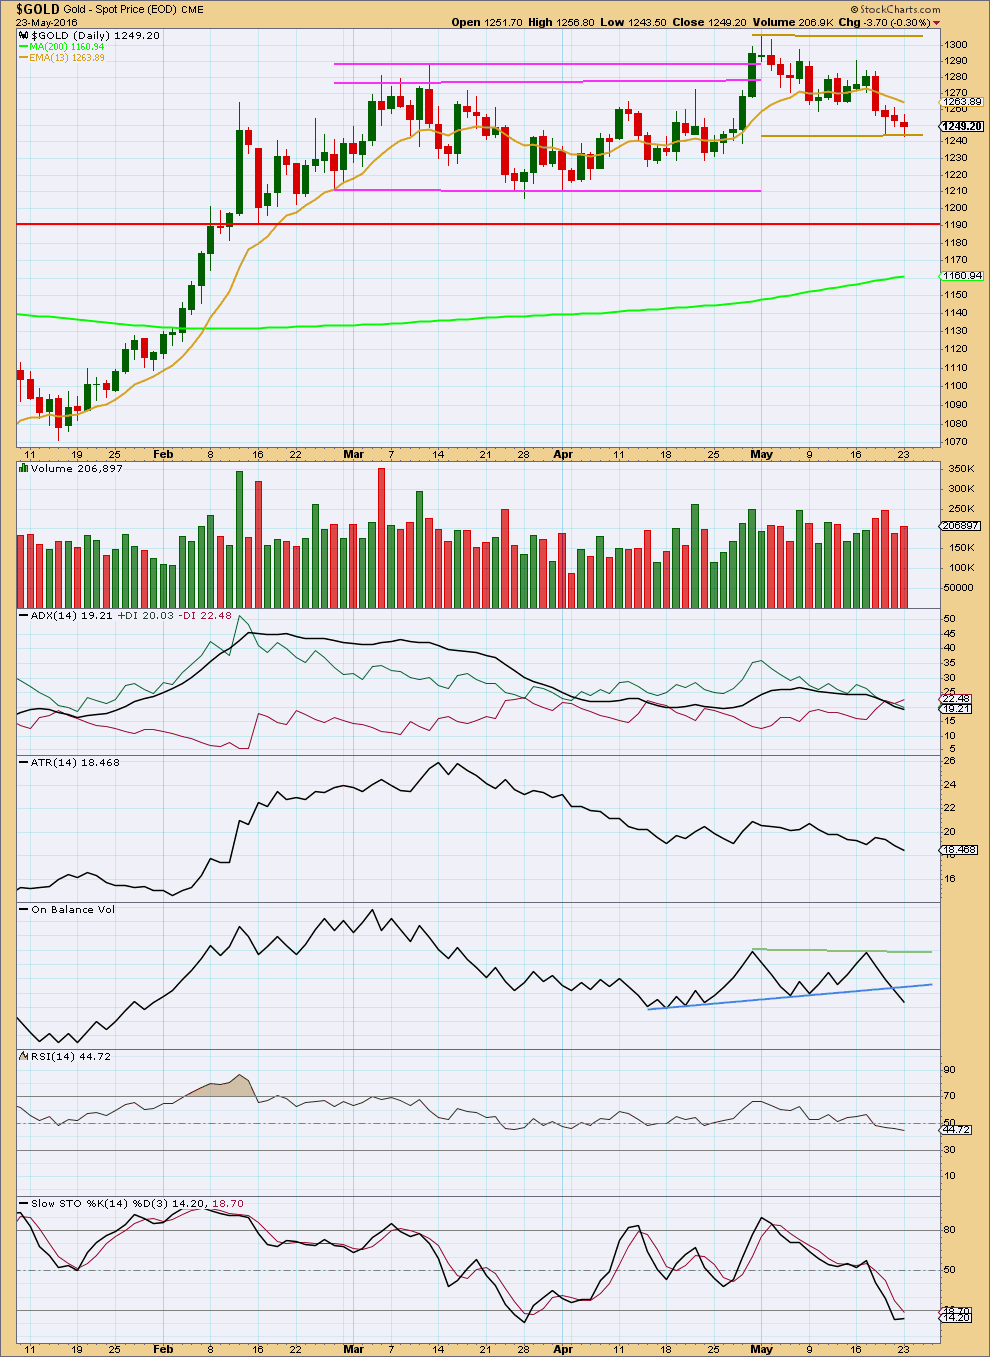
Four red daily candlesticks in a row come now on overall declining volume. Overall, the fall in price is not being supported by volume.
The red hammer candlestick pattern for 19th May may be indicating an end to downwards movement and the start of either sideways or upwards movement.
ADX is declining indicating the market is not trending. ATR agrees; it too is declining. With the market not trending, it should be expected to swing from resistance to support and back again. An upwards swing should be expected to begin about here with price at support and Stochastics oversold.
On Balance Volume today is clearly bearish though, which puts some doubt on range bound movement continuing. The strong break below the blue line today from OBV is the reason for swapping the wave counts over today. OBV is now bearish at both the weekly and daily chart levels. OBV normally works well as a leading indicator when it breaches trend lines, so I give it a lot of weight. OBV is indicating price is likely to break below support and continue to move lower.
RSI is close to neutral. There is room for price to rise or fall. I will be looking for divergence between price and RSI to indicate the end of downwards movement. There is no divergence today.
This analysis is published @ 08:14 p.m. EST.
Finally we have some clarity and now just the one wave count (for now, I’ll be looking for alternates as always).
I do not think minuette (iii) is over. This strong downwards day looks like subminuette v of minuette (iii), a typically strong fifth wave to end a third wave impulse.
The target at 1,183 so far remains the same.
Along the way down there should be at least one sizeable fourth wave correction for minute iv.
It now needs more downwards movement to complete the structure and for minor C to avoid a truncation.
Although I would have preferred the bull count to be correct for a 3rd wave up, I’ll admit that Lara’s analysis was extremely prescient.
The issue now will be to avoid jumping into long positions too early, as gold could easily see another $100 down. The action around $1183 will be very telling.
The Fib retracement levels might offer a little help: 38.2% is at just about last low of 1208, 50% is just under the 1.618 area of 1183, and 78.6% is just under the 2.618 area of 1108. The 61.8% retracement is just under the round number of 1150.
It seems a test of 1208 is a given since there is nearly zero bounce from today’s lows.
GLTA
Lara’s main daily chart has the Fib numbers
23.6 at 1222.47
38.2 at 1186.65
Hi Richard,
Thanks for noting Lara’s retrace levels. Those work if you’re using the intermediate 1 high, which is one way to do it. I’m looking at the entire move from Dec bottom to May top (wave b top of intermediate 2)…many traders will be looking at those retrace levels for clues to where this decline might end. A typical bottom to top retrace level analysis.
Thanks for clarifying Corey.
This downwards move is an impulse at minor degree, so it should be traceable.
Personally, I don’t want to trade this down as it’s against the largest trend and I’m particularly patient. I have a NZDUSD trade which looks good so far, so I’m waiting for Gold to bottom and S&P to top.
Alan, what gold price might correspond with NUGT at $70.08?
You mentioned two NUGT prices,
“The corresponding values of NUGT will be the next two supports at 82.48 and 70.08.”
I was thinking to get to $70.08 might take a long time, however NUGT has already dropped from Monday close at $86.45 down to $74.82 today low at 2:17 pm
Richard, my best guess is still 1226 which is not reached yet. NUGT may not approach that low because 70.08 is not very strong support. The next strong support for gold price is 1206-1204 which can take place after the next gold price correction upwards. But NUGT could drop further to its stronger support level at 59.12.
I’ll just play it as it comes.
With confirmation affirmed today of the alternate, I’d like to see gold continue to decline for trading purposes. The last couple of days, the US stock market has done well; S&P up 26 points today (1.26%) to 2,074 at 1:40 EST.
I’m just wondering if the S&P is forecasted to break out further and what the impact would be to Gold and the Miners? On the other hand, if the S&P falls and falls hard, would Gold and the Miners find greater support.
Currently, the US stock market is handling the news well that the Fed has been messaging with regards to potentially raising rates in June. I believe this to be a good sign because if the US markets decline, it may provide a reason for the Fed to withhold from increasing. Thanks for your insight!
The US markets did well today and gold dropping hard.
http://stockcharts.com/
Click on “HOME” on left top and see US markets all up now.
Gold just hit lower daily trend line for February 16th, March 28th, and May 24th on http://www.pmbull.com. It also hit the lower weekly trend line since July 2015.
Thanks for the direction this morning Allan.
Looks like we may hit close your lower 1226 target today.
If so where do you think the 4 th wave back up will go to?
Thanks
Hi Marc. Sorry I missed your query. Lara has answered your question.
At the moment, I am not comfortable with the positions for micro 4 and micro 5. They look squashed.
I will update my response based on today’s prices later should there be any changes.
Gold and GDX bearish sell from 1 minute to a day on SMA/EMA time frames.
Gold now down $24 at 1228.32 at 12:19 pm down from 1252.33 at 10:39 pm.
Gold is a big curve down on the hourly chart.
Gold and NUGT are both now still in a Bearish Sell signal 5 minute SMA/EMA since before the open today.
If I am correct, we are approaching the end of subminuette 5 and hence minuette 3 of the main count. My target is 1237-1235. 1236.58 is the point at which SM5 = 0.618 SM3. 1235.28 is the point in which minuette 3 = 1.382 minuette 1. But, fifth waves are notorious for extending, and so price may move much lower before a 4th wave correction. Then, my next lower target is 1226, in which minuette 3 = 1.618 minuette 1.
The corresponding values of NUGT will be the next two supports at 82.48 and 70.08.
Alan, thanks for that timely assessment.
Got dust this morning at 15.30. Will hold until Friday. Hoping to get nugt on sale on Friday or Monday.
Thank you Alan, I would agree with this assessment.
Alternate daily is invalidated.
Gold hit low since the close just now at 1,236.00 at 9:22 am.
Things just got much more bearish!
Confirmation of the new (swapped) main count looks imminent. Gold at 1241 now. A bottom may come around the Fed meeting, June 15th? Or maybe the Brexit vote on June 23rd?
Maybe minuette wave (iv) already ended at the high of $1,252.33 at 10:39 pm and minuette wave (v) is already now heading down to a new low below today’s low of 1,243.23. Or is the down part now just the B part of A-B-C for minuette (iv)?
Unfortunately both could be what’s happening.
If it’s over though that would have been a very brief fourth wave counterpart to the second wave. Minuette (ii) lasted 93 hours. Minuette (iv) if it’s over would have been just 8 hours.
The problem is that Gold can have quick shallow fourth waves, right before and just after sharp fifth waves.