
Downwards movement was expected as most likely for yesterday’s main Elliott wave count.
Summary: The wave count now expects more downwards movement. Along the way down there should be two fourth wave corrections which should show up on the daily chart. A breach of the small orange channel on the hourly chart would indicate the first of these two corrections has arrived. Expect price to continue lower while it remains within the channel. The final target at this stage remains at 1,183.
New updates to this analysis are in bold.
To see last weekly charts click here.
DAILY ELLIOTT WAVE COUNT
Click chart to enlarge.
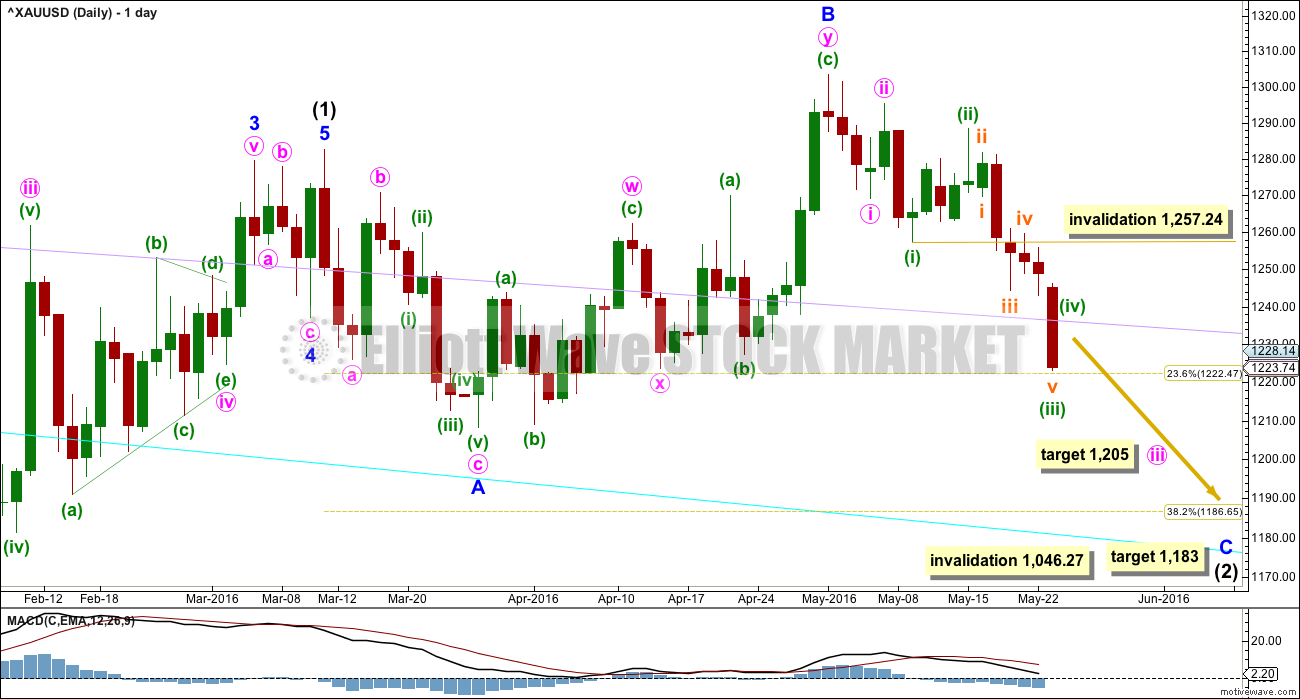
Intermediate wave (2) is not over.
Normally, the first large second wave correction within a new trend is very deep, often deeper than the 0.618 Fibonacci ratio.
Intermediate wave (2) may be an expanded flat correction. Minor wave A is a three, minor wave B is a three and a 1.28 length of minor wave A. This is within the normal range of 1 to 1.38.
For this wave count, it is extremely likely that minor wave C would move at least slightly below the end of minor wave A at 1,208.32 to avoid a truncation and a very rare running flat.
At 1,183 minor wave C would reach 1.618 the length of minor wave A. This would be the most likely target. If price keeps falling through this first target, then the second target would be at 1,108 where minor wave C would reach 2.618 the length of minor wave A.
Intermediate wave (2) may not move beyond the start of intermediate wave (1) below 1,046.27.
There are two structural options for minor wave C: either an impulse or an ending diagonal. Minor wave C does not look at this stage like an ending diagonal. It looks like the more common impulse.
Within the impulse, minute waves i and ii would be complete. Minute wave iii may only subdivide as an impulse. Within minute wave iii, minuette waves (i) and (ii) and now (iii) may be complete as labelled. The arrival of minuette wave (iv) would be confirmed with a breach of the orange channel on the hourly chart. It may not move into minuette wave (i) price territory above 1,257.24.
When minuette wave (iv) is complete, then the next wave down for Gold would be minuette wave (v) to complete minute wave iii. Gold’s fifth waves to complete its third wave impulses can be swift and strong. This next one may be swift and strong.
At 1,205 minute wave iii would reach 2.618 the length of minute wave i.
HOURLY ELLIOTT WAVE COUNT
Click chart to enlarge.
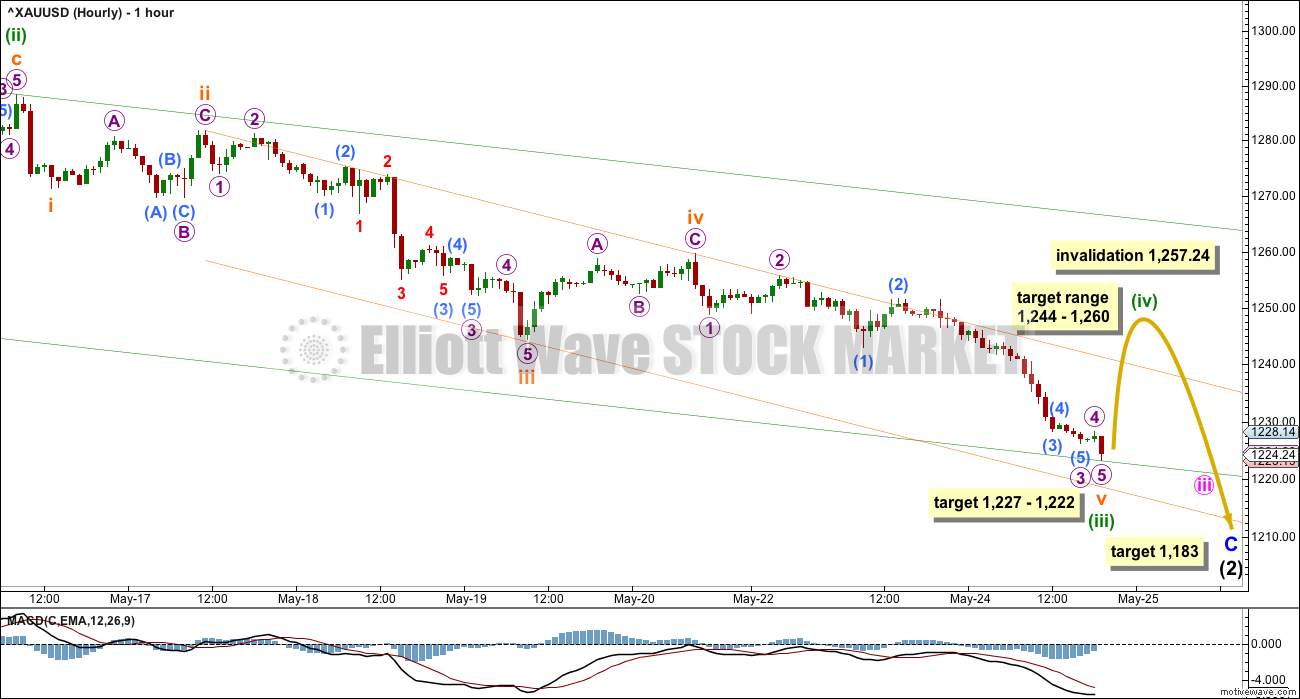
Minuette wave (iii) may be complete as labelled, or it may continue lower. It is not confirmed as complete until the orange channel is breached by upwards movement.
If minuette wave (iii) is over here, then it would be just 3.42 longer than 1.618 the length of minuette wave (i).
Price is now within the target zone for minuette wave (iii). At 1,227 minuette wave (iii) reached (and passed) 1.618 the length of minuette wave (i). At 1,222 subminuette wave v would reach equality in length with subminuette wave iii. The lower end of the target zone is favoured because it is calculated at a lower wave degree.
The orange channel is drawn using Elliott’s second technique about the impulse of minuette wave (iii). When price breaches the upper edge of the channel, then it would confirm the impulse of minuette wave (iii) as complete and that the next wave, minuette wave (iv), should be underway.
Minuette wave (iv) may end within the fourth wave of one lesser degree territory. Subminuette wave iv has its price range from 1,244 to 1,260. If this expectation is wrong, it may be too high.
Minuette wave (ii) shows on the daily chart as four daily candlesticks. Minuette wave (iv) should also show on the daily chart for the structure of minor wave C to have the right look at the daily chart level. It would likely last about two or three daily candlesticks. It may be more brief than the more time consuming minuette wave (ii).
Minuette wave (iv) may not move into minuette wave (i) price territory above 1,257.24.
TECHNICAL ANALYSIS
WEEKLY CHART
Click chart to enlarge. Chart courtesy of StockCharts.com.
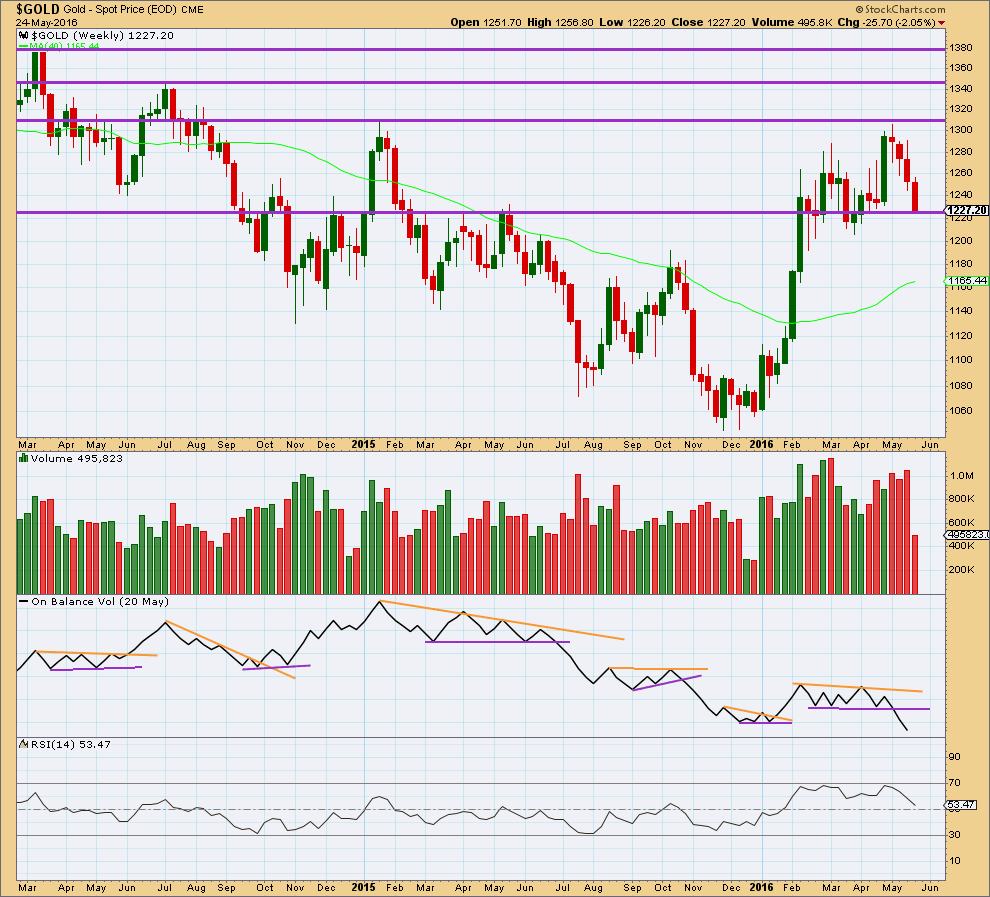
On Balance Volume is breaking below a reasonably long held and clearly defined consolidation zone. It would be entirely reasonable to expect price to follow by continuing lower for a few weeks. This piece of evidence strongly supports the Elliott wave count.
Price has found resistance at the horizontal line about 1,310. The first support line may be about 1,225.
At the end of last week, overall, volume has been increasing on downwards movement from price for three weeks. This also supports the Elliott wave count.
Last weekly candlestick completes a Three Black Crows reversal pattern. Because the pattern is supported by overall increasing volume and it is on the weekly chart, this is a reasonably strong reversal pattern.
DAILY CHART
Click chart to enlarge. Chart courtesy of StockCharts.com.
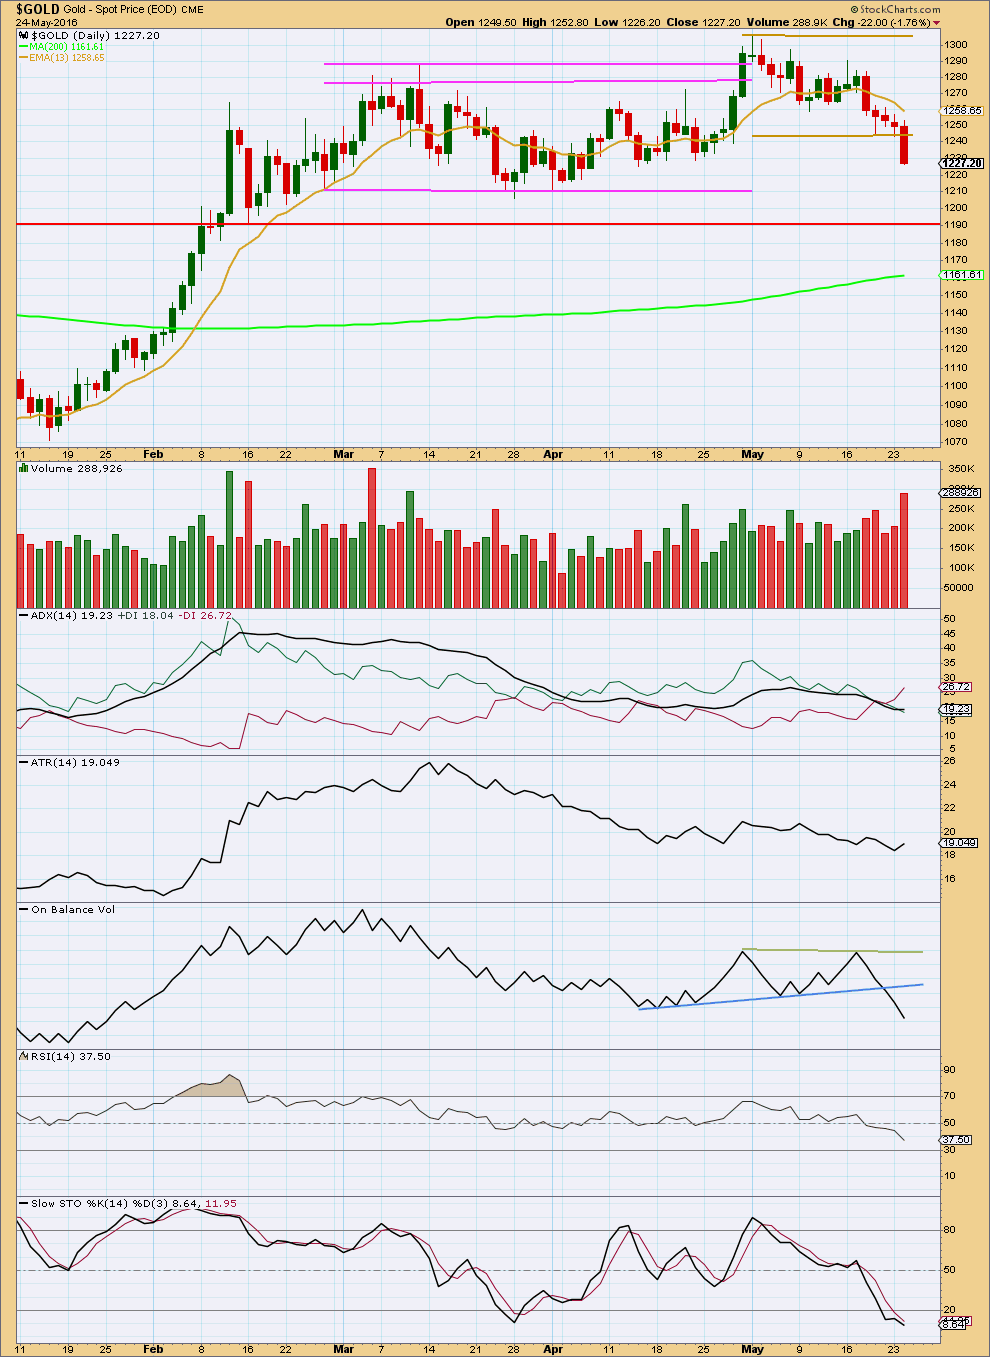
On Balance Volume worked well to indicate a downwards breakout from price just before it happened. OBV is clearly bearish. Downwards movement from price should be expected to continue until it finds support and / or diverges from RSI. Very little weight would be given to divergence with Stochastics because it is not very reliable.
The fall in price today is supported by volume. There is no divergence with RSI. Support may be about 1,210, the lower pink trend line of a prior consolidation.
ADX is today flat indicating no clear trend. ATR is now turning up indicating the start of a new trend, possibly. These two indicators are lagging as they are based on 14 day averages.
This analysis is published @ 08:23 p.m. EST.
With gold closing down 6 days in a row from $1,283 down to $1,218 low today a drop of $65 from the high to the low one might think that gold may retrace back up more than $20 from $1,218 today’s low up to the $1,235 – 1,238 target area
for minuette (iv)?
The hardest thing today is figuring out if minuette (iv) is over or not. I would expect it to show on the daily chart at least slightly so that minute iii looks like a clear impulse.
My first idea is what if it is an expanded flat? Subminuette b is 1.8 X subminuette a, within the allowable convention. At 1,235 subminuette c = 2.618 X a. This is close to the 0.236 Fibonacci ratio at 1,238.
This would give perfect alternation.
Now to look for alternates.
Gold looking weak around 3:00 pm and GDX looks peaked at 23.18 at 3:00 pm.
Almost non stop all day bullish in NUGT since the day low of $67.33 at 9:43 am.
Even though gold peaked at 1225.12 at 1:04 pm NUGT has continued higher to a day high of $78.10 at 2:35 pm up $10.77 from the day low of $67.33.
No sure how more bullish NUG will continue.
The longer time frames SMA/EMA and MACD showed NUGT was extremely oversold and moved up much stronger than the limited movement in gold.
Gold just hit high of $1,225.12 at 1:04 pm might this be the high area or peaking now for the day?
Might this be a larger correction up longer than today as all NUGT MACD time frames 1 to 195 minutes are giving Buy signals since 9:45 am?
Or might this just phase up before the close and drop hard again overnight?
Just wondering if gold is now in a small 4th wave and about to move back up?
1217.85 at 9:46 am today’s low
1222.51 at 10:21 am top of first 5 up
1218.02 at 10:46 am bottom of wave 2
1223.99 at 11:50 am top of 3rd wave up
1221.99 at 12:32 pm in 4th wave down
Recognize that gold is at this point close to the bottom of the 1 hour trend line down.
However frustrating when NUGT goes up from $67.33 day low at 9:45 am all the way up to day high of $75.50 at 11:43 and curious how much higher gold and NUGT might go up today before heading down again towards 1205.
Gold price dropped to a low of 1220.54 and is currently rebounding. I was monitoring it the whole day today (my day is your night, 12 hours difference). Once it dropped below 1223.38 this morning, two thoughts came to my mind. One, Lara’s report was correct as is and Minuette 4 takes the form of an expanded flat. Two, Minuette 3 was not over, and 1223.38 was only micro 3 of subminuette 5 of Minuette 3. Lara did mention that Minuette 3 could go lower. “Minuette wave (iii) may be complete as labelled, or it may continue lower. It is not confirmed as complete until the orange channel is breached by upwards movement (sic).” This means the rise to 1230.33 was micro 4, and the drop to 1220.54 was micro 5, and hence subminuette 5 and Minuette 3. I can count 5 waves for the micro 4 to micro 5 drop, and hence the expanded flat B wave cannot stand (It has to be 3 waves).
So, we should now be in Minuette 4. The possible targets are 1236.65 (0.236 Fib) or 1246.61 (0.382 Fib). [Note: I promised Marc this.] NUGT could reach 87.01 as the next strong resistance, and this should correspond to the higher value of 1246.61. We shall see as the US day goes by.
With the further drop in the gold price, my earlier post is wrong.
Lara’s count is correct. Minuette 4 was a very shallow rise to 1230.32, and we are now dropping nicely to 1205.
Thanks Alan.
So with 1205 target likely in site today what are your thoughts on rebound back up before final drop back down?
Still in $1235-45 range?
Laura posted previously $1244-1260.
Thanks
Hi Marc. Until 1205 is absolutely certain, it is hard to give an exact figure. The nearest I can put my fingers on is 1240-1239, the 0.382 retrace of wave 3. Thereafter, the drop would reach 1183.
Thank you, Alan, for your response and the timeliness of the response; market open in US.
By chance, would you happen to have a thought on the timing of Minuette 4 completion; targets are $1,236 or $1,246?
The reason for asking is because the US GDP numbers will be released on Friday morning at 8:30 ET. This will most likely be a catalyst to impact gold pricing.
Thanks again!
Hi Stephen. It does look like Minuette 4 is already over at 1230.32 as in my latest post. I can’t see any other possible scenarios. The expanded flat idea could be right if the B wave of Minuette 4 is a double zigzag but as of now, it is rather deep.
Let’s see if anyone else can see a better fit to the movement so far.
Alan is this what your thinking? ADX pulling back, suggestive of a correction coming imo. Im looking for 38.2% fib initially
Paul your guess is the same as Lara’s, congrats on a great call.
Lara – A fourth wave correction looks like it may begin here and may last one to three days. The target is at 1,244.
GDX chart by EagleSeagle. The gap at 20.5 looks like a reasonable target. That could equal about 54 for NUGT. Wow!
I do agree with your assessment for NUGT. Remember yesterday I posted that the lower target I had for NUGT was 59.12. This could correspond to the 1205 or 1183 of the gold price.
Rambus on the HUI
https://rambus1.com/2016/05/24/hui-update-270/
Rambus on the USD and and gold
https://rambus1.com/2016/05/24/wednesday-report-121/
Dreamer thanks for this info.
It kind of reinforces the possibility of gold sinking past current target of $1173 to something closer to $1050 in step with US$ at 100 if the US$ continues its climb over the next few months through the summer.
http://www.marketwatch.com/story/this-one-thing-could-send-gold-tumbling-below-1000-again-citi-2016-05-23
We will see how much the commercials covered having built up a position of 300k short. Since That hi of about 1300 gold has dropped about 70 bucks. Since the COT position is logged for Tuesday….this Friday’s result will indicate how much they covered . If it is less than 100k we have a ways to go..
Probably low 1100s….wait and see.