
Price continued lower, which is what the wave count expected while price remained within the channel.
Summary: A fourth wave correction looks like it may begin here and may last one to three days. The target is at 1,244. The trend at this stage is down and the final target remains at 1,183.
New updates to this analysis are in bold.
To see last weekly charts click here.
DAILY ELLIOTT WAVE COUNT
Click chart to enlarge.
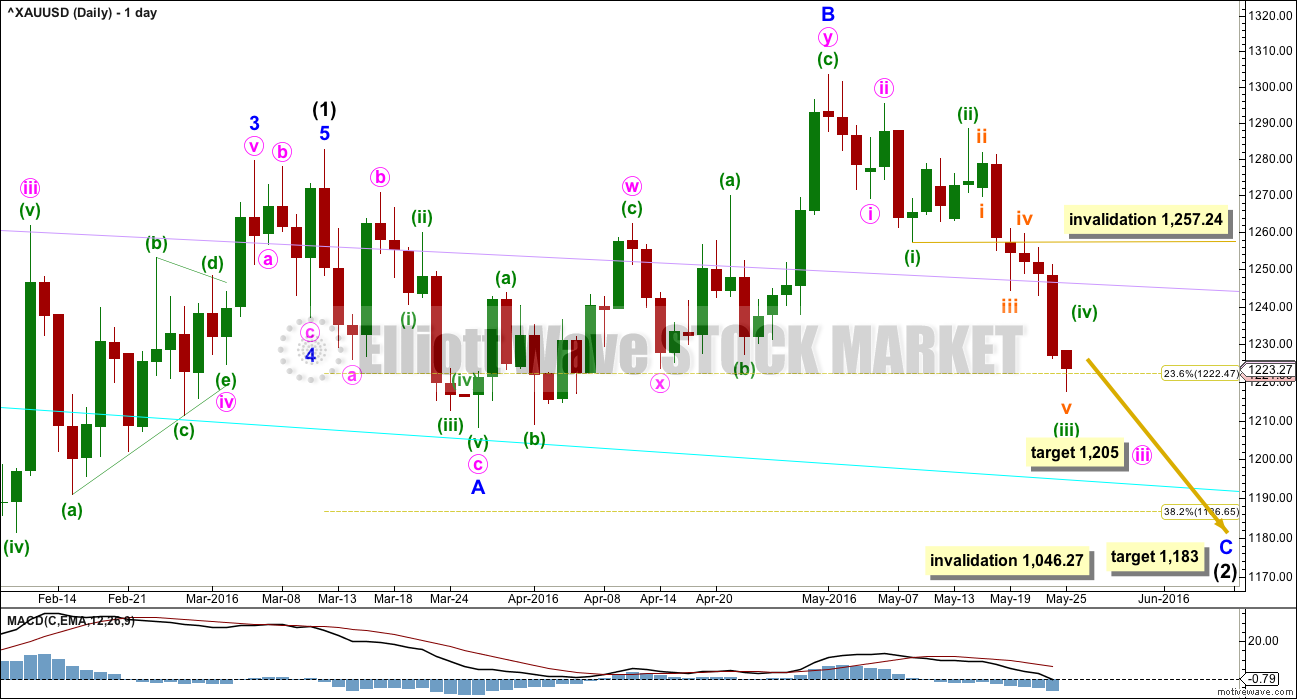
Intermediate wave (2) is not over.
Normally, the first large second wave correction within a new trend is very deep, often deeper than the 0.618 Fibonacci ratio.
Intermediate wave (2) may be an expanded flat correction. Minor wave A is a three, minor wave B is a three and a 1.28 length of minor wave A. This is within the normal range of 1 to 1.38.
For this wave count, it is extremely likely that minor wave C would move at least slightly below the end of minor wave A at 1,208.32 to avoid a truncation and a very rare running flat.
At 1,183 minor wave C would reach 1.618 the length of minor wave A. This would be the most likely target. If price keeps falling through this first target, then the second target would be at 1,108 where minor wave C would reach 2.618 the length of minor wave A.
Intermediate wave (2) may not move beyond the start of intermediate wave (1) below 1,046.27.
There are two structural options for minor wave C: either an impulse or an ending diagonal. Minor wave C does not look at this stage like an ending diagonal. It looks like the more common impulse.
Within the impulse, minute waves i and ii would be complete. Minute wave iii may only subdivide as an impulse. Within minute wave iii, minuette waves (i) and (ii) and now (iii) may be complete as labelled. The arrival of minuette wave (iv) would be confirmed with a breach of the orange channel on the hourly chart. It may not move into minuette wave (i) price territory above 1,257.24.
When minuette wave (iv) is complete, then the next wave down for Gold would be minuette wave (v) to complete minute wave iii. Gold’s fifth waves to complete its third wave impulses can be swift and strong. This next one may be swift and strong.
At 1,205 minute wave iii would reach 2.618 the length of minute wave i.
HOURLY ELLIOTT WAVE COUNT
Click chart to enlarge.
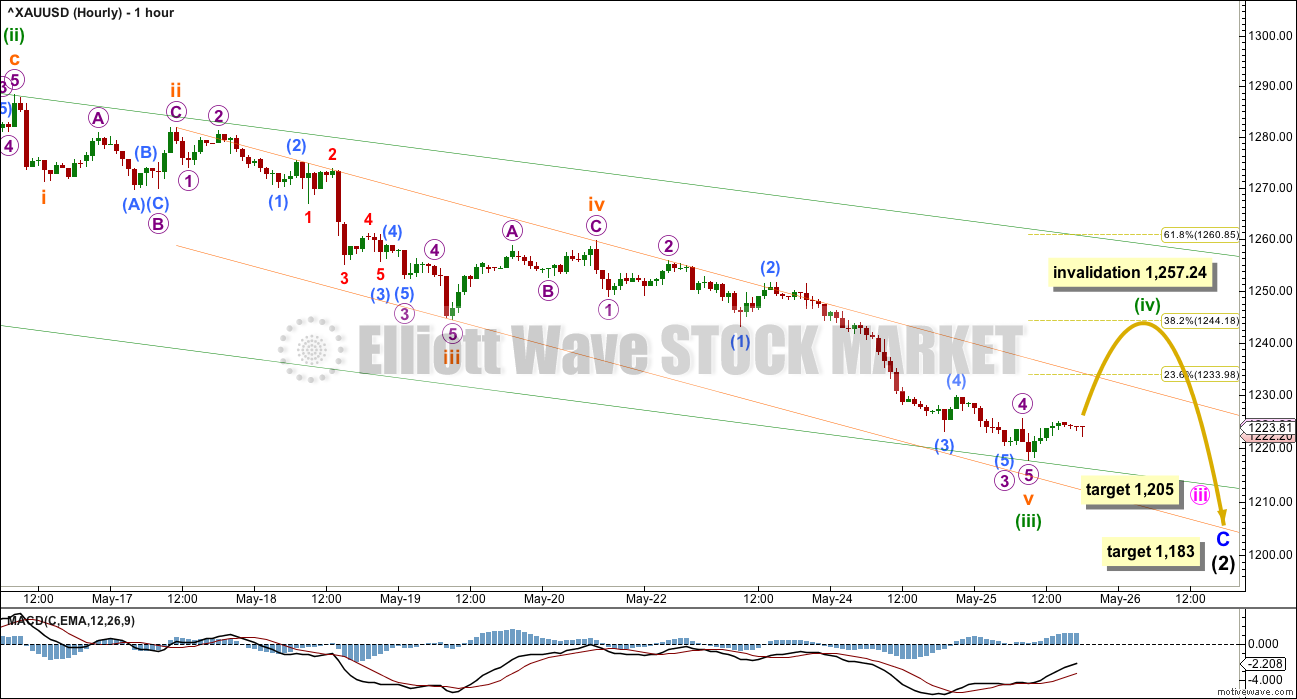
Minuette wave (iii) looks like it has continued lower. It no longer has a Fibonacci ratio to minuette wave (i).
Ratios within minuette wave (iii) are: subminuette wave iii has no Fibonacci ratio to subminuette wave i, and subminuette wave v is now 2.64 short of 2.618 the length of subminuette wave i. Both subminuette waves iii and v are extended.
There is some divergence between price and MACD at the end of subminuette wave v: while price made a new low MACD did not make a corresponding new low. This indicates weakness at the end of this downwards movement.
The orange channel is drawn using Elliott’s second technique: the first trend line from the ends of subminuette waves ii to iv, then a parallel copy on the end of subminuette wave iii. When this orange channel is breached by upwards / sideways movement, then it shall provide confirmation that minuette wave (iii) is over and minuette wave (iv) has begun.
Because minuette wave (ii) shows up on the daily chart as four daily candlesticks, it would be reasonable to expect minuette wave (iv) to also show up on the daily chart as at least one green daily candlestick or doji. It would most likely last two to three sessions. This would give minute wave iii a clear five wave impulse look at the daily chart level. For this reason, I am not considering the possibility that minuette wave (iv) is over already as a very brief shallow correction.
Minuette wave (iv) may not move into minuette wave (i) price territory above 1,257.24.
Minuette wave (ii) was a very deep 0.82 zigzag. Given the guideline of alternation, minuette wave (iv) may be expected to be shallow and a sideways type of correction such as a combination, flat or triangle. If it is time consuming enough, it may find resistance at the upper edge of the green channel.
If minuette wave (iv) unfolds as an expanded flat, running triangle or combination, then it may include a new low below its start at 1,217.67. If within the next 24 hours Gold makes a new low, then look at how MACD is behaving. If there is divergence between price and MACD, then the new low may be part of minuette wave (iv): an X or B wave within it. If there is no divergence and downwards movement shows an increase in momentum, then it would more likely be a strong fifth wave extending lower.
At this stage, there is another fifth wave to end a third coming up. Minuette wave (v) to end minute wave iii may be a swift strong extension. Look out for surprises to the downside for this market at this time.
On balance, the Elliott wave count is supported today by classic technical analysis: light volume today in conjunction with a hammer reversal pattern indicates a pause to this downwards movement at this point.
TECHNICAL ANALYSIS
WEEKLY CHART
Click chart to enlarge. Chart courtesy of StockCharts.com.
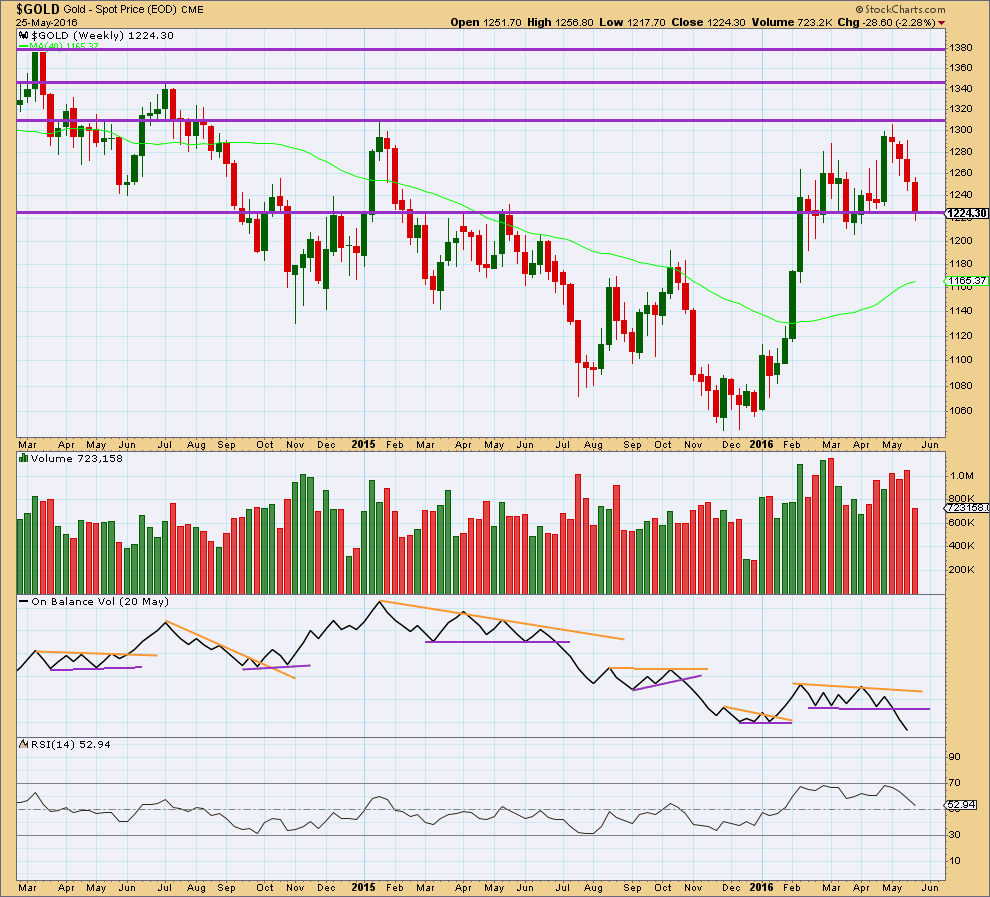
On Balance Volume is breaking below a reasonably long held and clearly defined consolidation zone. It would be entirely reasonable to expect price to follow by continuing lower for a few weeks. This piece of evidence strongly supports the Elliott wave count.
Price has found resistance at the horizontal line about 1,310. The first support line may be about 1,225. This may provide some support today.
At the end of last week, overall, volume has been increasing on downwards movement from price for three weeks. This also supports the Elliott wave count.
Last weekly candlestick completes a Three Black Crows reversal pattern. Because the pattern is supported by overall increasing volume and it is on the weekly chart, this is a reasonably strong reversal pattern.
DAILY CHART
Click chart to enlarge. Chart courtesy of StockCharts.com.
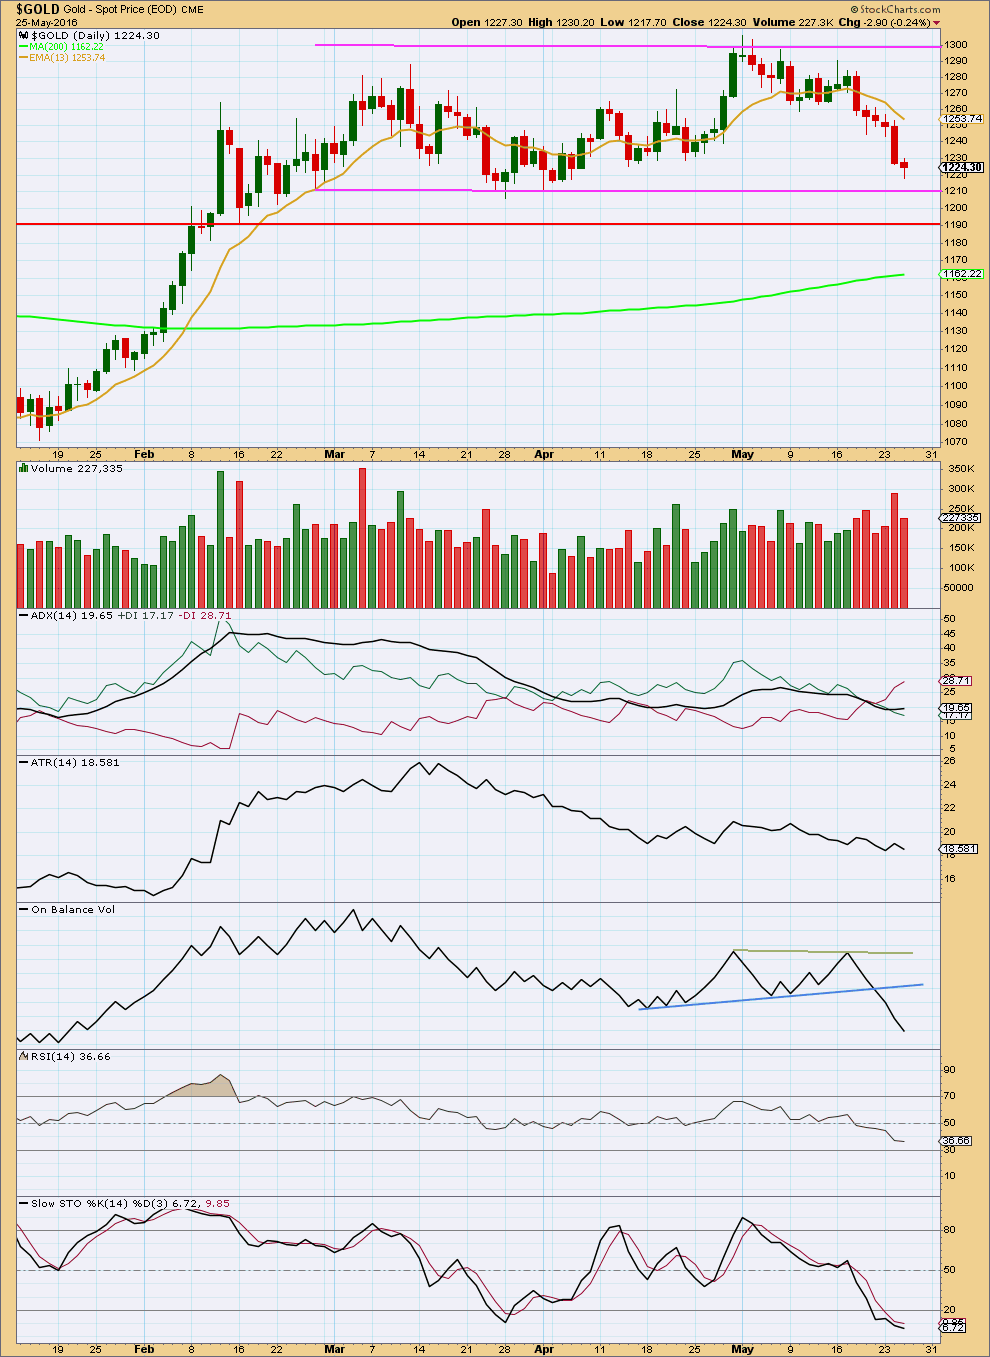
The resistance and support lines of the current consolidation are adjusted again. Support is about 1,210 and resistance is about 1,295.
Today’s small red candlestick comes on lighter volume. The small real body and reduced volume indicate exhaustion to this downwards movement. A pause for a correction or a reversal would be a reasonable expectation about here.
ADX is now indicating the market is trending downwards. ATR disagrees though, so there is some small doubt about this downwards trend. Is it a new trend which may continue, or is it a downwards swing within a larger consolidation. The expectation of how much further price will fall is unclear while ADX and ATR disagree. If ATR turns upwards, that would support a larger downwards trend. But if ADX turns downwards, then price may be expected to find support about 1,210.
RSI is not yet oversold and shows no divergence today with price. Stochastics also shows no divergence with price.
Today’s daily candlestick completes a hammer reversal pattern. Although it has an upper shadow the shadow is small. The lower shadow is 3.2 times the length of the real body (the minimum for a hammer pattern is twice the length of the real body). This reversal pattern supports the Elliott wave count at the hourly chart level which indicates a pause in downwards movement for a correction to last one to three days.
This analysis is published @ 08:18 p.m. EST.
I think NUGT is overpriced now at $77.70 with gold at $1,219.90 at 3:06 pm
Wednesday NUGT was at $71.50 with gold at $1,220.71.
Tuesday NUGT was $72.77 with gold at 1226.20
Gee look at that gold and NUGT dropping at 3:10 pm NUGT down $1 in 1 minute ouch.
My first instinct when looking at the daily chart was that minuette (iv) was over. It can be seen on the daily chart if it was over at Thursdays high.
But then when I look at this downwards movement for this session on the hourly chart it looks very weak. There has not been a new low yet, but MACD would have huge divergence if a new low could be made within a very few hours. MACD shows very weak momentum to this move down.
On balance I would say this wave down is part of minuette (iv). It’s either a B or X wave within a combination, flat or triangle.
I bought some NUGT at $75.62 at 1:32 pm will sell by the close.
Gold market low today
1,218.43 at 12:45 pm
Wednesday’s gold low
1,217.85 at 9:45 am
Could today’s low be almost a 100% retrace or is it more that likely minuette (iv) is over and minuette (v) started at today’s high of 1,234.41 at 9:21 pm?
If there is no divergence and downwards movement shows an increase in momentum, then it would more likely be a strong fifth wave extending lower.
At this stage, there is another fifth wave to end a third coming up. Minuette wave (v) to end minute wave iii may be a swift strong extension. Look out for surprises to the downside for this market at this time.
Gold could have completed Minuette 4 at 1234.40.
Or, that could be subminuette a as Colin inferred.
If Minuette 4 is completed, then the current drop is subminuette 1 of Minuette 5.
If Minuette 4 is still underway, the current drop is subminuette b. And we will have a regular flat unless price drops below 1217.85.
Both should complete around 1218-1219, currently at 1218.44. The bounce will decide which scenario is correct. The first scenario of Minuette 4 being completed will see the bounce not exceeding 1234.40. The second scenario bounce has to reach higher than 1234.40. In any case, this bounce provides a quick scalp of NUGT.
Is it possible minuette (iv) already ended up at 1234.40 AT 9:21 PM EST?
Why is gold dropping to day low of 1,221.73 at 11:01 am?
Or is this subminuette b of minuette (iv)? Minuette (iv) “may last one to three days”.
Maybe or 23.6% at 1233.98?
Good read about $USD and Gold relationship.
“Gold has been weak in U.S. dollar terms recently, as the two often move inversely over the short run. However, long-term gold strength is being confirmed by multiple world currencies.
Be wary of those who claim that U.S. dollar strength always leads to gold weakness. The data does not support this. All major currencies are being debased at varying rates. As a result, gold is being accumulated by investors around the world. USD gold weakness should, thus, be seen as temporary in nature, and an opportunity for accumulation for those with U.S. dollar holdings.”
http://news.gold-eagle.com/article/gold-rising-worldwide/230
THURSDAY, JUNE 2 Big US news
8:15 am ADP employment May — 156,000
8:30 am Weekly jobless claims May 28 N/A N/A
FRIDAY, JUNE 3
8:30 am Nonfarm payrolls May 158,000 160,000
8:30 am Unemployment rate May 4.9% 5.0%
10 am ISM nonmanufacturing May 55.8% 55.7%