
Overall sideways movement fits the main Elliott wave count nicely.
Summary: A fourth wave correction is most likely incomplete. It may end about 1,233. This would be confirmed if price makes a new high above 1,225.71 short term. Alternatively, if downwards movement continues, it may be a fifth wave with a target at 1,195.
New updates to this analysis are in bold.
To see last weekly charts click here.
DAILY ELLIOTT WAVE COUNT
Click chart to enlarge.
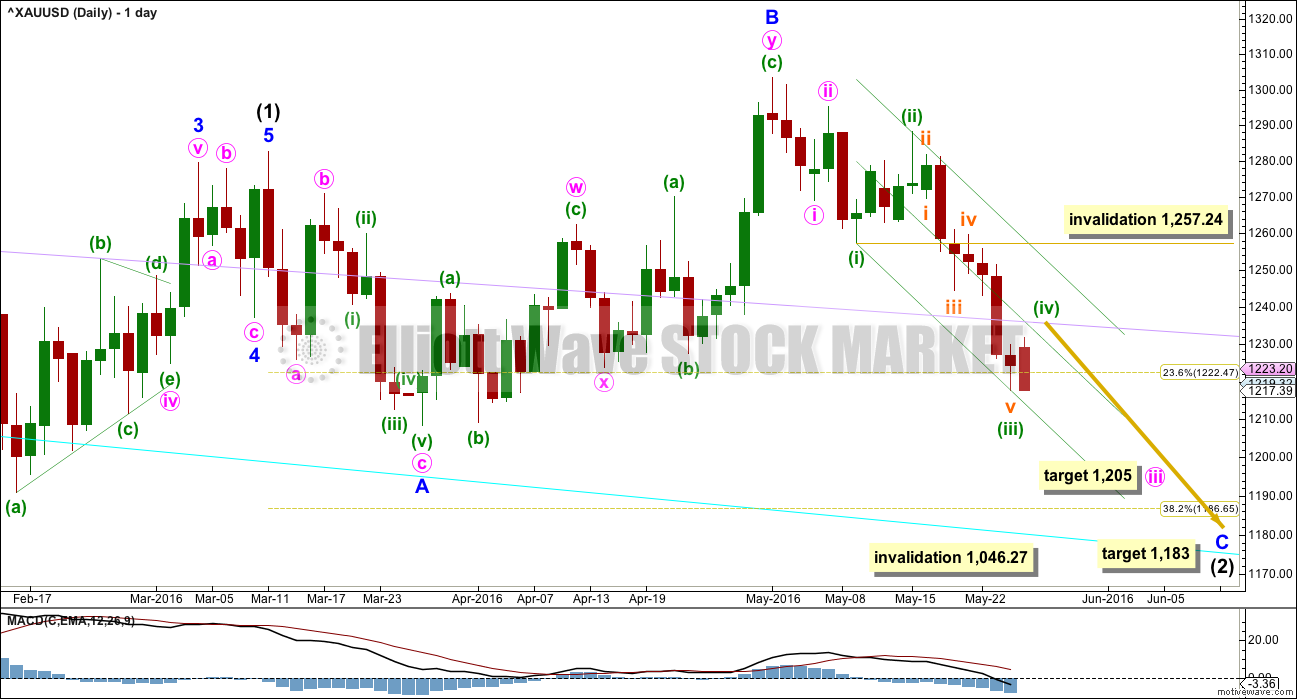
Intermediate wave (2) is not over.
Normally, the first large second wave correction within a new trend is very deep, often deeper than the 0.618 Fibonacci ratio.
Intermediate wave (2) may be an expanded flat correction. Minor wave A is a three, minor wave B is a three and a 1.28 length of minor wave A. This is within the normal range of 1 to 1.38.
For this wave count, it is extremely likely that minor wave C would move at least slightly below the end of minor wave A at 1,208.32 to avoid a truncation and a very rare running flat.
At 1,183 minor wave C would reach 1.618 the length of minor wave A. This would be the most likely target. If price keeps falling through this first target, then the second target would be at 1,108 where minor wave C would reach 2.618 the length of minor wave A.
Intermediate wave (2) may not move beyond the start of intermediate wave (1) below 1,046.27.
There are two structural options for minor wave C: either an impulse or an ending diagonal. Minor wave C does not look at this stage like an ending diagonal. It looks like the more common impulse.
Within the impulse, minute waves i and ii would be complete. Minute wave iii may only subdivide as an impulse. Within minute wave iii, minuette waves (i) and (ii) and now (iii) may be complete as labelled. The question today is whether or not minuette wave (iv) is complete. If it is complete, then it does show on the daily chart, just. This is just acceptable. The main hourly wave count considers minuette wave (iv) incomplete. The alternate looks at the less likely possibility that it is complete.
When minuette wave (iv) is complete, then the next wave down for Gold would be minuette wave (v) to complete minute wave iii. Gold’s fifth waves to complete its third wave impulses can be swift and strong. This next one may be swift and strong.
At 1,205 minute wave iii would reach 2.618 the length of minute wave i.
Draw a channel about minute wave iii using Elliott’s first technique: draw the first trend line from the ends of minuette waves (i) to (iii), then place a parallel copy on the end of minuette wave (ii). Copy this channel over to the hourly chart. The lower edge may provide support for minuette wave (v). Add a mid line. This may show where minuette wave (iv) finds resistance. Minuette wave (iv) may also find some resistance about the lilac trend line which is copied over from the weekly chart.
HOURLY ELLIOTT WAVE COUNT
Click chart to enlarge.
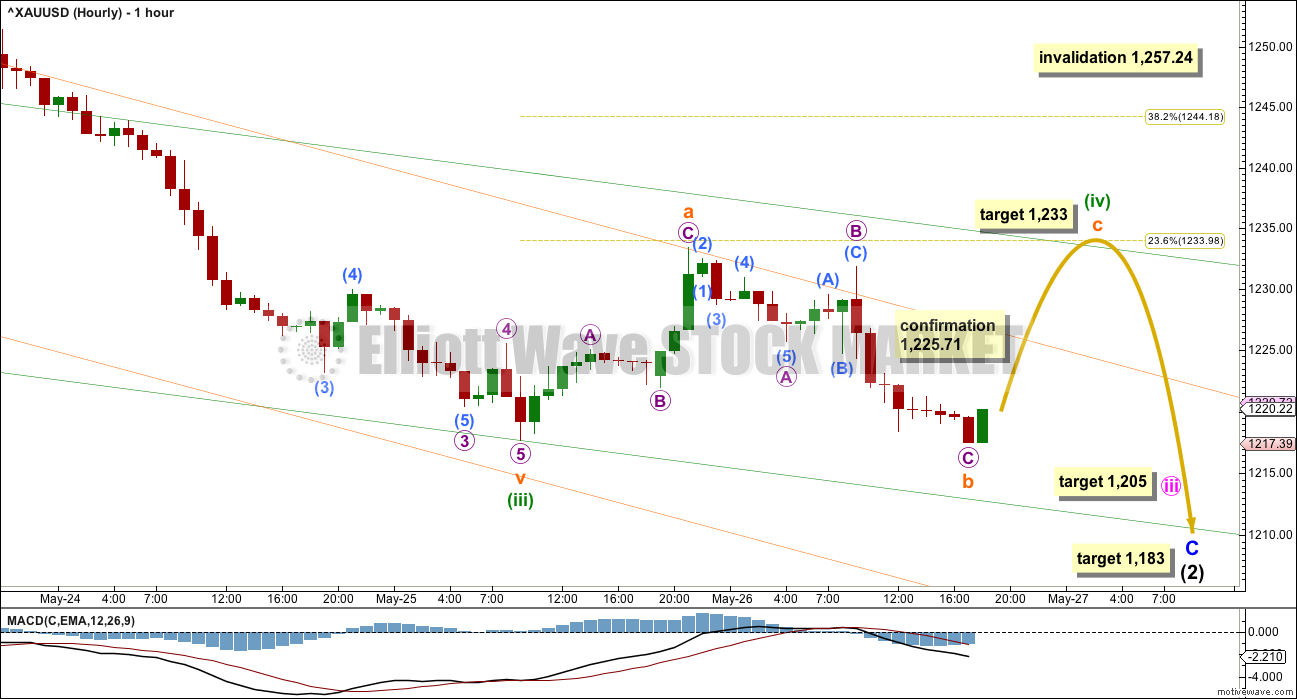
The orange channel is drawn using Elliott’s second technique: the first trend line from the ends of subminuette waves ii to iv (these points can be seen on the daily chart now), then a parallel copy on the end of subminuette wave iii. When this orange channel is breached by upwards / sideways movement, then it shall provide confirmation that minuette wave (iii) is over and minuette wave (iv) has begun.
Because minuette wave (ii) shows up on the daily chart as four daily candlesticks, it would be reasonable to expect minuette wave (iv) to also show up on the daily chart as at least one green daily candlestick or doji. It would most likely last two to three sessions. This would give minute wave iii a clear five wave impulse look at the daily chart level.
Minuette wave (iv) may not move into minuette wave (i) price territory above 1,257.24.
Minuette wave (ii) was a very deep 0.82 zigzag. Given the guideline of alternation, minuette wave (iv) may be expected to be shallow and a sideways type of correction such as a combination, flat or triangle. If it is time consuming enough, it may find resistance at the upper edge of the green channel.
If minuette wave (iv) unfolds as an expanded flat, running triangle or combination, then it may include a new low below its start at 1,217.67. If within the next few hours Gold makes a new low, then look at how MACD is behaving. If there is divergence between price and MACD, then the new low may be part of minuette wave (iv): an X or B wave within it. If there is no divergence and downwards movement shows an increase in momentum, then it would more likely be a strong fifth wave extending lower. At this stage, price has made a slight new low and MACD shows downwards movement is very weak compared to the end of minuette wave (iii). MACD today is indicating that this current downwards movement is more likely part of minuette wave (iv).
At this stage, there is another fifth wave to end a third coming up. Minuette wave (v) to end minute wave iii may be a swift strong extension. Look out for surprises to the downside for this market at this time.
This main hourly wave count has a higher probability than the alternate. I would judge it today to be about 80% likely. It is again supported by classic technical analysis.
In the short term, a new high above 1,225.71 would invalidate the alternate below and provide some price confirmation of this main wave count.
If subminuette wave b does not move any lower, then the target for subminuette wave c will be at 1,233 for it to reach equality in length with subminuette wave a.
If submineutte wave b is over now, then it is a 1.01 correction of submineutte wave a. Minuette wave (iv) may be either a running contracting triangle or a regular flat correction.
ALTERNATE HOURLY ELLIOTT WAVE COUNT
Click chart to enlarge.
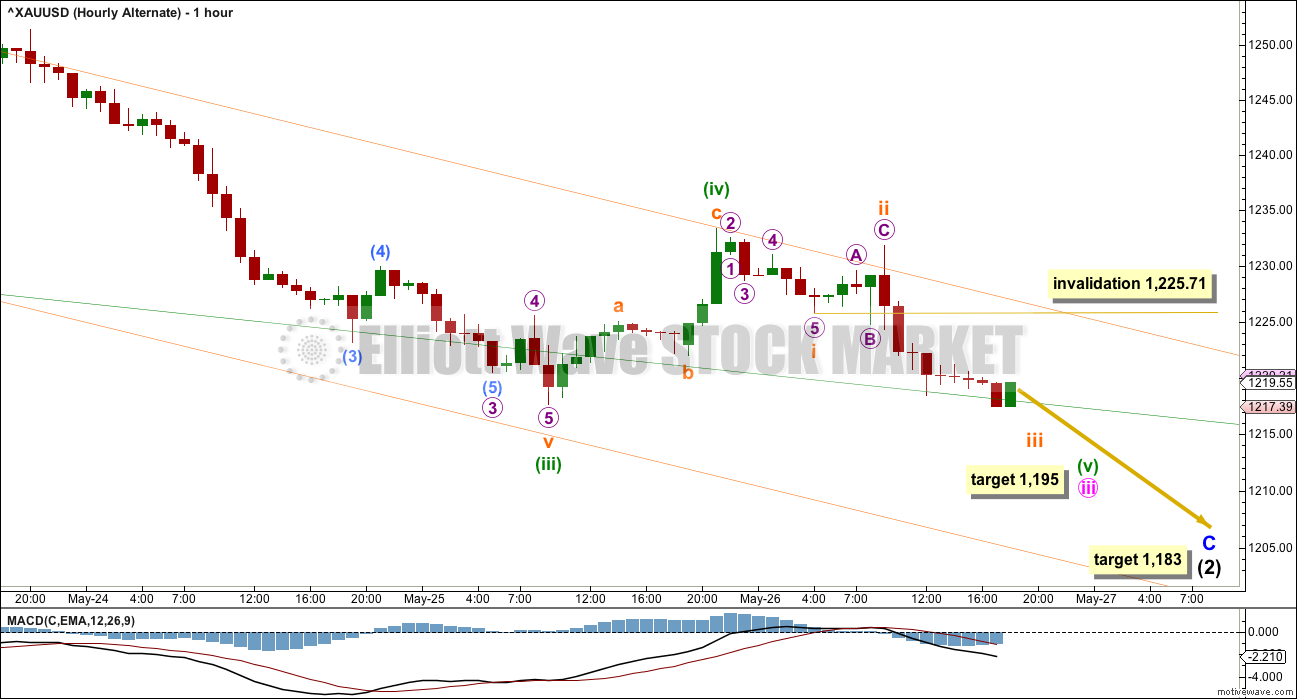
Because there may be a swift strong fifth wave down waiting in the wings, this alternate must be considered. It is still possible although I judge it to have a low probability (20%). Low probability does not mean no probability.
If minuette wave (iv) is over already, then it just shows up on the daily chart. This is just acceptable.
If minuette wave (iv) is over already, then there is no alternation between the structure of minuette waves (ii) and (iv); they would both be zigzags. Alternation is a guideline, not a rule. There is alternation in depth: minuette wave (ii) was a very deep 0.82 and minuette wave (iv) would be a very shallow 0.22.
At 1,195 minuette wave (v) would reach equality in length with minuette wave (i).
Within minuette wave (v), subminuette wave iv may not move into subminuette wave i price territory above 1,225.71.
TECHNICAL ANALYSIS
WEEKLY CHART
Click chart to enlarge. Chart courtesy of StockCharts.com.
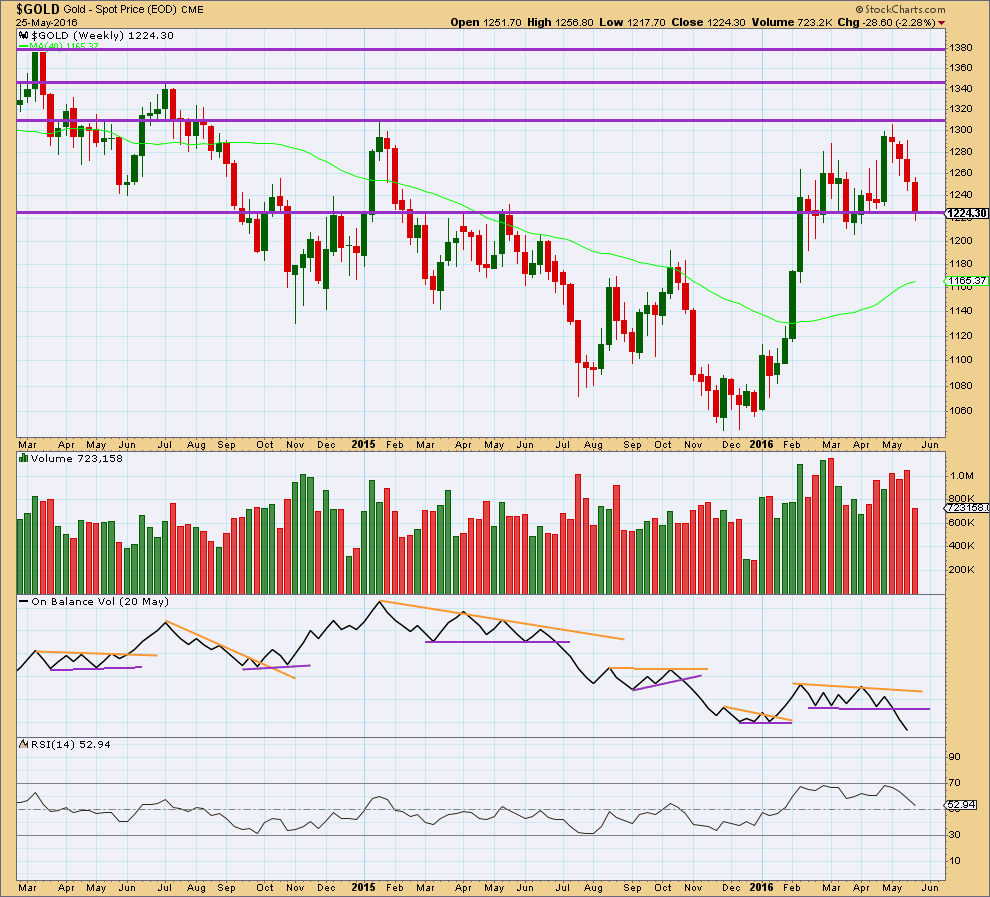
On Balance Volume is breaking below a reasonably long held and clearly defined consolidation zone. It would be entirely reasonable to expect price to follow by continuing lower for a few weeks. This piece of evidence strongly supports the Elliott wave count.
Price has found resistance at the horizontal line about 1,310. The first support line may be about 1,225. Now that price has closed below this point it may provide resistance.
At the end of last week, overall, volume has been increasing on downwards movement from price for three weeks. This also supports the Elliott wave count.
Last weekly candlestick completes a Three Black Crows reversal pattern. Because the pattern is supported by overall increasing volume and it is on the weekly chart, this is a reasonably strong reversal pattern.
DAILY CHART
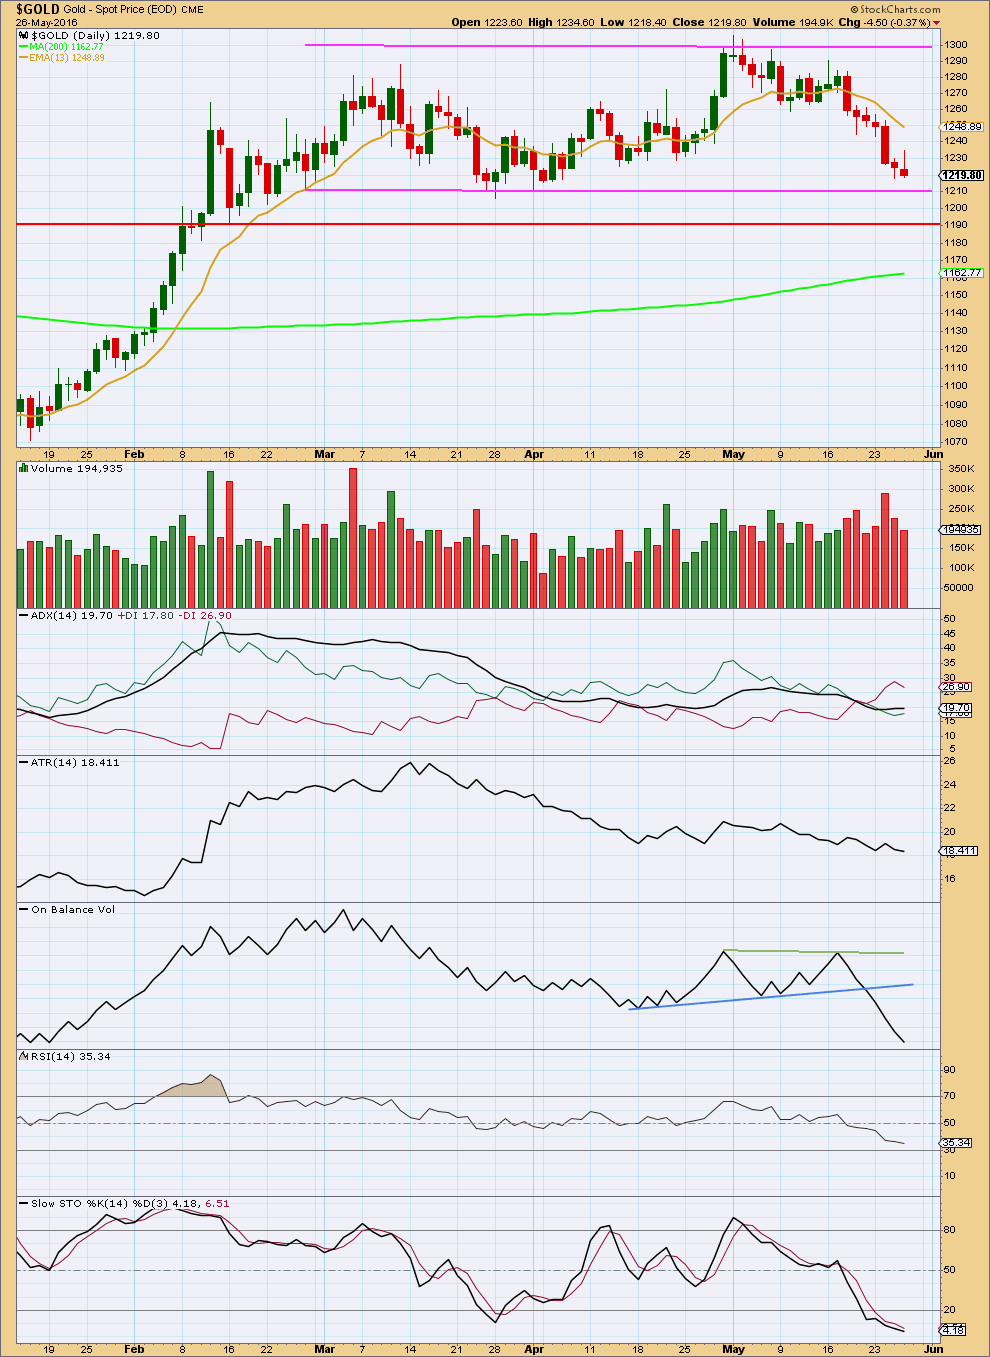
Click chart to enlarge. Chart courtesy of StockCharts.com.
The last two red daily candlesticks come on declining volume. The fall in price is not being supported by volume. Both candlesticks have small real bodies. A pause in downwards movement looks like it is unfolding here. Volume indicates that we may see a red candlestick or doji to resolve this weakness, before price is ready again to continue much lower.
ADX today is flat to slightly rising. It may be indicating a new downwards trend. ATR disagrees; it is declining. Some disagreement between these two indicators in the early stages of a new trend is to be expected. If they begin to agree, then it would be clearer that the market is trending. For now that is not so clear.
On Balance Volume is very clear at both the weekly and daily chart levels. It indicates downwards movement is underway.
RSI is not yet oversold. There is still room for price to fall. Stochastics is oversold, but this oscillator may remain extreme during a trending market for reasonable periods of time.
Along the way down, corrections may find resistance about the 13 day moving average. Look for price to find some support about 1,210 in the next instance. If price breaks below support at that line, then it may throwback to find resistance there.
This analysis is published @ 06:59 p.m. EST.
This is the problem with Gold’s impulses. It’s fourth waves can be quick and shallow.
I can see minuette (iv) over as per the alternate posted below, but I don’t think minute iii is complete. That part of that chart now looks wrong.
Momentum is increasing, there’s no divergence between the last two swing lows on the hourly and MACD. I think this wave down right now is a small third wave.
Gold isn’t behaving nicely with its trend lines. Sometimes it just doesn’t. I’ll have to adjust the analysis accordingly.
Lara any idea how deep minute iii might end up being and may minute iv still be a multiday move?
I’m hoping not too low, enough I only have a little GDX.
If it ends up being much deeper it may make for a cheap miners buy next week then sell at the top of minute iv when the markets top and drop next week?
I think the bullish trades on the way down are risky overnight so I only bought a little GDX.
Target at this stage is 1,195 for minute iii to end.
the trend will remain down until minor C is complete, it has a way to go yet
Yes, Lara. You nailed it.
Together with the main count expecting minute 3 to be complete, and 1234.40 as minute 4, the combination would have been perfect.
Latest cots in and went down to 225 net short from a high of 300. Commercials covering at a good rat so good news is we are probably still in early stages of a bull market. Gdx on edge of 50 day cliff. Since commercials reported Tuesday and net changed about 70k contracts we are probably down around 200k net short now. Expect this correction to end about 150 k contracts short for commercials. This will probably coincide with the market dropping and the masses piling in to gold soon. Have fallen quite a bit so maybe a bounce soon and another hard down knife. Lara may have this right at 1180 or so but might fall quickly under 1150 at which time may be a good buy. Just speculation on my part….leave the hard stuff for Lara;)
The trend obviously is down. Corrections along the way are proving hard to predict.
I’ll be adjusting the alternate which was posted below last night to see minute iii as incomplete.
I think this downwards move is minuette (v) extending.
I was sitting on the sidelines (or rather lying in bed) trying to make something of this movement.
If the alternate is correct, then either minute 4 was over at 1223.63, rather shallow, followed by minute 5 down, or minute 4 is an expanded flat but the B wave is 5 waves which doesn’t seem right.
If the main count is correct, minute 4 was over at 1234.40 and this is followed by minute 5 targeting 1205. This looks to have the better fit, as the drop is clearly 5 waves.
or minuette iii isn’t over
Apologies. I got the last paragraph wrong. I meant minuette 4 and minuette 5 and not minute.
All time frames up to a Month are bearish Sell for Gold and GDX except maybe the 1 minute and the 5 minute MACD but the 5 minute SMA is bearish.
Should of been a sell the the morning high all bullish trades today and buy DUST.
Hi Richard,
You do a great job keeping members aware! Thank you for your efforts!
With gold falling to the 1208’s, what would be your best guess as respects to wave count and forward looking expectations? Do you think the alternate wave count still applies?
DUST was up over 10% today but is starting to come back a bit; up 8.50% as I type.
Again, thanks for your best insight!
Gold didn’t even breach above the hourly orange channel since Thursday noon so at this point I lost track of the count and just a bearish trend with 3 months lows.
Even the 2 plus month of 1210 daily support collapsed, Janet Yellen burnt that bridge at 1:15 pm.
Maybe Lara has something reassuring otherwise holding bullish over a long weekend may be dangerous?
Unless rumour of China collapse is real.
Gold may of held above 1205 at this time?
Janet Yellen today’s speech likely interest rate hike in a couple of months, so gold is at a 3 month low of $1,208.23 at 2:23 pm but how low today and is minute wave iv history? NUGT low 69.16 GDX low 22.17.
Gold dropped $5 fast at this news.
1:36pm Yellen: Probably in the next couple of months, another increase ‘appropriate’
Gold now banging down on 1210 support at 1210.23 at 1:40 pm
Gold may be completing a small 5th wave up now at 1:20 pm unless Janet Yellen already talked and effecting things?
1:20pm U.S. stocks hold slight gains as Yellen begins speaking at Harvard
The 1,210 support since the end of February on daily at pmbull.com held at today’s low of 1,210.46 at 11:09 am.
Hopefully minute wave iv still moves up from here today or Monday to either 1,231 or 1,243 and right through the Janet Yellen speech today at 1:15 pm EST
Any wave counts as I am curious will this move up since 11:09 am low continue today or does gold have to drop anytime soon in a 2nd wave down to the 1,210 area?
Just trying to be helpful….
Yellen is an award recipient today and is not expected to address the economy other than saying the norm…. data dependent, etc…
When reading Lara’s commentary, she mentioned that minute iii may not yet be over yet. If minute iii is not over, this would prolong the days before minute iv is complete.
This next commentary I’m going to mention is truly speculative but I heard an investor specialist (Tom DeMarco) comment that it’s highly likely that that Chinese stock market could drop by as much as 10% and said that it could come as soon as Monday when the US markets are closed. If this is true and it does happen, pressure would be placed on the US markets when things open on Tuesday; gold would most likely be a safe haven play and would wind up supporting Lara’s forcasted wave count. Again, I’m just sharing what I’ve heard. It would also be interesting to know what the wave count looks like for the S&P?
Interesting. I have the S&P topping today, right at a bear market trend line (slight overshoot) and so far right on target.
I will be looking for weakness in it’s upwards wave and if I see any I’ll be expecting a big drop Tuesday.
I notice also that Shanghai has been trending lower since 13th April, it seems to be leading the pack in this instance.
I’m expecting with a hard fall in equities $$ will flood into Gold and push it up. The timing is proving tricky… but that’s the expectation. At this stage next week for it to all begin
Thanks for your insight Lara. Your comments are always very appreciated.
Enjoy your weekend.
I think I hear the surf calling you to catch some waves for a break from Elliott Waves.
Gold dropped below overnight low of 1211.64 at 10:40 pm down to 1210.46 at 11:09 am would that change Lara’s wave count?
Gold is also at critical lower limit of support of 1210.
Might gold hold here then move higher today is this drop likely over for now?
US Dollar has been going up since the 8:30 am US news.
Also had bullish US dollar again move up with bullish US dollar 10:00 am US news.
http://ca.investing.com/quotes/us-dollar-index-streaming-chart
FRIDAY, MAY 27 US news
8:30 am GDP revision 1Q 0.9% 0.5%
10:00 am Consumer sentiment May 95.0 95.8
Double whammy for me today. Sold DUST in pre-market and purchased NUGT. This is all part of trading.
I realize that Minute iii isn’t confirmed to be complete yet, but do you have any thoughts on the expected time it would take for Minute iv to be completed?
FYI… US Markets are closed on Monday.
Lara May 27, 2016 at 12:44 am
“When minute iv is complete in a day or two”
Unfortunate double whammy, I was lucky to only be holding a little GDX and basically on the fence just watching in shock and awe today.
Any wave counts?
Is the low of $1,213.31 at 10:20 am the bottom of a B wave down since 1223.63 am high and now a C wave can move up towards either 1231 or 1243?
I have some MACD longer time frames for gold and NUGT that are bearish, which concerns me that today may be a long bearish day.
Is Lara’s confirmation of $1,225.71 for gold to move higher no longer required?
Janet Yellen speech 1:15 PM EST today on US long weekend.
Waiting for Yellen: The Fed chief pays a high-profile visit to Harvard University on Friday, where she’s scheduled to deliver a speech at 1:15 p.m. Eastern Time. Investors are eager to hear any views on the interest rate outlook, after a week of hawkish comments from prominent Fed members.
Earlier this month, minutes from the U.S. central bank’s April meeting took markets by surprise by indicating a rate increase in June is still on the table.
The ICE dollar index DXY, +0.35% was up 0.2% to 95.335 ahead of Yellen’s appearance.
The 8:30 am US news dropped gold back down to 1215.
Hopefully the count down from there is finished soon and gold will move much higher early during market hours.
Is the new Lara chart at 3 am today still in play with gold moving gold back up to either 1,231 or 1,243?
Lara,
How do you enlarge these charts to view? Clicking on them does not work and also right click no response.
Thanks for excellent analysis.
Right click then click on
“Open image in new tab”
Then go to the tab that opened enlarged image at a new link/web address.
Just in case anyone misses this (posted below).
It’s possible minute iii could be over. Minute iv may have started.
Please see comments below for more information.
If gold does go up then do we reduce $8 from the $1,233 target because gold dropped from 1,220 when lara wrote the analysis down to 1,212, when is $8 lower?
“If subminuette wave b does not move any lower, then the target for subminuette wave c will be at 1,233 for it to reach equality in length with subminuette wave a.”
Apparently not. See Lara’s new main hourly chart below.
GDX confluence of support
Hello Lara,
With gold dropping to 1211 and change early this evening (10:40 pm), I couldn’t help but ask for your thoughts.
As always, thanks for your commentary!
It’s possible that the alternate is in play and Minute 3 may be complete, short of the target. We may now get a significant retrace up for Minute 4.
Exactly.
Alternate chart updated.
Minute ii was a deep 0.76 zigzag. Minute iv may be most likely shallow.
The 0.236 and 0.382 Fibonacci ratios are both reasonable targets, equally as likely (even though my arrow is at the 0.382, I don’t favour it).
The invalidation point has to move now. Minute iv may not move into minute i price territory.
Minute iv is most likely to be a sideways flat, combination or triangle.
The trend is down, but now it looks like the last fourth wave correction has arrived earlier than anticipated.
The final target at this stage remains at 1,183.
The alternate now due to structure has a better look than the main, so now at this stage I’d be expecting a green candlestick or doji for Friday’s session.
The main wave count now has a B wave which looks like a five down… that’s not right.
When minute iv is complete in a day or two then I can calculate the final target at two wave degrees. At that stage it may widen to a zone or it may change.