
The main Elliott wave count expected downwards movement to a short term target at 1,195.
Downwards movement has continued to a low for the session at 1,200.07.
Summary: The trend is still down. A final fourth wave correction along the way down has begun. It may last another one to three sessions and may end about 1,222 or 1,236. When the correction is complete, a final fifth wave down to a target at 1,183 would complete the structure.
New updates to this analysis are in bold.
To see last weekly charts click here.
DAILY ELLIOTT WAVE COUNT
Click chart to enlarge.
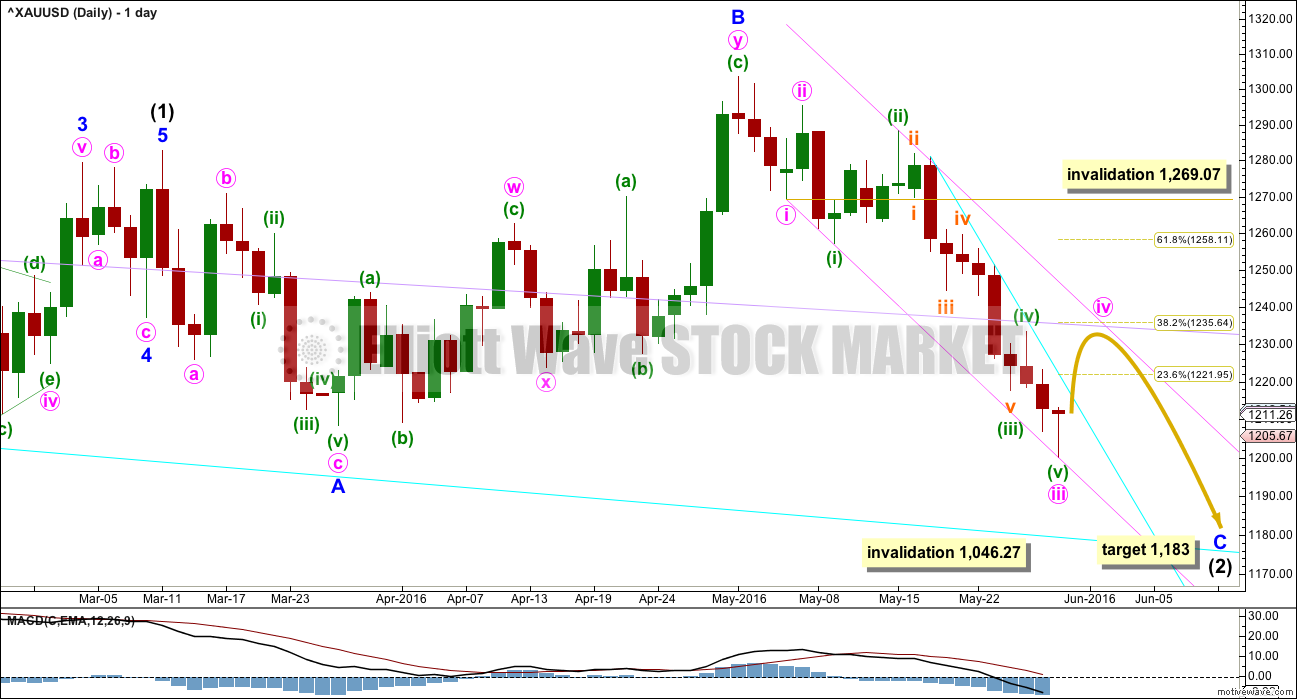
Intermediate wave (2) is not over.
Normally, the first large second wave correction within a new trend is very deep, often deeper than the 0.618 Fibonacci ratio.
Intermediate wave (2) may be an expanded flat correction. Minor wave A is a three, minor wave B is a three and a 1.28 length of minor wave A. This is within the normal range of 1 to 1.38.
At 1,183 minor wave C would reach 1.618 the length of minor wave A. This would be the most likely target. If price keeps falling through this first target, then the second target would be at 1,108 where minor wave C would reach 2.618 the length of minor wave A.
Intermediate wave (2) may not move beyond the start of intermediate wave (1) below 1,046.27.
There are two structural options for minor wave C: either an impulse or an ending diagonal. Minor wave C does not look at this stage like an ending diagonal. It looks like the more common impulse.
Minute waves i, ii and now iii look complete within the impulse of minor wave C. Minute wave iv should show up at the daily chart level, so that minor wave C has a five wave look to it. Minute wave ii lasted just over one day. Minute wave iv may last one to four sessions for the wave count to have the right look.
Minute wave iv may not move into minute wave i price territory above 1,269.07.
Draw a channel about minor wave C as shown in pink: the first trend line from the ends of minute waves i to iii, then a parallel copy on the high labelled minuette wave (ii) so that all downwards movement is contained.
Minute wave iv may find resistance at the upper edge of the pink channel. It may also find resistance at the lilac trend line copied over from the weekly chart, if it gets that high.
In the first instance, to confirm the end of minute wave iii, the cyan trend line needs to be breached. The strong hammer candlestick pattern for the session of 30th of May suggests a low is in place at least short term, particularly as it occurs about the round number pivot of 1,200. For this reason, I expect minute wave iii is over and minute wave iv has arrived.
HOURLY ELLIOTT WAVE COUNT
Click chart to enlarge.
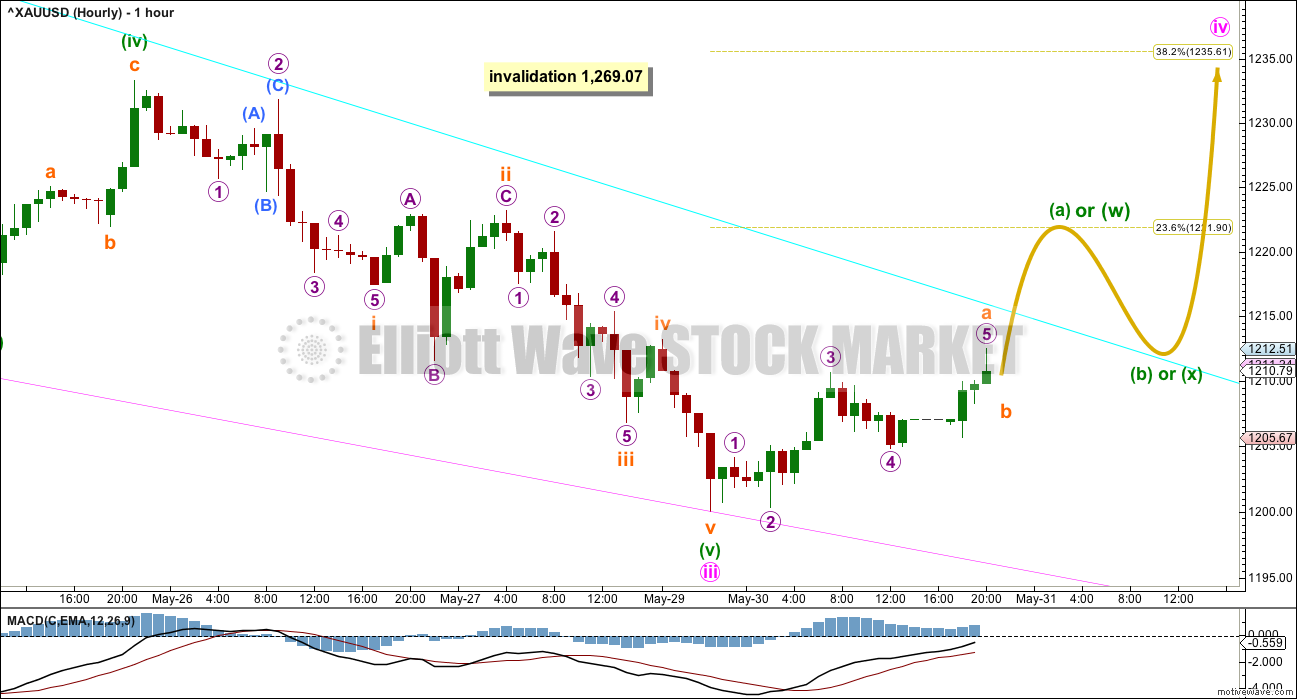
The structure of minute wave iii is complete. Minute wave iii is 5.11 longer than 2.618 the length of minute wave i.
There are no adequate Fibonacci ratios between minuette waves (i), (iii) and (v) within minute wave iii.
Ratios within minuette wave (v) are: subminuette wave iii is just 0.34 longer than equality in length with subminuette wave i, and subminuette wave v has no Fibonacci ratio to either of subminuette waves i or iii. There is alternation between the shallow 0.36 expanded flat of subminuette wave ii and the shallow 0.39 zigzag of subminuette wave iv. All subdivisions now fit perfectly.
Minute wave ii was a quick deep 0.76 zigzag lasting 23 hours. Given the guideline of alternation, minute wave iv is most likely to be a shallow sideways structure and may be more time consuming than 23 hours. Minute wave iv is most likely to be a flat, combination or triangle. It is most likely to end about either the 0.236 or 0.382 Fibonacci ratios, so targets at 1,222 and 1,236 are reasonable.
If minute wave iv unfolds as an expanded flat (which is a very common structure), running triangle or combination, then it may include a new low below its start at 1,200.07. A new low below this point in the next one or two sessions does not mean minute wave iv is over; it would more likely be a part of minute wave iv.
TECHNICAL ANALYSIS
WEEKLY CHART
Click chart to enlarge. Chart courtesy of StockCharts.com.
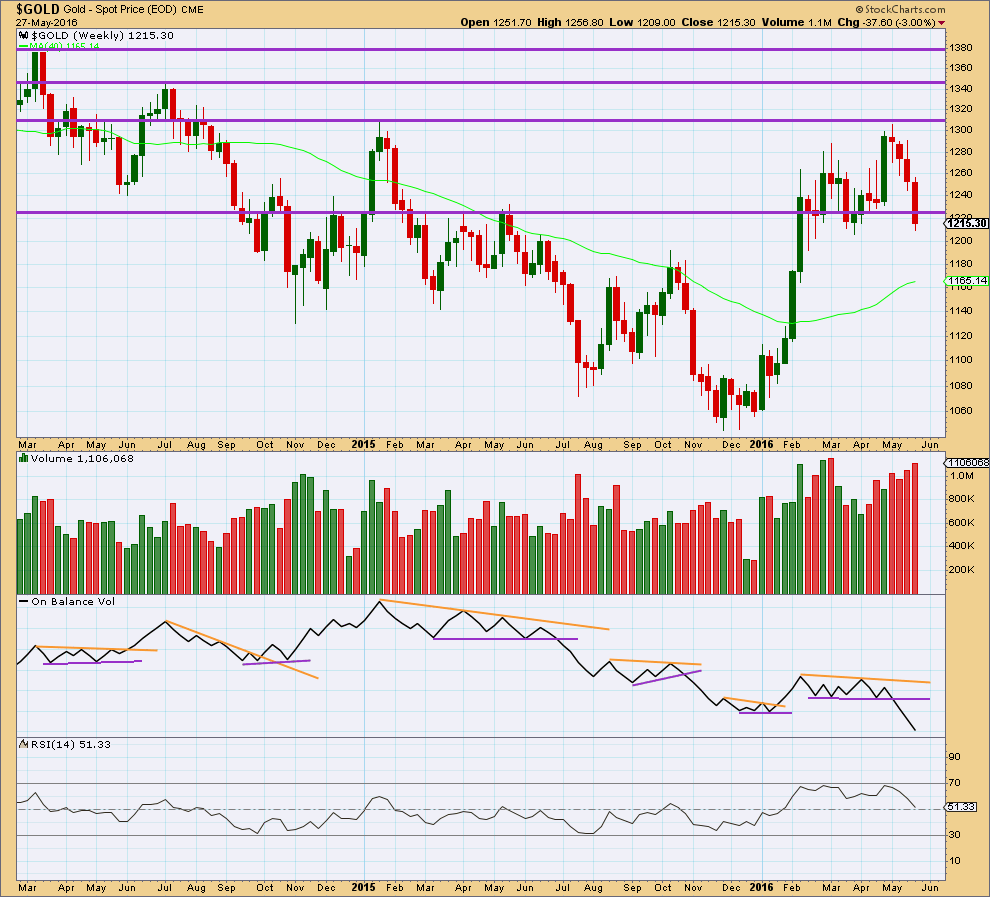
On Balance Volume is breaking below a reasonably long held and clearly defined consolidation zone. It would be entirely reasonable to expect price to follow by continuing lower for a few weeks. This piece of evidence strongly supports the Elliott wave count.
Price has broken below and closed below support about 1,225. Price has fallen on increasing volume for four weeks in a row. This supports a downwards trend.
RSI is neutral. There is plenty of room for price to fall.
DAILY CHART
Click chart to enlarge. Chart courtesy of StockCharts.com.
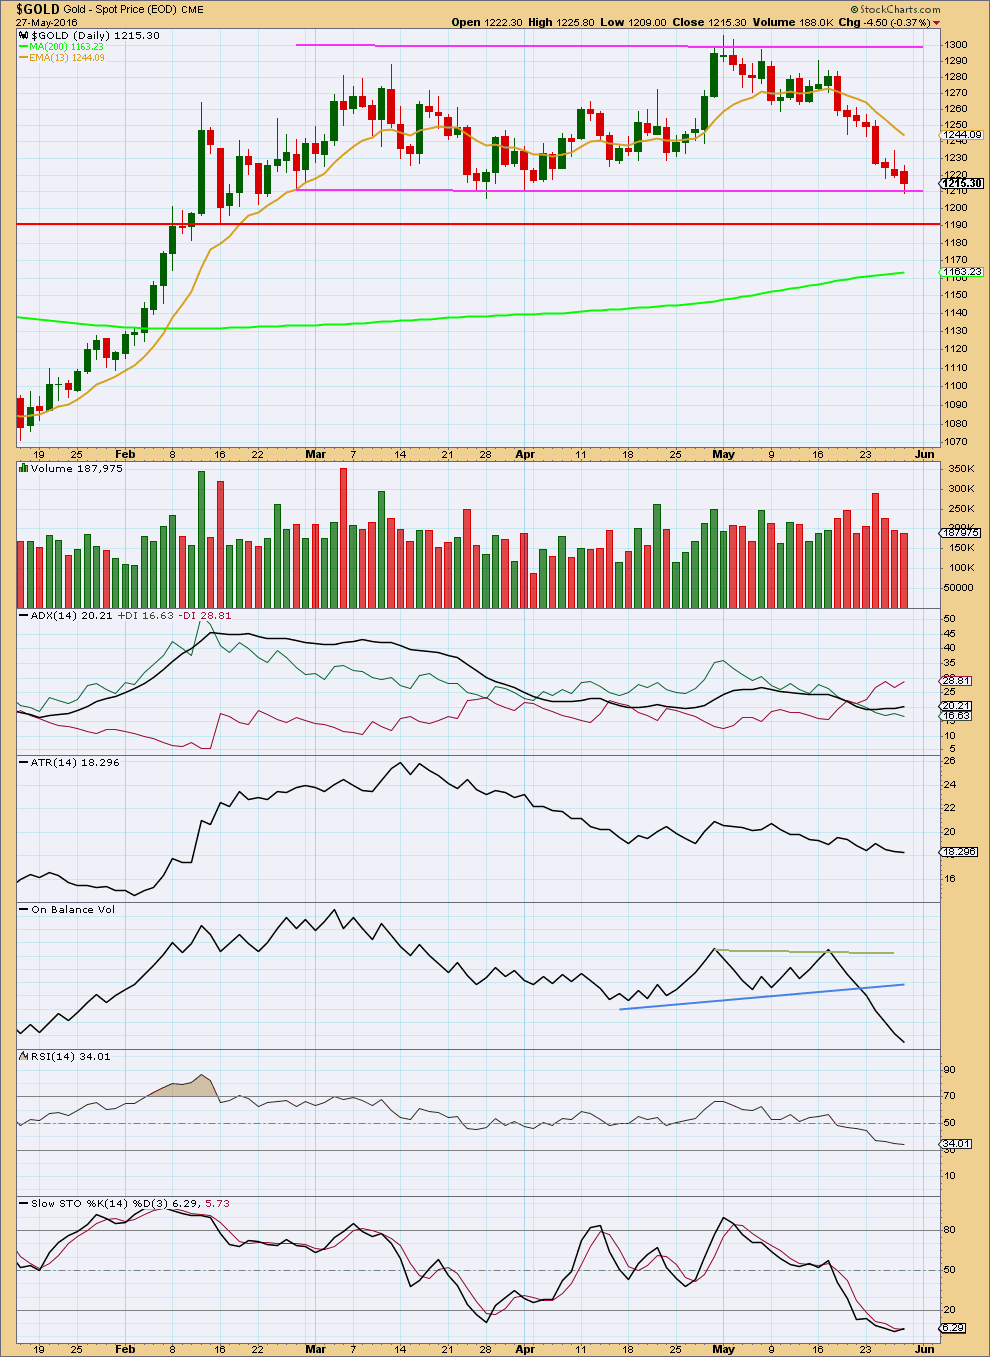
StockCharts data is NY session only, so there is no update in their data for the Gold cash market today.
The hammer candlestick at the round number pivot of 1,200 has been noted (seen on COMEX data for the daily Elliott wave count, not seen on StockCharts data). This in conjunction with weakness seen at the end of last week now strongly suggests a consolidation to unfold about here.
In the short term, it looks like this downwards trend is weakening. Price has moved lower for the last three days but on declining volume. This fall in price is not supported by volume. Price may find some support here about 1,210.
ADX indicates there is a trend and it is down. ATR still disagrees as it is declining. This disagreement at this stage of downwards movement indicates this move may be a counter trend movement. This supports the Elliott wave count.
On Balance Volume continues to agree with downwards movement from price.
RSI is not yet extreme. There is further room for price to fall.
Stochastics is oversold and shows slight divergence with price for Friday. Stochastics moved slightly higher while price made a new low on Friday. This indicates weakness to downwards movement.
On balance, it seems clear that there is a downwards trend, but a small pause for some consolidation may be expected to unfold about here.
This analysis is published @ 10:04 p.m. EST.
Updated hourly chart.
There is a beautiful channel about minuette (a) or (w). Drawn using Elliott’s technique for a correction. When this orange channel is breached to the downside it will confirm the end of minuette (a) or (w) and the start of minuette (b) or (x).
Good morning every body. Nice to see this market also behaving itself for us today.
So far I can see a three up, a zigzag. Now for a three down. How low this goes will begin to hopefully narrow down the various possible structures of minute iv.
This three down can make a new low if minute iv is to be an expanded flat (very common structures) or a running triangle. Or a combination.
It could be shallow if minute iv is to be a double zigzag, but that’s less likely. Still possible though.
Now to calculate some figures…
If minute iv is to be a flat then the next wave down for minuette (b) has a minimum requirement of 0.9 X minuette (a) = 1,201.86
If minute iv is to be an expanded flat then minuette (b) minimum = 1.05 X minuette (a) = 1,199.17
If minute iv is to be a flat then the normal range for minuette (b) = 1 – 1.38 X minuette (a) = 1,200.07 – 1,193.26
If minute iv is to be a triangle there is no minimum nor maximum, the downwards wave only must subdivide as a three. Ditto for a combination.
These figures rely on minuette (a) being complete. If it moves higher then all these figures change.
Hi. Very nice when the markets behave — I agree.
Think there is an edit here and the sentence should read ….
If minute iv is to be a /\flat/\ (zigzag) then the normal range for minuette (b) = 1 – 1.38 X minuette (a) = 1,200.07 – 1,193.26
If I’ve got it wrong please let me know.
NUGT topped today at 2:07 pm and gold topped at 3:14 pm only up 22 cents above 2:08 pm price.
Gold is moving up maybe in a 5th wave it may be a sell when it peaks today as next is a drop shallow or deeper.
It might reach 1222 today as getting stronger since 1:10 pm.
Lara may clarify and maybe another low after today to buy it cheaper or chance that 1222 maybe the top before drops much deeper.
This correction certainly has the look and feel of a v so far.
Lara, I’m curious if you have any thoughts on a bullish alternate, in that Intermediate wave 2 could be over?
I’ve been picking up some longer dated OTM calls, especially on the dip last Friday/Monday, however, I’m not at all fully loaded, and would love lower prices.
Interesting that the falling wedge gold broke out of in January has an upper line retest point of about 1160-1170.
correction above “look and feel of a iv” (not v)
The structure of minor C still looks incomplete. It needs one final fifth wave to complete it. Trying to make a bullish wave count would be forcing it.
It looks like subminuette wave b ended at 1,208.42 at 9:36 am and now gold may be in wave 5 up of subminuette wave c with a possible target of 1,222?
Any comments or wave counts?
It appears gold finally breached the cyan trend line at 11:00 am to 12:00 pm, the 1st full hourly candlestick above it.
“In the first instance, to confirm the end of minute wave iii, the cyan trend line needs to be breached.”
Hi Lara, please update GDX when you get a chance. Thanks!
Will do. Probably tomorrow or the day after. I will not have time today.
GUNNER24 GOLD_ Just the crude hard facts, dear Gold-Bull May 29th
http://www.gunner24.com/newsletter/nl-052916/