
Upwards movement was expected for Tuesday, which is exactly what happened.
Summary: The trend may still be down although classic technical analysis indicates a low may be in place. A final fourth wave correction may last another one to three sessions and may end about 1,222 or 1,236. When the correction is complete, a final fifth wave down to a target at 1,183 would complete the Elliott wave structure.
New updates to this analysis are in bold.
To see last weekly charts click here.
DAILY ELLIOTT WAVE COUNT
Click chart to enlarge.
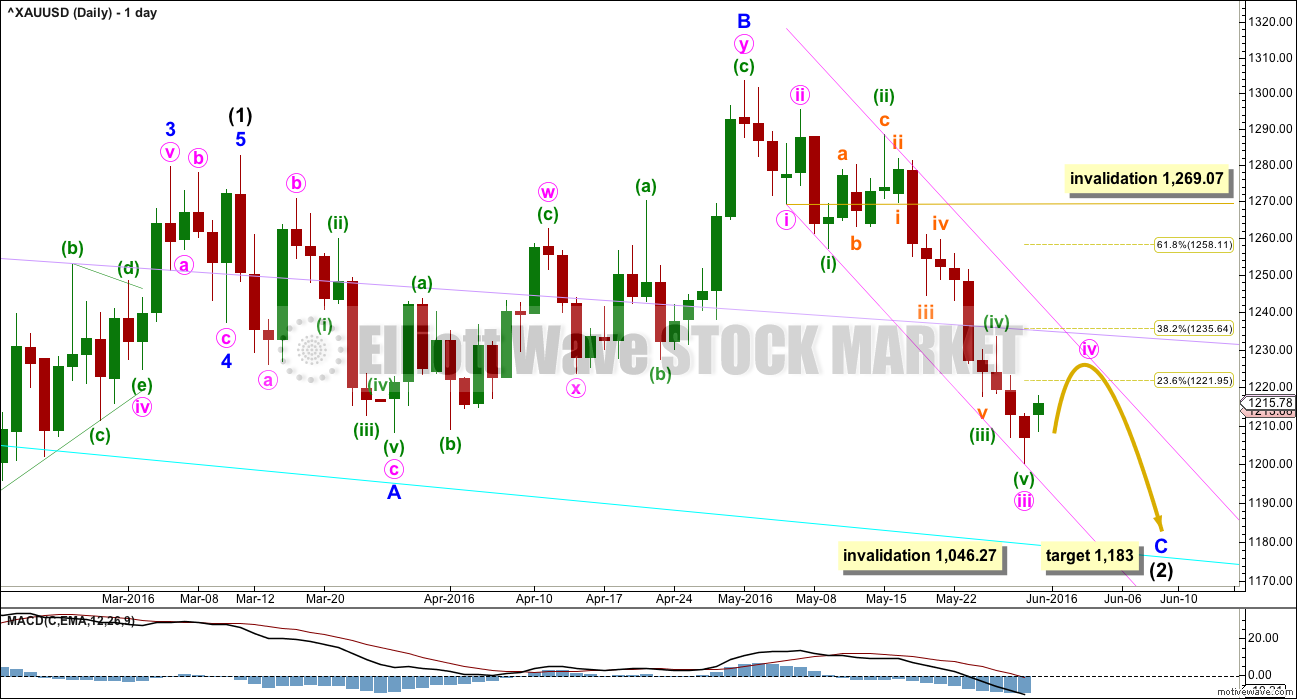
Intermediate wave (2) is not over.
Normally, the first large second wave correction within a new trend is very deep, often deeper than the 0.618 Fibonacci ratio.
Intermediate wave (2) may be an expanded flat correction. Minor wave A is a three, minor wave B is a three and a 1.28 length of minor wave A. This is within the normal range of 1 to 1.38.
At 1,183 minor wave C would reach 1.618 the length of minor wave A. This would be the most likely target. If price keeps falling through this first target, then the second target would be at 1,108 where minor wave C would reach 2.618 the length of minor wave A.
Intermediate wave (2) may not move beyond the start of intermediate wave (1) below 1,046.27.
There are two structural options for minor wave C: either an impulse or an ending diagonal. Minor wave C does not look at this stage like an ending diagonal. It looks like the more common impulse.
Minute wave iv has begun and so far shows up on the daily chart with one green candlestick. It is likely to be longer lasting than this; the structure on the hourly chart is most likely incomplete.
Minute wave iv may not move into minute wave i price territory above 1,269.07.
Draw a channel about minor wave C as shown in pink: the first trend line from the ends of minute waves i to iii, then a parallel copy on the high labelled minuette wave (ii) so that all downwards movement is contained.
Minute wave iv may find resistance at the upper edge of the pink channel. It may also find resistance at the lilac trend line copied over from the weekly chart, if it gets that high.
MAIN HOURLY ELLIOTT WAVE COUNT
Click chart to enlarge.
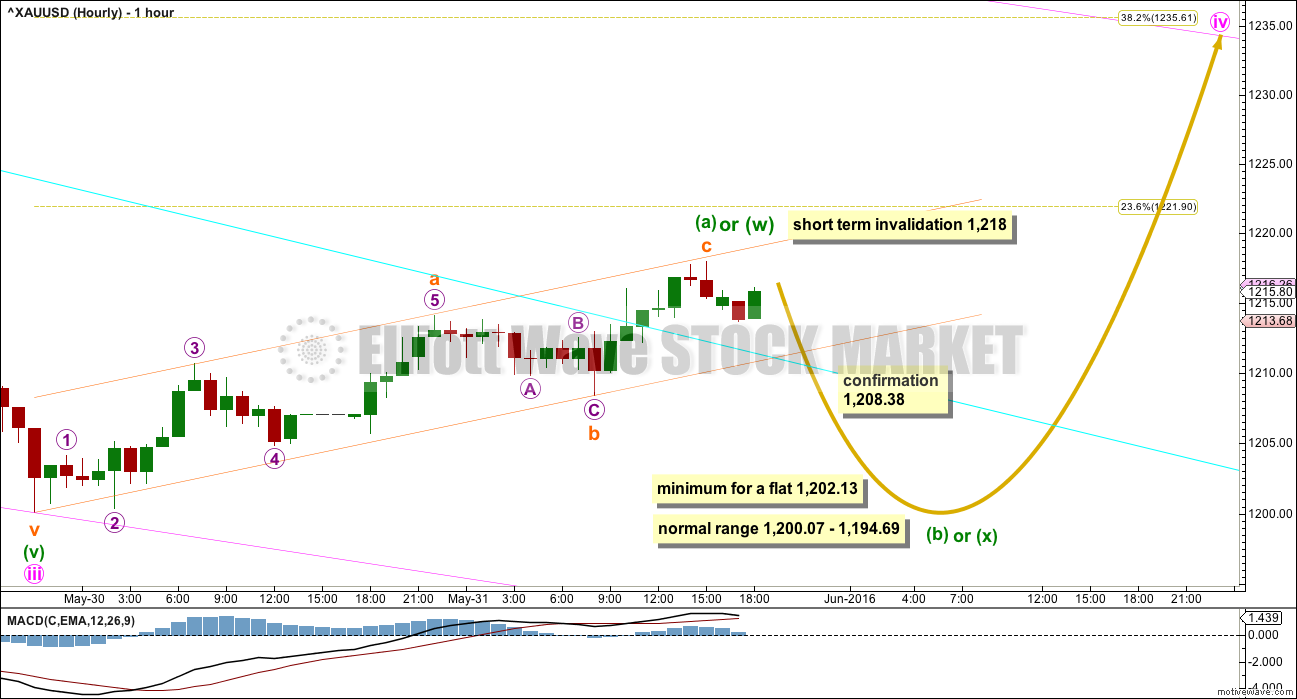
Minute wave ii was a quick deep 0.76 zigzag lasting 23 hours. Given the guideline of alternation, minute wave iv is most likely to be a shallow sideways structure and may be more time consuming than 23 hours. Minute wave iv is most likely to be a flat, combination or triangle. It is most likely to end about either the 0.236 or 0.382 Fibonacci ratios, so targets at 1,222 and 1,236 are reasonable.
If minute wave iv unfolds as an expanded flat (which is a very common structure), running triangle or combination, then it may include a new low below its start at 1,200.07. A new low below this point in the next one or two sessions does not mean minute wave iv is over; it would more likely be a part of minute wave iv.
At this stage, there are still multiple structural possibilities for minute wave iv. Alternate wave counts and flexibility while this correction unfolds will be essential. It is impossible to tell with certainty which structure will unfold, so it is impossible for me to give you an accurate road map for how price will move during this correction. Small corrections do not present good trading opportunities; they should be avoided. They present an opportunity to join the trend at their completion, so analysis over the next one to few days will focus on identifying if minute wave iv could be complete and what price points will confirm its completion.
So far a zigzag upwards may be complete. This is most likely minuette wave (a) of a flat or triangle, or minuette wave (w) of a double combination.
If minute wave iv is a flat correction, then the normal length of minuette wave (b) is 1 to 1.38 the length of minuette wave (a). This gives a normal range of 1,200.07 to 1,194.69.
If minute wave iv is a flat correction, then the minimum requirement for minuette wave (b) is to retrace 0.9 the length of minuette wave (a) at 1,202.13.
If minute wave iv is a triangle, there is no minimum nor maximum for minuette wave (b); it must only be a three wave structure. It may make a new low below the start of minuette wave (a) at 1,200.07 as in a running triangle.
If minute wave iv is a double combination, then the first structure in the double may be a complete zigzag. Minuette wave (x) has no minimum nor maximum requirement; it must only be a corrective structure and would most likely be deep.
A new high short term above 1,218 would invalidate this main hourly wave count and confirm the alternate below. A breach of the orange channel by downwards movement would add confidence to this main wave count.
Although there is a complete zigzag upwards, I am not publishing a wave count which sees this as minute wave iv complete in its entirety. That would provide little alternation with the zigzag of minute wave ii; both minute waves ii and iv would be single zigzags. It would also see minute wave iv very brief. It is more likely to be more time consuming than this.
ALTERNATE HOURLY ELLIOTT WAVE COUNT
Click chart to enlarge.
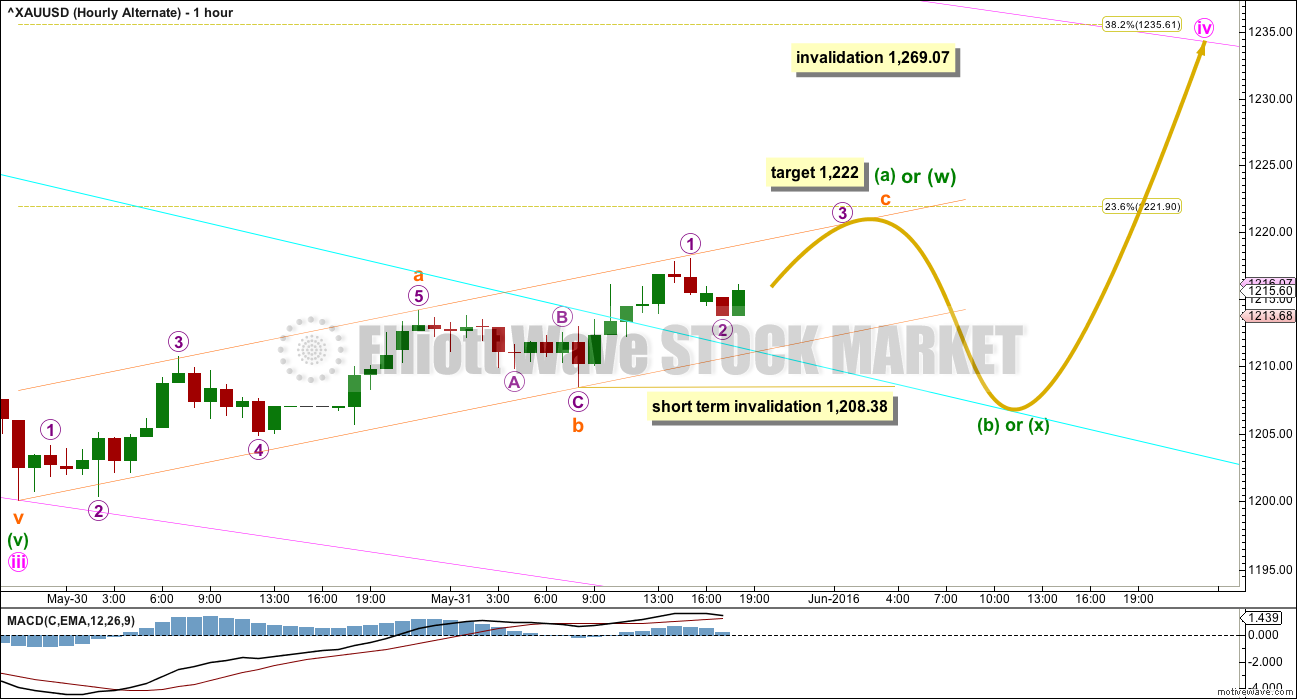
It is also possible that the zigzag upwards is incomplete. Price remains within the small channel which is nicely showing where price is finding resistance and support along the way up.
If the zigzag upwards is incomplete, then within subminuette wave c micro wave 2 may not move beyond the start of micro wave 1 below 1,208.38.
At 1,222 subminuette wave c would reach equality in length with submineutte wave a. Along the way up, a new high above the end of micro wave 1 at 1,218 would confirm this alternate.
TECHNICAL ANALYSIS
WEEKLY CHART
Click chart to enlarge. Chart courtesy of StockCharts.com.
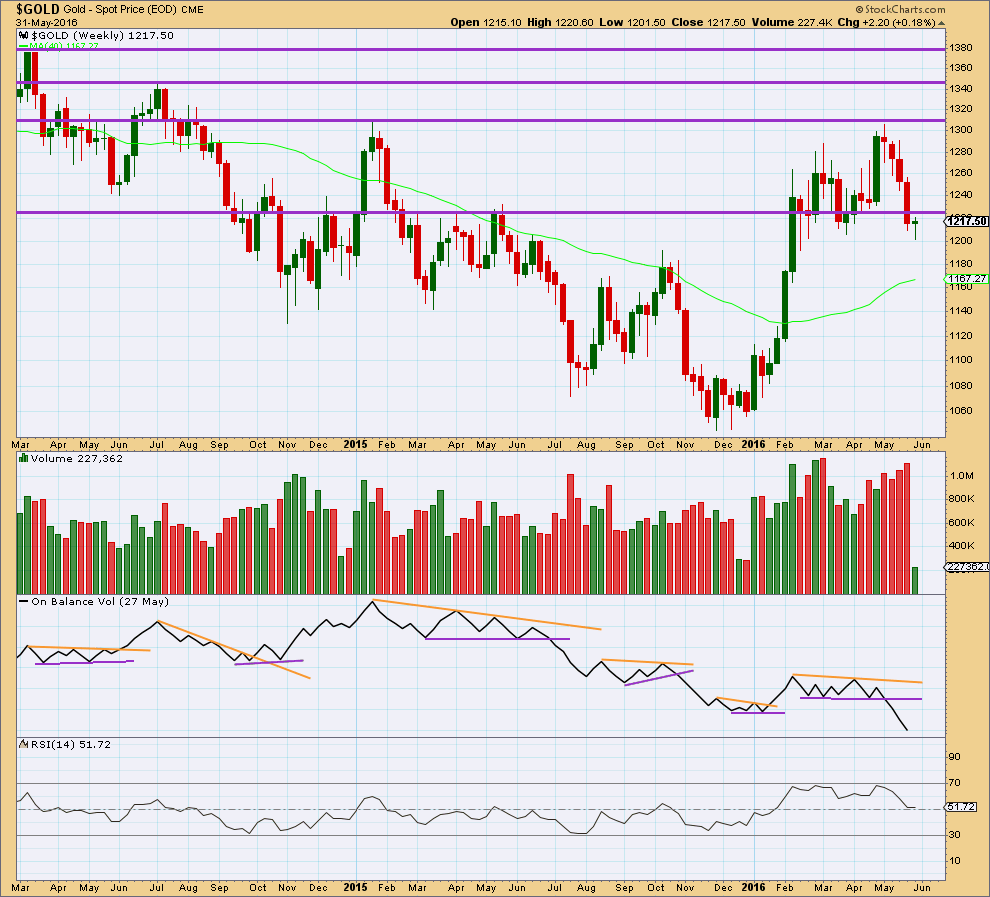
On Balance Volume is breaking below a reasonably long held and clearly defined consolidation zone. It would be entirely reasonable to expect price to follow by continuing lower for a few weeks. This piece of evidence strongly supports the Elliott wave count.
Price has broken below and closed below support about 1,225. Price has fallen on increasing volume for four weeks in a row. This supports a downwards trend.
RSI is neutral. There is plenty of room for price to fall.
DAILY CHART
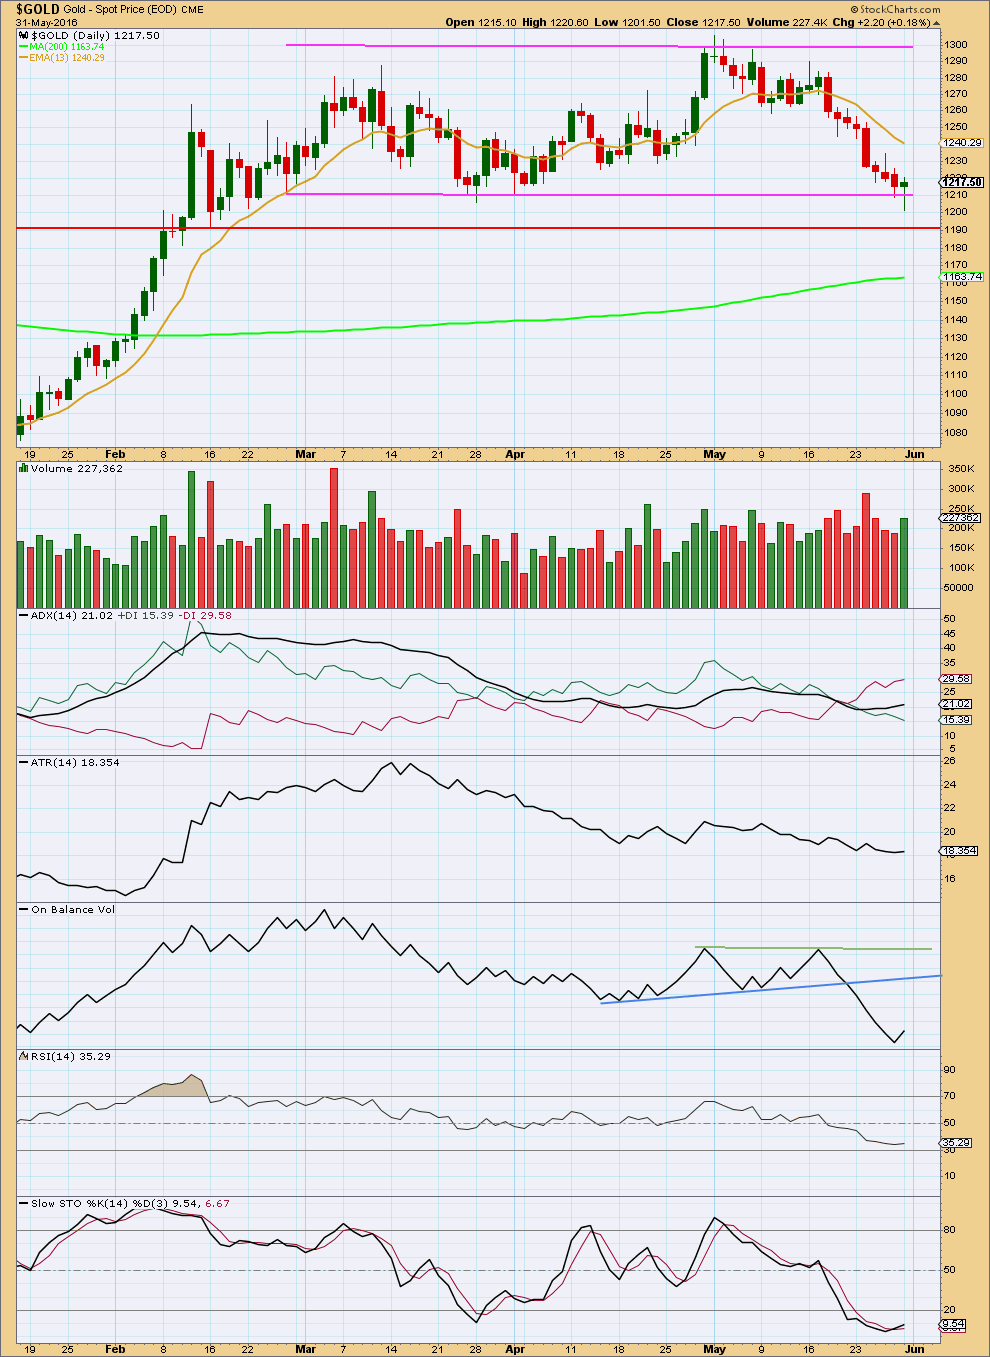
Click chart to enlarge. Chart courtesy of StockCharts.com.
Today’s candlestick on StockCharts data completes a green hammer reversal pattern. With volume supporting the rise in price today, the reversal implications of this pattern are reinforced. At this stage, it looks like a low is in place at support.
ADX is still indicating a downwards trend is in place, but this is a lagging indicator. If a downwards trend is still in place, then price should find resistance about the 13 day moving average.
ATR is still flat to declining. This indicates the downwards movement from price is more likely to be a counter trend movement than a sustainable downwards trend.
On Balance Volume has no nearby trend lines to offer support or resistance.
RSI is not extreme and exhibits no divergence with price.
Stochastics is oversold so should be expected to return to normal. However, during a trending market this oscillator may remain extreme for periods of time. There is divergence at the low: price made a new low for the last two days yet Stochastics has moved up for two days. This supports the idea that a low is in place.
Overall, it looks like there may be a low in place. I have not yet been able to resolve the structure of minor wave C though; I cannot see it as complete. This will be what I will be working on over the next few hours. If I can see a solution which meets all Elliott wave rules, I will publish it. For now it looks like there has either been a trend change or this upwards movement may still be a correction with a final low yet to be made.
This analysis is published @ 07:37 p.m. EST.
Lara:
Are we in subminuette b finishing around here with c wave yet to go down to complete (b)
Alternate hourly wave count is invalidated. Look for 1202 to 1194 target per main hourly count.
The short term invalidation of 1208.38 no longer applies to the alternate as gold moved up higher almost to 1222.
Main hourly is still invalidated.
That means need new wave counts in hourly time frame???
Thanks for correcting.
Invalidation was matured only till the completion of A wave…1208 was breached after the completion of wave A…so main was invalidated not the alternate
Good morning. It means the target of 1,222 for the alternate hourly was a bit low.
My guess for .618 retrace low of wave (b) is at *** $1,207.82 *** that may be the buying point today.
1199.86 low 9:15 pm 5/29 as per pmbull.com
– 1220.54 high 8:18 am today
= 20.58
x .618
= 12.72
1220.54
– 12.72
= 1,207.82 is .618 possible Retrace target my guess.
Any comments or alternates?
Since the morning high of 1,220.54 at 8:18 am EST is gold now in a 4th wave down then head up to 1222 or has it been in a (b) wave down since 1,220.54?
How low could this (b) wave go down to?
Lara’s chart show the 1,205 area but no target amount given?
Gold just dropped hard at 10:00 am almost $4 in 1 minute.
Hi Lara,
I am new to your service so please forgive me if I am going over old ground. I have had a look through your recent gold and S&P 500 reports and notice that, whilst the S&P 500 reports have long term projected targets, the gold reports are very short term. Is this because the situation from your analysis is currently unclear for gold?
I have followed a number of classical analysts on gold and there seems to be a lot of disagreement at the moment which suggests an inflection point. However, virtually all of them long term are predicting much higher gold prices. Disturbingly, this agrees with my fundamental analysis of macro-economic trends.
Your thoughts on longer term direction would be interesting.
Lara does have weekly analysis which is noted in the beginning of the daily analysis with a link”To see last weekly charts click here.”
which is longer than daily and hourly charts that come out daily. Also on the right side column there is a notation for some very long gold charts that cover several years in the past and future. It think they cover grand supercycles.
Thanks Richard.
It’s because I can’t calculate a target for super cycle (b) until I know where cycle a and b within it are.
Super cycle (b) may make a new high above 1,920.18. It is likely to be very deep. That’s all that can be said about it at this stage.
Great. Confirms what I suspected. Thanks for the response.
When gold reaches a 5 count up to about the 1222 target to complete an (a) wave then it may drop down to complete a (b) wave before a possible (c) wave at the 1236 area?
Lara, I believe one of these sentences needs an edit. Not sure which one:
‘If minute wave iv is a flat correction, then the normal length of minuette wave (b) is 1 to 1.38 … ‘
“If minute wave iv is a flat correction, then the minimum requirement for minuette wave (b) is to retrace 0.9… “
No, thats what I meant to say.
For a flat the B wave first has to reach a minimum 0.9 length of the A wave.
After that it can reach into “normal” range. Which is not the same as the minimum requirement.
Thanks for clarifying that for me 🙂
I think the confusion is with the first sentence. At 1.05 of the (a) wave, the (b) wave will then make the flat “expanded”.
Yes, that’s correct.
I’ll rewrite it today to try and make it clearer.
Interesting that classic technical analysis indicates a low may be in place. But the Elliott wave structure has the low target as $1,183.
I know. I’m not happy with it.
So far I haven’t found a solution. But I’m working on it.
The Main Hourly wave count is now short term invalidated above $1,218 at 8:29 pm EST and gold then reached $1,220.02 at 9:40 pm.
It no longer looks like gold is heading for 1,202.13 to 1,194.69.
I believe we now use the Hourly Alternate chart with a target of $1,222 to complete an (a) wave then gold may drop down in a (b) wave before heading back up to 1,236.
“A new high short term above 1,218 would invalidate this main hourly wave count and confirm the alternate below.”
Yes. Minuette (a) or (w) isn’t complete yet. More upwards movement.