
Price moved lower as yesterday’s Elliott wave count expected.
Summary: The correction is incomplete. The target is either 1,278 or 1,263, with the lower target slightly more likely. The correction may end in one more day. This correction presents an opportunity to join the upwards trend. Risk is at 1,237.97. Do not invest more than 3-5% of your equity on any one trade, and always use a stop loss order. The target for the next wave up remains at 1,477.
New updates to this analysis are in bold.
Last published weekly chart is here.
DAILY ELLIOTT WAVE COUNT
Click chart to enlarge.
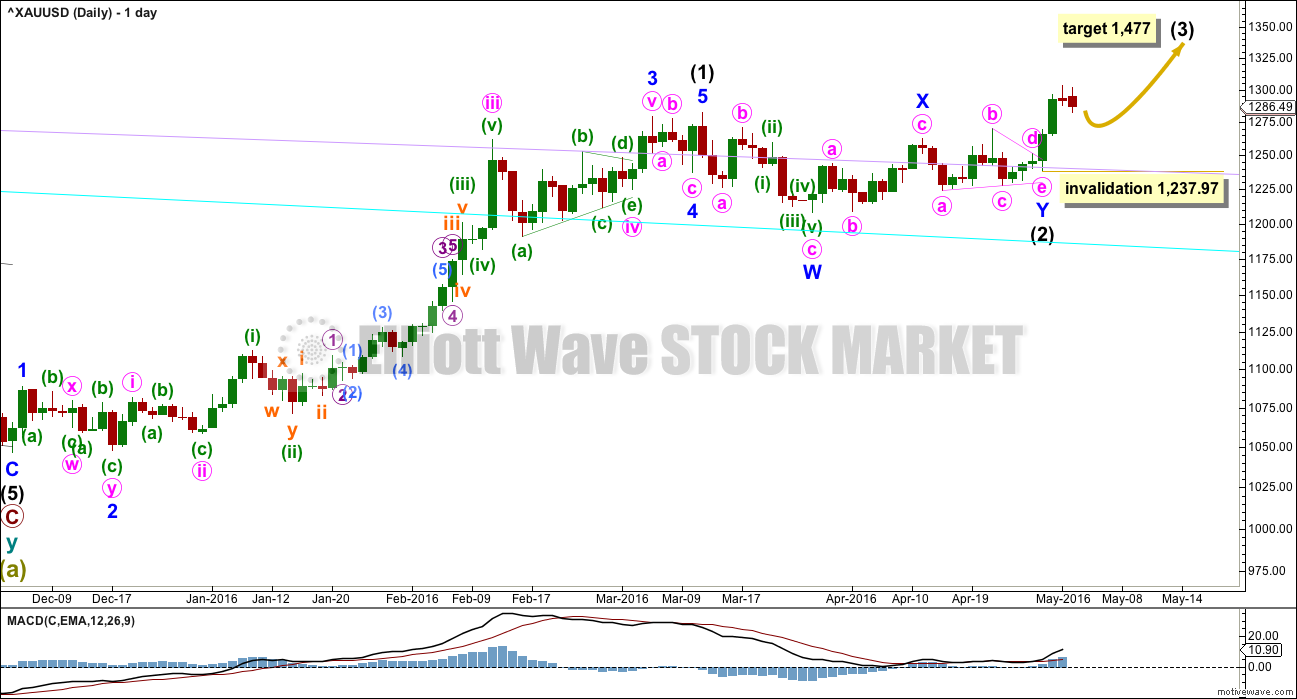
Intermediate wave (2) may be a double combination.
Minor wave W is a zigzag, the first structure in a double. The two structures in the double may be joined by a simple zigzag for minor wave X in the opposite direction.
Minor wave Y may be a running contracting triangle. The triangle is supported by MACD hovering at the zero line here on the daily chart.
Within intermediate wave (3), no second wave correction may move beyond the start of the first wave below 1,237.97.
The next wave up for intermediate wave (3) should be swift and strong. It must move above the end of intermediate wave (1) at 1,282.68. It must move far enough above this point to allow room for intermediate wave (4) to unfold and remain above intermediate wave (1) price territory.
At 1,477 it would reach equality in length with intermediate wave (1). This target is reasonable because intermediate wave (2) was very shallow.
If intermediate wave (2) is over as labelled, then it may have totalled a Fibonacci 34 sessions.
HOURLY ELLIOTT WAVE COUNT
Click chart to enlarge.
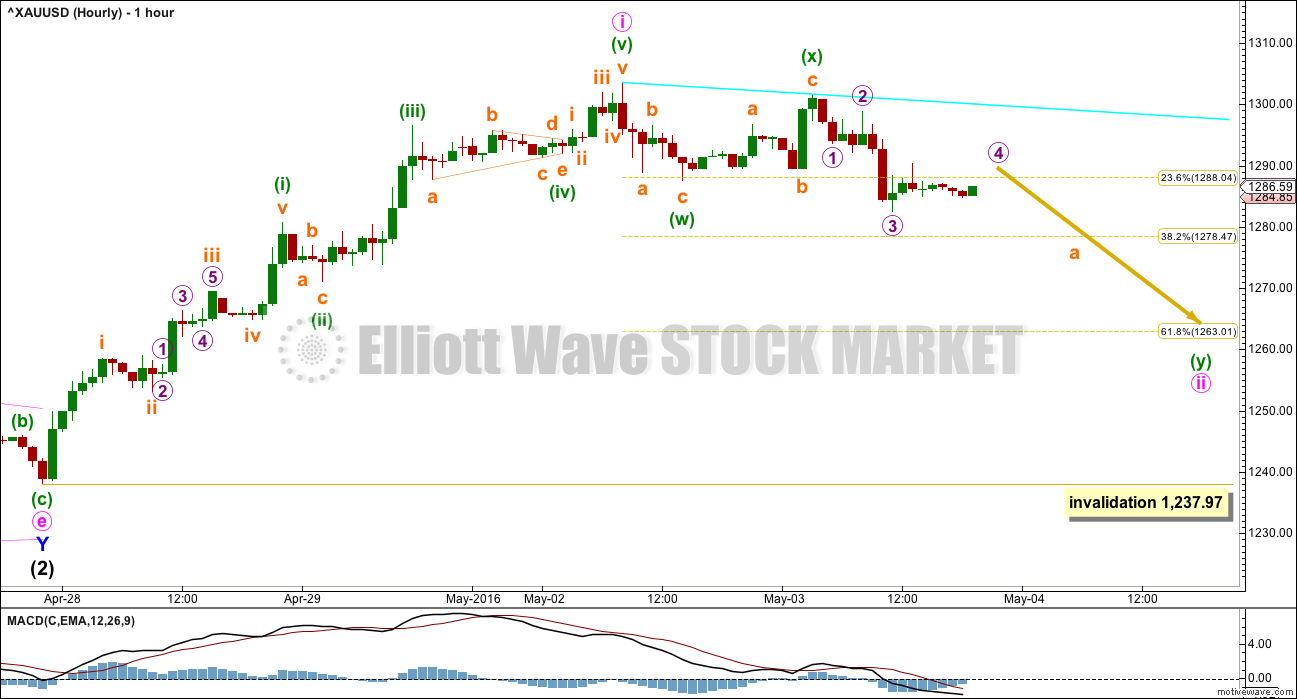
Upwards movement for minute wave i fits as a completed impulse.
Ratios within minute wave i are: minuette wave (iii) is 1.06 short of 0.618 the length of minuette wave (i), and minuette wave (v) has no Fibonacci ratio to either of minuette waves (i) or (iii).
There is alternation between the shallow zigzag of minuette wave (ii) and the more shallow triangle of minuette wave (iv).
Minute wave ii may be unfolding as a double zigzag. The first zigzag in the double is complete and labelled minuette wave (w). The double is joined by a three in the opposite direction, a zigzag labeled minuette wave (x). The second zigzag in the double is most likely to be incomplete and is labelled minuette wave (y).
The second zigzag in a double zigzag has a purpose, to deepen the correction when the first zigzag does not move price deep enough. So if a correction (particularly a second wave correction) begins with a brief shallow zigzag, as this one did, then a double zigzag (or an expanded flat) should be considered. Here the structure cannot be a flat correction at this stage because the upwards wave of minuette wave (x) is less than 0.9 the length of minuette wave (w). It cannot be a B wave within a flat as it has not met the minimum requirement.
To achieve its purpose the second zigzag in the double should deepen the correction. It would be very unlikely to be over at today’s low as it would have hardly deepened the correction. The 0.382 and 0.618 Fibonacci ratios are reasonable targets for minuette wave (y) to end.
At the time of publication, it looks like micro wave 4 may be unfolding as a sideways triangle or combination.
Minute wave ii may not move beyond the start of minute wave i below 1,237.97.
Add a short term bear market trend line to the hourly chart. Draw it from the high of minute wave i to the swing high of minuette wave (x) within this correction. When price breaks above the cyan line, it would be indicating an end to the correction and a return of the upwards trend. When there is more structure within the correction, then a channel may be drawn about it which may provide an earlier indication of a trend change.
If price does reach down to the 0.618 Fibonacci ratio, then it would present a good entry point for a long position on Gold. At that stage, the risk / reward ratio would be 8.5 if the target at 1,477 is used.
Any positions entered here or in the next day or so must accept the possibility of losses. Sometimes I am wrong. The difference between those new to trading and professionals is risk management. Always manage risk carefully. Accept the possibility of losses and keep losses managed. Let profits run.
ALTERNATE DAILY ELLIOTT WAVE COUNT
Click chart to enlarge.
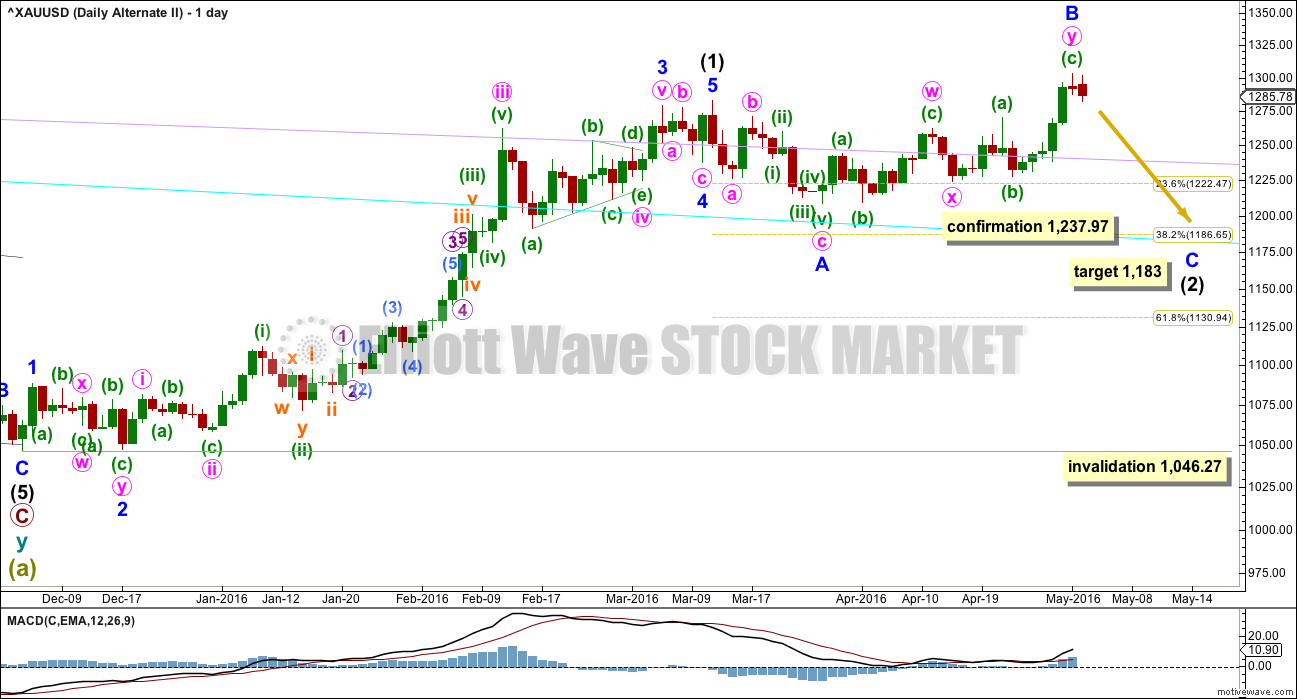
It is still possible that intermediate wave (2) is not over.
Normally, the first large second wave correction within a new trend is very deep, often deeper than the 0.618 Fibonacci ratio. The main wave count sees intermediate wave (2) as very shallow at only 0.19 of intermediate wave (1). This is unusual. And so this alternate must be considered.
If any members have long positions on Gold already it is essential that stops are used in case this alternate unfolds. I have already moved my stop to break even. If the main wave count is right, then I will not have a profit but nor will I have a loss. If this alternate is right, then I can wait until intermediate wave (2) is over to enter long for intermediate wave (3), or possibly enter a small short position to ride down minor wave C.
Intermediate wave (2) may be an expanded flat correction. Minor wave A is a three, minor wave B is a three and a 1.28 length of minor wave A. This is within the normal range of 1 to 1.38.
At 1,183 minor wave C would reach 1.618 the length of minor wave A. This would be the most likely target. If price keeps falling through this first target, then the second target would be at 1,108 where minor wave C would reach 2.618 the length of minor wave A.
Intermediate wave (2) may not move beyond the start of intermediate wave (1) below 1,046.27.
TECHNICAL ANALYSIS
Click chart to enlarge. Chart courtesy of StockCharts.com.
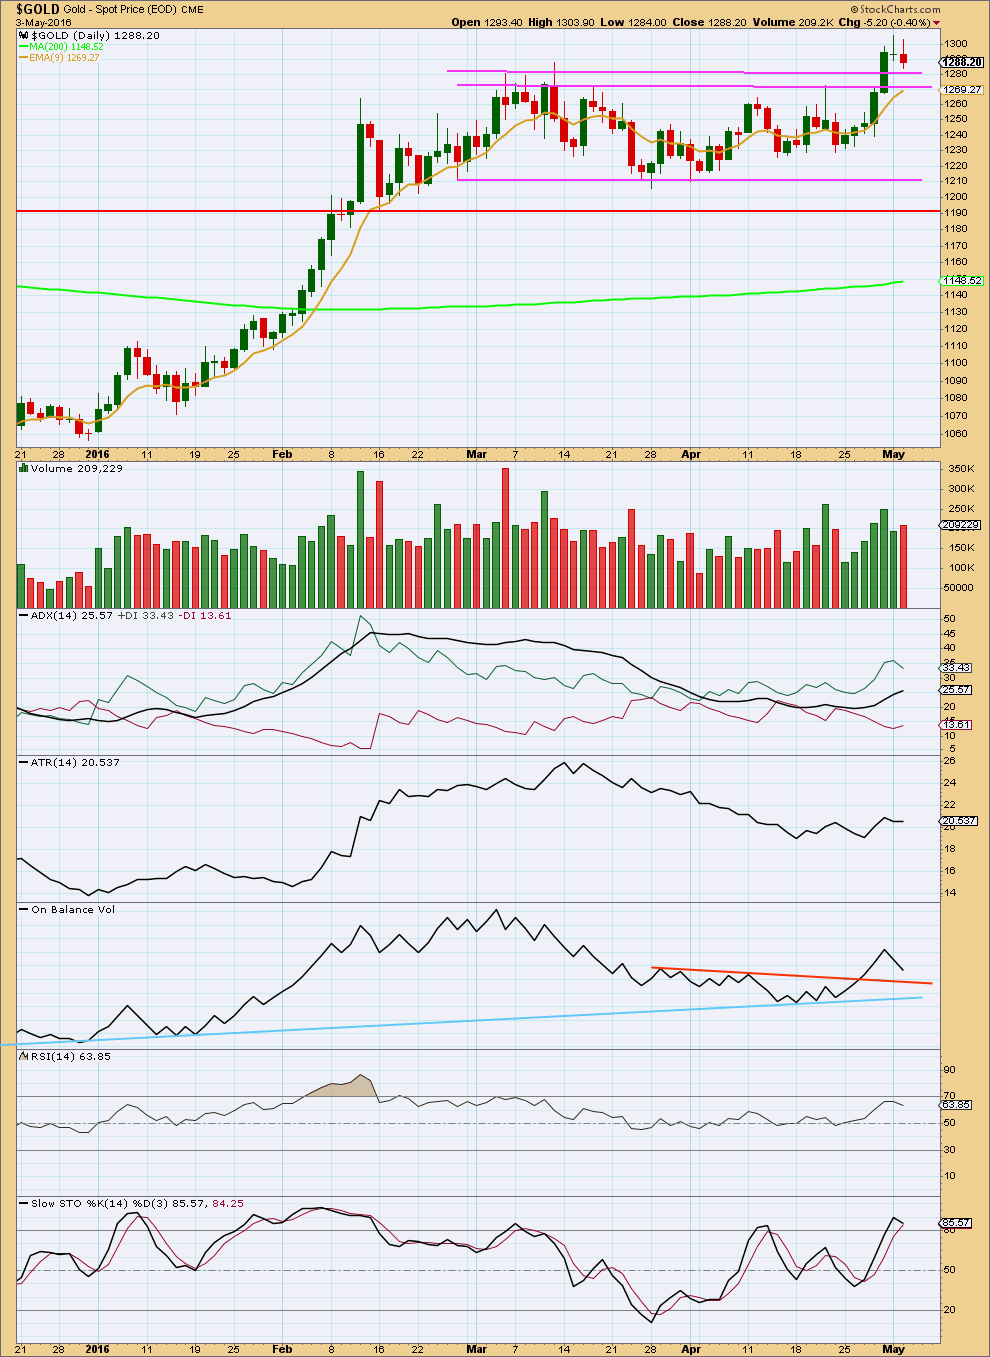
Upwards movement for Friday closed comfortably above prior resistance at 1,280 on a day with increased volume. This looks like a classic breakout from a consolidation.
After a breakout, often price will turn back down for a correction a few days later to find support at prior resistance. Price has moved slightly lower today but on a day with a slight increase in volume beyond the prior day. This indicates there may be a little more downwards movement to come.
The last three daily candlesticks technically complete an Evening Doji Star candlestick pattern, but it is weak. There is an overlap between the real body of the first candlestick and the body of the doji. The real body of the third candlestick only closes slightly into the real body of the first candlestick. There is light volume on the third candlestick compared to the first candlestick in the pattern. All these aspects weaken the signal from this pattern. It is my interpretation that this pattern indicates a pause to upwards movement rather than a trend reversal signal.
Price is turning and coming down to test support now that it has broken above resistance. This support line is fairly likely to hold. There are two support lines here: one at 1,280 and a lower one at 1,270. As price is now just above 1,280, it looks like it may move a little lower to about 1,270. If one more red daily candlestick prints with a low about 1,270 and exhibits lighter volume, then it would indicate a very likely end to this correction and a buy should be entered there.
ADX is increasing and the +DX line is above the -DX line. ADX is indicating an upwards trend is in place.
ATR today is flattening off, so disagreeing with ADX. The trend is interrupted.
On Balance Volume gave a strong bullish signal with a break above the orange trend line. OBV is now coming down to test support at that line. This should serve to hold price up at the resistance lines, most likely the lower one. This supports the main daily Elliott wave count and not the alternate.
While the trend is up, the 13 day moving average may be expected to provide support for counter trend corrections.
RSI is not extreme. There is room for price to rise further.
This technical analysis still supports the main Elliott wave count. It does not support the alternate daily Elliott wave count.
This analysis is published @ 08:57 p.m. EST.
Good morning everybody. It looks like the target at 1,271 was pretty much met, although subminuette b moved higher first as an expanded flat. There is no ratio between subminuette a and c.
Minuette (y) now looks like a complete zigzag and it fits neatly in a channel. When the channel is breached that will provide some confirmation of a trend change.
When the upper edge of the channel is breached then price may turn and move slightly lower, a throw back to the trend line, to find support there.
Updated chart here. Target for minute iii is provisional; we don’t have trend channel or trend line confirmation that minute ii is over, so if it moves lower the target will change. For now at 1,377 minute iii would = 1.618 X minute i
Nice call!
TOS already fired bullish BUY for GDX at 2:00 pm,
GDXJ at 2:10 pm, Gold at 2:45 pm
Also MACD Buy at 3 and 5 minute time frame
Gold now at 1,280 at 3:04 pm
Gold low was 1271.86 at 1:34 pm
Gold may have just made a move up higher finally at 2:30 pm after GDX and NUGT settled at lower gold price for 1 hour.
2:42 pm and gold is up $14 from the low at 1:34 pm
Gold day low was 1271.86 at 1:34 pm
Already since then got multiple signals on several indicators that gold may have bottomed in the last 20 minutes. Enough signs for me to buy GDX at this price for the big 3rd wave up.
Latest target update was.
“Alan Tham May 4, 2016 at 11:43 am
Richard, at the moment, it appears that Subminuette C is headed towards 0.618 of A. Target is 1275.66. We shall await developments.”
Gold Dropping a lot now at 1:11 pm
What is the wave count? What is the target?
Since subminuette wave b moved up from 1,284.93 to 1,289.86 = $4.93 ,
would subminuette wave c just move up $4.93 from 1,271 up to 1,275.93?
What is the new target for subminuette c?
Subminuette wave b has moved up from 1,284.93 at 3:53 am to 1,289.86 at 9:42 am so any idea what is the new target for subminuette c?
“At 1,271 subminuette c would = 0.618 X a. That target assumes subminuette b is over and won’t move higher.”
Minuette Y began at 1301.92. Subminuette A = 1278.94. Subminuette B is an expanded flat completing at 1289.86.
Using the conservative C=A, Subminuette C could end at 1266.88. This is closer to 1263.05, the 0.618 retrace of Minute 2. Once Subminuette C has more structure, then it is possible to give a better estimate.
Alan $1,266.88 as a revised target estimate for subminuette C, (y) minuette ii is even better. that’s a great help, thanks a lot. Really looking forward to the big drops in GDX and NUGT down when gold gets to that target zone area 1,266.88.
Richard, at the moment, it appears that Subminuette C is headed towards 0.618 of A. Target is 1275.66. We shall await developments.
Thanks I just bought some GDX at $23.52 at 1:22 pm.
TOS – MFI Money Flow Index is oversold both gold and NUGT right now and just turned up at 1:36 pm for NUGT
Gold at 1272.44 and GDX 23.48 DUST at 1.72 NUGT at 88.64 at 1:38 pm
Another look at the USD through UUP. This chart shows a breakdown and the expectation of more down, after a possible back test.
https://rambus1.com/2016/05/03/uup-update-79/
A possible USD Wolfewave on daily.
USD needs to get above 9ema.
Interesting. We are clearly at a crossroads. A big move up or down appears to be coming. I would think that the $USD needs to continue down for gold to move up big in wave 3.
It looks like it may be close to completion. Within this second zigzag subminuette a looks complete. At 1,271 subminuette c would = 0.618 X a. That target assumes subminuette b is over and won’t move higher.
I am expecting that Gold and the S&P may be inversely correlated for a while. I expect S&P to move strongly lower, and Gold to move strongly higher at the same time.
If price remains within the lilac channel and moves lower, then use the channel as a guide. When price breaks above the upper edge (after making a new low short term) then minute ii may be over and minute iii may have begun.
Risk is at 1,237.97.
Thanks for the update ?
What’s your thoughts on $USD? Can gold move up in wave 3 if $USD moves up strongly? Or maybe it doesn’t matter what $USD does? Or do you have another $USD count showing the top is in?
It doesn’t really matter what USD does, although this is gold valued in USD so it usually has some relationship. The relationship isn’t always reliable.
I like to hear that when I just bought some GDX really cheap today
Here’s a chart by Fullgoldcrown showing support around Lara’s 1,271 target
I too agree that atleast a temprory bounce in USD is expected here…
But till the level of 1237 hold i feel that we are entering in a most amazing ride with gold for the 3rd wave…
And many times before USD and GOLD were trending together..so it can happen again…especially Equity markets looking horrible that supports safe heaven buying…
Im waiting for another 10 to 15$ drop for going long…sl as lara mentioned…
🙂
Ruppu, I love that sound of your line, “we are entering in a most amazing ride with gold for the 3rd wave…”
It just started at 11 pm last Thursday and this gives a much better buying opportunity, cheaper with less risk, excellent!
“At that stage, (1,263 at .618 Feb.) the risk / reward ratio would be 8.5 if the target at 1,477 is used.
‘Perfect Storm Against Gold Reversing’ Says Analyst That Forecasted $1,300 Gold
By Kitco News
Tuesday May 03, 2016 16:32
http://www.kitco.com/news/2016-05-03/This-Analysts-1-300-Gold-Call-Was-On-The-Money.html
He made the forecast August 2015 and still highly recommends gold, but not silver as it is an industrial metal and it depends on the economy.
I love this article and video this guy reassured me about gold.
I’ll be buying GDX and holding it Wednesday.
I watched the video twice so amazing as it explains a lot.
Who will lead from here?
Gold or the US dollar that may decide which daily gold count.
The US dollar and gold moved opposite last week even big moves earlier this year when gold and the miners started a new bull market.
Gold’s next big up or down move depends on what big move the US dollar does next or vice versa.
Since the big Japan interest rate surprise the end of April the US dollar went down and gold went up. This morning at 4 am they both reversed direction.
I have been kicking myself for 3 months now for missing the IT bottom in Gold / Gdx ect. It exploded so fast that I kept waiting for a pullback – which never came.
Anyway, my worry for the main bull count is not based on the potential EW patterns of Gold / GDX but rather the USD – which may or may not matter.
I have been tracking a count of a complex 4th that may be ended yesterday. If this count is correct, USD could resume its climb. My point of view is this would better support Lara’s alternative count. TBD
closer view of potential 4th wave
Why have you labelled your C wave as a-b-c?
It will fit as a five. C waves should subdivide as fives (exception is C waves within triangles)
Thanks, fixed
The US dollar dropped 4% from 1 pm April 22nd until a low at 4 am this morning and gold went up $77 from 1 pm April 22nd until a high at 4 am this morning.
http://www.investing.com/quotes/us-dollar-index-streaming-chart
The US dollar definitely effects gold since gold is priced in US dollars, they are both currencies and one effects the other although it can vary.
Would be very helpful for the US dollar to stay where it is or drop in order for gold to head up to 1,477. Otherwise if the US dollar rallies then gold will not rally.
And here’s a lower H&S target for NUGT.
GDX already hit the target range that I posted yesterday. With gold going lower, GDX may also go lower. Here’s a possible H&S target.
I saw some other members mention the $USD today. Here’s a good chart showing the possible reversal candle. If the $USD moves up strongly from here, that would likely be bearish for gold.
https://goldpredict.com/?p=3793
Any thoughts?
Good site for TA. I like the candlsticks chart pattern analysis.
USD has formed wolf wave on daily.
Chart later.
Dreamer, thank you very much for your excellent chart(s) and drawing our attention to the activity in the US dollar. I’m posting Gold Seasonality charts I sourced (albeit a bit old) to reminder us—seasonality may be playing stronger in the current moves than we thought.
These things do seem to line up with Lara’s daily alternate… and then there’s the COTs.
Just food 4 thought.
Gold Spot 30yr (2012)
Gold Futures 20yr (2009)
Gold Spot 12yr (2014)
Yes, seasonality bearish into June. Good reminder!