
Price moved lower again as yesterday’s Elliott wave count expected.
Summary: The correction now looks to be complete. Price looks like it may be exhibiting a typical throwback to support after an upwards breakout. On Balance Volume may assist to stop the fall in price here. The Elliott wave count expects a third wave up at two degrees. The risk to any long positions entered here is at 1,237.97. The target for the third wave to end is at 1,477.
New updates to this analysis are in bold.
Last published weekly chart is here.
DAILY ELLIOTT WAVE COUNT
Click chart to enlarge.
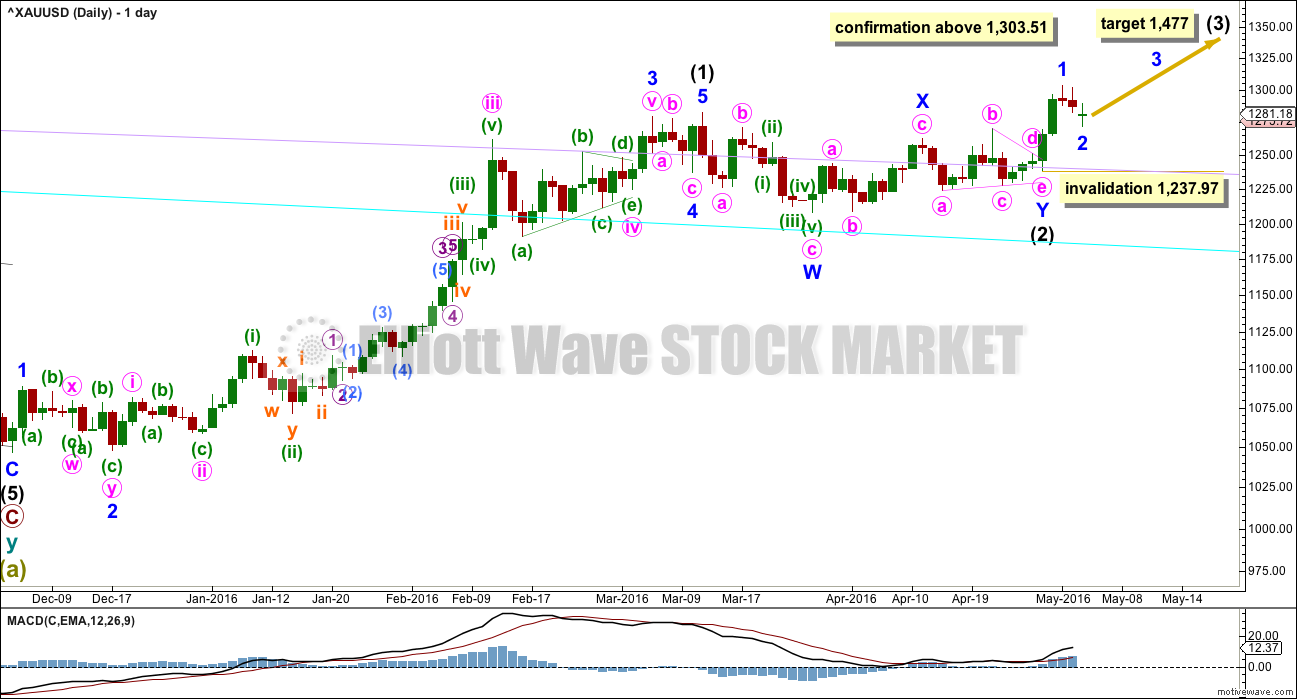
Intermediate wave (2) may be a double combination.
Minor wave W is a zigzag, the first structure in a double. The two structures in the double may be joined by a simple zigzag for minor wave X in the opposite direction.
Minor wave Y may be a running contracting triangle. The triangle is supported by MACD hovering at the zero line here on the daily chart.
Minor wave 2 may not move beyond the start of minor wave 1 below 1,237.97.
The next wave up for intermediate wave (3) should be swift and strong. It must move above the end of intermediate wave (1) at 1,282.68. It must move far enough above this point to allow room for intermediate wave (4) to unfold and remain above intermediate wave (1) price territory.
At 1,477 it would reach equality in length with intermediate wave (1). This target is reasonable because intermediate wave (2) was very shallow.
If intermediate wave (2) is over as labelled, then it may have totalled a Fibonacci 34 sessions.
HOURLY ELLIOTT WAVE COUNT
Click chart to enlarge.
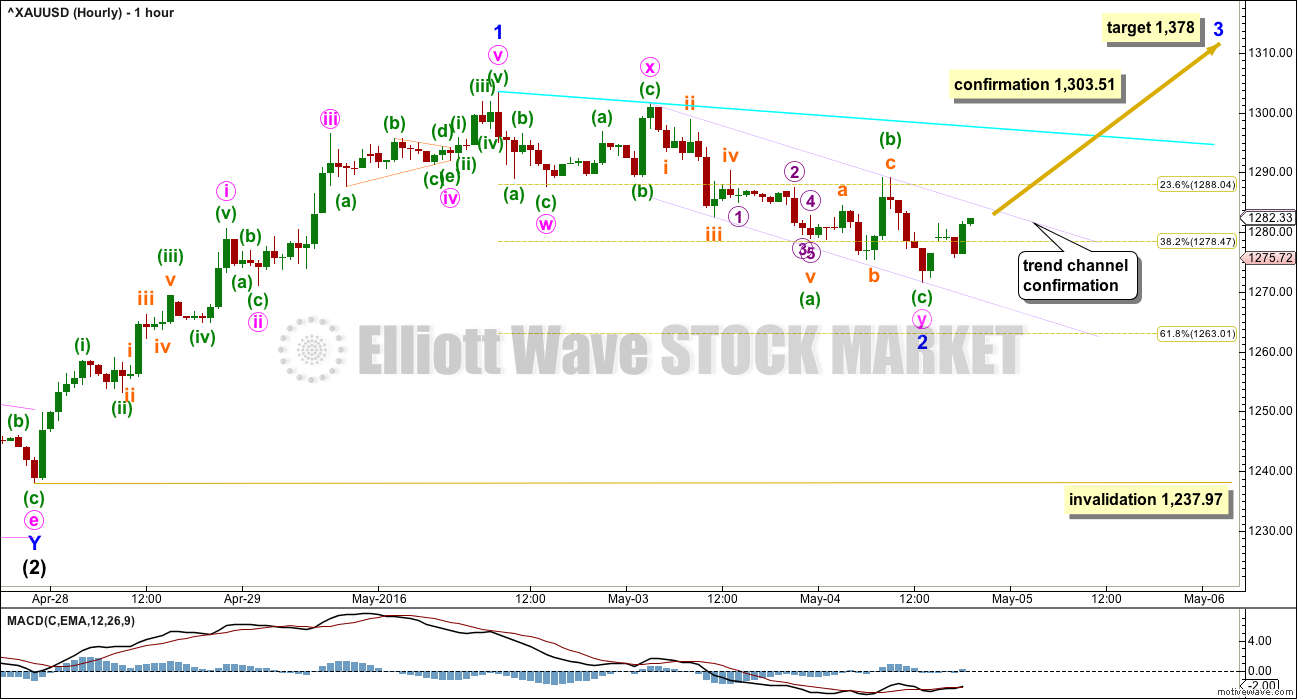
The degree of labelling within the start of intermediate wave (3) has been moved up one degree today. This expects that minor wave 3 will be extended, which is very common.
At 1,378 minor wave 3 would reach 1.618 the length of minor wave 1. Minor wave 4 is likely to be relatively quick and may also be shallow, so the target is provided for shorter term traders because it may not be very useful for position traders. For position traders following the trend, the higher target at 1,477 should be used.
Minor wave 2 now looks like a completed double zigzag. Draw a small best fit channel about the second zigzag of minute wave y (shown in lilac). When upwards movement breaks above the upper edge of this small channel, it would provide some trend channel confirmation that minor 2 is most likely over and minor wave 3 has most likely begun.
After the upper edge of the lilac channel is breached, then price may turn down to throwback to the upper trend line, finding support there. If this is how price behaves, it would present a good entry opportunity to join the upwards trend.
At this stage, with minor wave 2 most likely over, any entry point about here should be profitable within 24 hours.
If the labelling of minor wave 2 as a double zigzag is correct, then the probability is very high that it is over. For minor wave 2 to continue lower, it would have to be a triple zigzag which is one of the rarest Elliott wave structures. A trend change here is very likely based on the probability of structure.
The risk to any long positions here is at 1,237.97. If my labelling of minor wave 2 is wrong or if it does continue lower as a very rare triple zigzag, then it may not move beyond the start of minor wave 1 below 1,237.97.
A new high above 1,303.51 would provide confirmation of the bull wave count. At that stage, the alternate below would be invalidated.
ALTERNATE DAILY ELLIOTT WAVE COUNT
Click chart to enlarge.
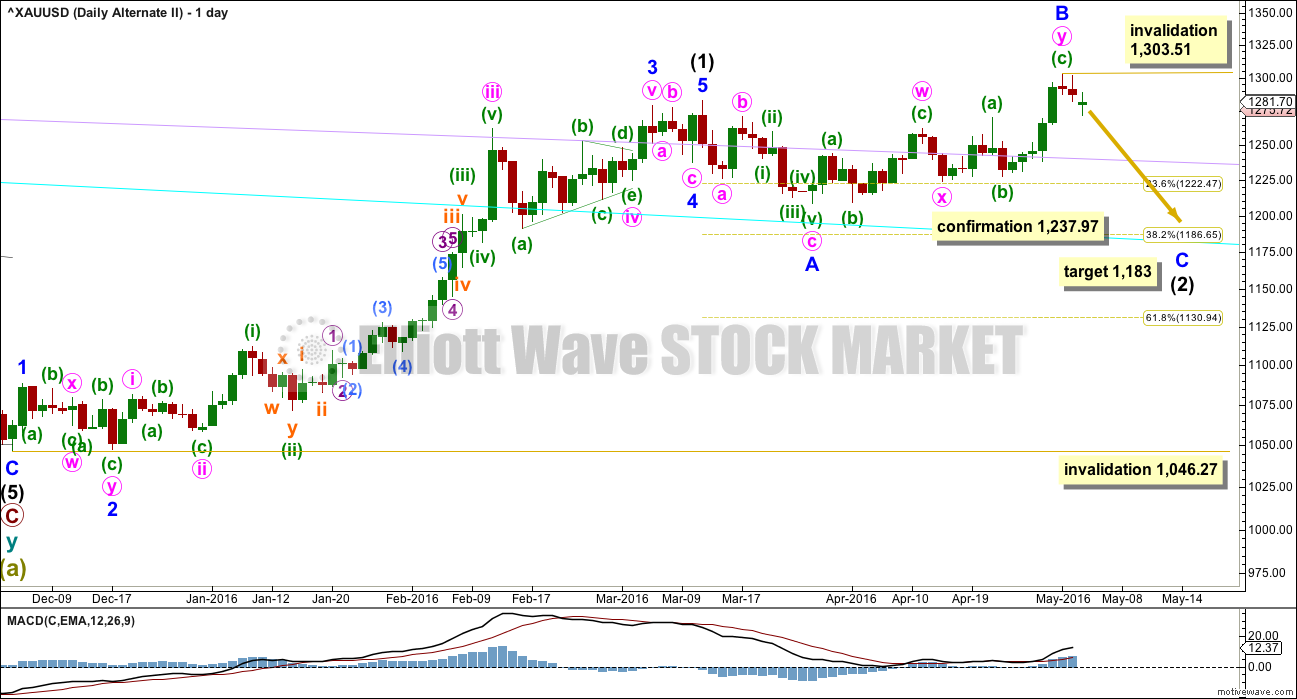
It is still possible that intermediate wave (2) is not over.
Normally, the first large second wave correction within a new trend is very deep, often deeper than the 0.618 Fibonacci ratio. The main wave count sees intermediate wave (2) as very shallow at only 0.19 of intermediate wave (1). This is unusual. And so this alternate must be considered.
If any members have long positions on Gold already it is essential that stops are used in case this alternate unfolds. I have already moved my stop to break even. If the main wave count is right, then I will not have a profit but nor will I have a loss. If this alternate is right, then I can wait until intermediate wave (2) is over to enter long for intermediate wave (3), or possibly enter a small short position to ride down minor wave C.
Intermediate wave (2) may be an expanded flat correction. Minor wave A is a three, minor wave B is a three and a 1.28 length of minor wave A. This is within the normal range of 1 to 1.38.
At 1,183 minor wave C would reach 1.618 the length of minor wave A. This would be the most likely target. If price keeps falling through this first target, then the second target would be at 1,108 where minor wave C would reach 2.618 the length of minor wave A.
Intermediate wave (2) may not move beyond the start of intermediate wave (1) below 1,046.27.
TECHNICAL ANALYSIS
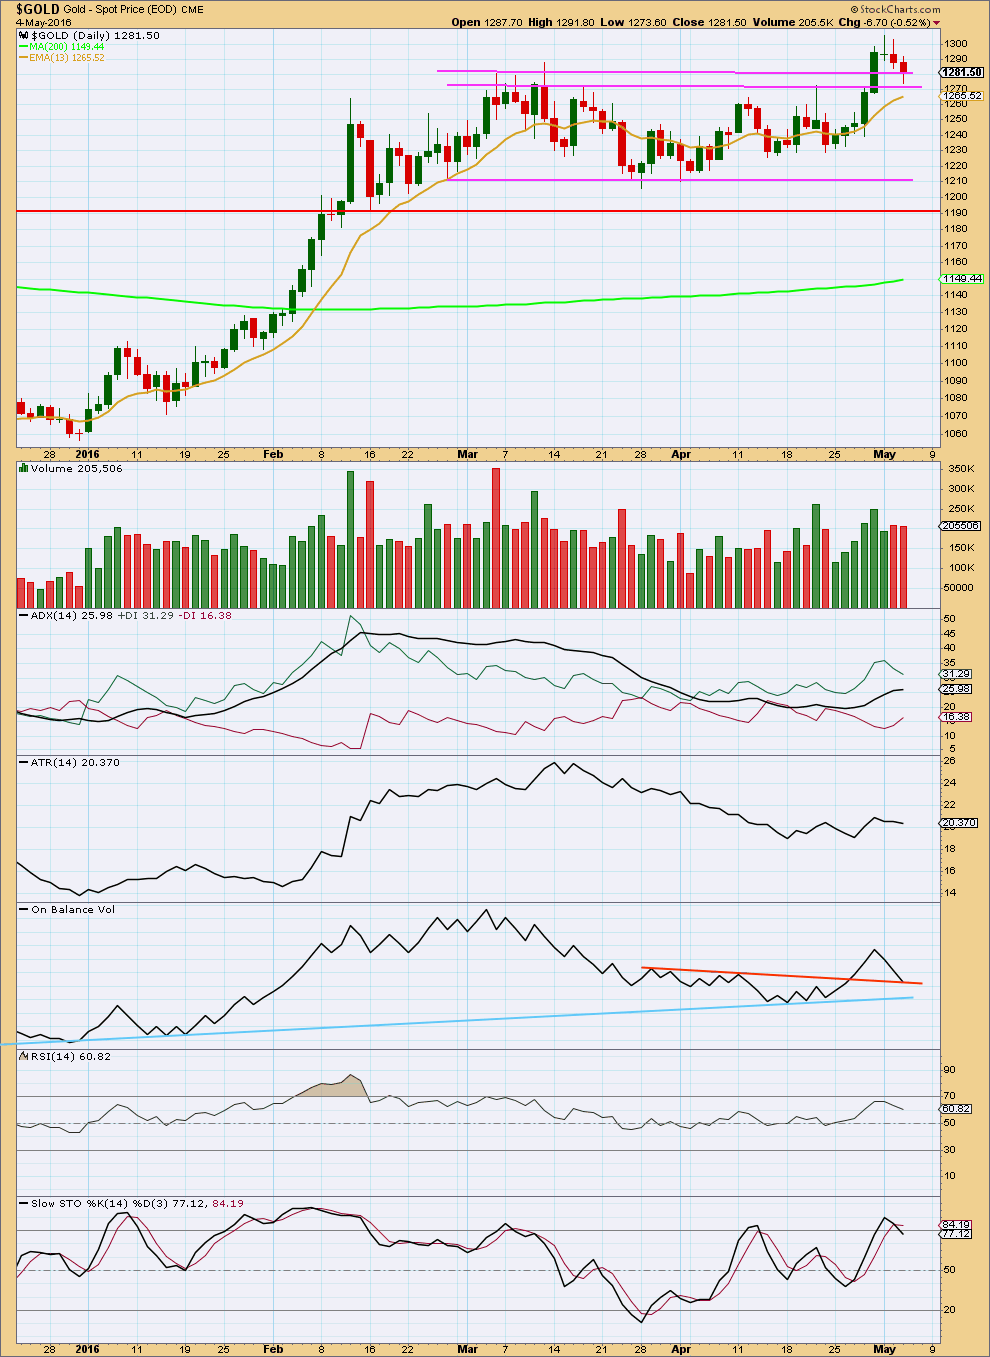
Click chart to enlarge. Chart courtesy of StockCharts.com.
Upwards movement for Friday closed comfortably above prior resistance at 1,280 on a day with increased volume. This looks like a classic breakout from a consolidation.
After a breakout, often price will turn back down for a correction a few days later to find support at prior resistance. Price has moved lower today. The lower wick of today’s candlestick is slightly above the lower support line about 1,270. Today has slightly lighter volume than the prior downwards day. It looks like the throwback is complete.
ADX is increasing and the +DX line is above the -DX line. ADX is indicating an upwards trend is in place.
ATR today is flattening off, so disagreeing with ADX. The trend is interrupted.
On Balance Volume has come down to test support at the orange line. Because this line is close to horizontal and has been repeatedly tested, it offers reasonable technical significance. This line on OBV is likely to assist to halt the fall in price here.
While the trend is up, the 13 day moving average may be expected to provide support for counter trend corrections.
RSI is not extreme. There is room for price to rise further.
This technical analysis still supports the main Elliott wave count. It does not support the alternate daily Elliott wave count.
This analysis is published @ 08:45 p.m. EST.
Gold EW chart today.
Here also is a link to article that has it at the bottom and expands when clicked on.
http://thegoldforecast.com/video/labor-stats-release-tomorrow-sends-money-sidelines-today
I am sorry everybody that I wasn’t here to make my usual comment in the NY afternoon before NY closed. I had to pop out early my morning and didn’t get home until after it closed.
Not much happening with this market so far though.
I’m needing to take some more time to figure out the possible structure of minor 2 down. I have a problem with the B wave within it.
Actually, I have a problem with all B waves 🙂 They’re the worst.
Anyhoo… when StockCharts have finalised their volume data for today that will indicate whether or not this correction may be over. Lighter volume would indicate it is done. Heavier volume would indicate the alternate daily may be correct.
For now price looks like it is finding support about the lower support line at 1,270.
So far it all looks good for a typical throwback. My favourite entry set up.
Now I want to see a small channel breached on the hourly chart before I have enough confidence to add to my long position (which is very slightly underwater, my stop is just below 1,237.97 – but I don’t like to be in and out, I prefer to hold a position for weeks so don’t mind a little underwater at the start).
Lara, I really appreciate your extra dedication to looking to clarify gold’s direction day by day or even intra-day. It helps optimize our investments profits and reduce losses.
One EW advisor I know but don’t trade based on has unfortunately ignored the necessary attention to the gold bull market all of 2016 and I heard one of his clients this week advise that the advisor’s trading record on gold was in a 50% loss for the year. The advisor kept expecting a new low and didn’t recognize a gold bull yet or provide details on how to trade the gold bull market thinking that once the bull market was eventually confirmed that the amount of the gold bull market missed would be small in the overall bigger gold bull market. Meanwhile he keeps looking bearish gold.
Simple technical analys helps so much to identify when a market has changed.
Excellent point.
FRIDAY, MAY 6th
8:30 am EST US Nonfarm payrolls April Forecast 205,000 Previous 215,000
I think minor 2 may have already ended at the 1:30 low of 1268.87.
The drop Wednesday was from 9:30 to 1:30 and today from 9:00 am to 1:30 pm.
I’ve been getting multiple buying signals since 1:30 pm.
I hope i’m wrong as I sold GDX earlier for a profit but didn’t buy back in yet.
Minor 2 could have ended at 1268.87.
There is a possibility that it was only the third wave down. If this is correct, then the next drop has to take out 1268.87. If not, it is just a correction of the first wave up in Minor 3.
Anyway, I will just add to my position at the next drop. It is not wise to try to catch a bottom. I accumulate on dips. Note that although 1268.87 < 1271.86 the previous low, NUGT did not make a lower low, which means the uptrend is pretty strong.
Alan so gold ended micro 3 of minuette 5 at about 1:30 and just need 1 more sizable drop for micro 5 of minuette 5 and minor wave 2 to be over.
Is the price target still the 1,263 area as per Lara’s 4:30 am chart?
Right now, it is nearer 1267 to 1268.
Alternatively, it could have been over at the low of 1268.87.
To add to Richard’s question and because there are discussions about the alternate being a strong possibility, is there any chance that percentages can be offered for each of the paths; likelihood? I wonder what the US Dollar wave count looks like and it’s projection.
Hi Stephen. In trading, I do not really bother which of a few possible wave counts is correct. I just trade the present price moves, just following the current price movement.
For USD, there are some calls for it to bottom at a B wave, and a strong C wave would follow. But, I’m not sure of it. Somewhere in time, perhaps Lara could update her count of USD.
Gold just dropped fast to day low of 1272.29 at 1:26 pm and below Wednesday’s low of 1,273.60. Yet miners are stronger this minute that at yesterday’s low because Wednesday moved down for a continuous amount of time to the low, which really accelerates the miners decline.
Just got a buy signal on nugt, I am in at 96 for a 3-5 day swing trade, will add more if it drops.
I think we are nearly there. Minuette 4 of Minute C of Minor 2 should have just completed a triangle @ 1276.43. The final drop in Minuette 5 ought to follow soon, unless my count is wrong.
Got the triangle wrong. Minuette 4 was just a simple 3-wave zigzag. But this does not detract from the count.
All is going well. The fast drop just now was micro 3 of minuette 5. I’m off to buy NUGT soon.
Lara,
Wonder if you think it would be worthwhile publishing a hourly wave count for the alternative daily count.
Not at this stage.
Is the current wave down since the 9:08 am high heading down towards the $1,263 new target low for minor wave 2?
Or was that low at 1274.85 at 10:42 am second wave down since Wednesday’s low?
Is Lara’s 4:30 am warning and chart of lower target of possible 1263 still possible?
Gold bottomed overnight at 4:25 am at 1,274.48 right when Lara issued warning, however gold then went up to 1286.54 high today at 9:08 am.
Hmmm….bullish percentage GDM on stockcharts.com has about 80 percent gold bulls, highest in about 5 years….if you are a contrarian…..hmmmm
Dermot, How did you find that at stockcharts? I’m very interested in bullish sentiment, % bullish but no idea which indicator provides that at stockcharts.
Is it possible to post a chart or give indicator name please. Sentiment peaks are an important indicator.
Here’s the symbol.
Thanks for the chart and symbol
$BPGDM
They have a bunch of BPs ….for example $BPspx, which is also very high. Doesn’t mean it is over but caution is warranted. I’m wondering if Gold/Stocks go down like 2008 all over again…..anything is possible. They could also skyrocket….When a tsunami hits does it matter if you have flood insurance?
I think StockCharts bullish percent isn’t a measure of sentiment, I think it’s breadth.
It’s the % of equities within the group which is bullish on a point and figure chart measure.
I too thought it was a measure of sentiment when I first used it. But apparently not so.
The unemployment rate and the jobs number will be interesting. We will see if the Commercial traders knew something was up with their heavy shorting of Gold/silver.
Current rally could be second wave correction for alternate count.
I favor the alternate count.
Let’s go wave 3!!!
With gold expected to drop further to possibly $1,262, I was curious of the timing. Being that the all important US Jobs report will be issued tomorrow morning at 8:30 Eastern, I can’t help but think that if the figures are strong, it will benefit the dollar and put pressure on the gold price. Naturally, the converse is true as well. Having an idea on the timing would be very interesting.
As always, I enjoy reading all of the comments and hit the refresh button searching for more notes probably way too often than I should!
It may be that minor wave 2 is not over. A final wave down?
It works if a triangle just completed for minute wave b.
At the 0.168 Fibonacci ratio C would = 0.618 X A
That was what I supposed would happen when I posted yesterday. I’d be happy if it comes to fruition. I can then add to my position without much apprehension.
Gold is just hanging in below the upper edge of the channel. I’m putting a request in to the market for it to hurry up and break out already. I want a little confirmation before I add to my long position, and I don’t want to have to stay up late to do it 🙂
I like it when you talk to the market. I don’t feel so crazy now! lol
Well I tried, but it’s not listening.
I’m concerned that the upper edge of the channel is holding. And upwards movement from the low of yesterday looks corrective, overlapping.
I’m not adding to my long position here. I suspect something else must be going on…
Maybe my analysis of minor 2 as a double zigzag is wrong. Maybe it’s a single zigzag and needs a final wave down to complete to the 0.618 Fibonacci ratio?
And apparently one should not begin a sentence with “and”. Oops.
That was what is being taught in schools: basic English grammar. I flout that rule very often in my writings. I use it for added emphasis in concluding argumentative or descriptive/narrative pieces. And I think it is effective.
Lara has a target for Intermediate 3 at 1,477.
This technical chart by Mark shows a large Cup & Handle pattern projecting to 1,550. That’s probably near where Intermediate wave 5 will end. Always good to confirm targets with more analysis.
To the moon…..
Dreamer very exciting thanks for your beautiful chart. $1,550 Cha-Ching$