
Price moved slightly lower, which was allowed for but not expected from yesterday’s analysis.
Summary: This looks like a good set up now for a long trade on Gold. Price has broken out of a consolidation on increased volume, now turned down to find support at prior resistance. The probability is high that price will bounce up from here; the Elliott wave count expects a third wave of a third wave upwards. The target is at 1,477. Risk is at 1,237.97. Members may enter long now, or may choose to reduce risk a little further by waiting for the channel on the hourly chart to be breached by upwards movement and possibly also price to make a new high above 1,286.04.
New updates to this analysis are in bold.
Last published weekly chart is here.
DAILY ELLIOTT WAVE COUNT
Click chart to enlarge.
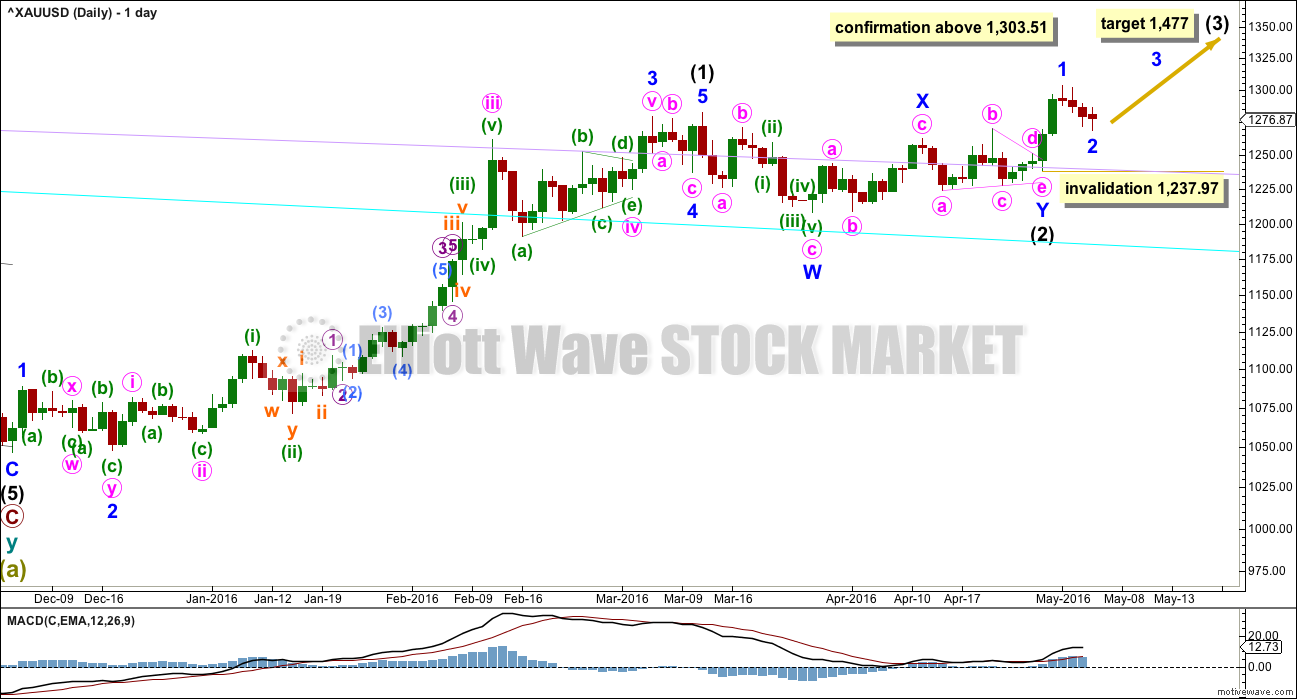
Intermediate wave (2) may be a double combination.
Minor wave W is a zigzag, the first structure in a double. The two structures in the double may be joined by a simple zigzag for minor wave X in the opposite direction.
Minor wave Y may be a running contracting triangle. The triangle is supported by MACD hovering at the zero line here on the daily chart.
Minor wave 2 may not move beyond the start of minor wave 1 below 1,237.97.
The next wave up for intermediate wave (3) should be swift and strong. It must move above the end of intermediate wave (1) at 1,282.68. It must move far enough above this point to allow room for intermediate wave (4) to unfold and remain above intermediate wave (1) price territory.
At 1,477 it would reach equality in length with intermediate wave (1). This target is reasonable because intermediate wave (2) was very shallow.
If intermediate wave (2) is over as labelled, then it may have totalled a Fibonacci 34 sessions.
HOURLY ELLIOTT WAVE COUNT
Click chart to enlarge.
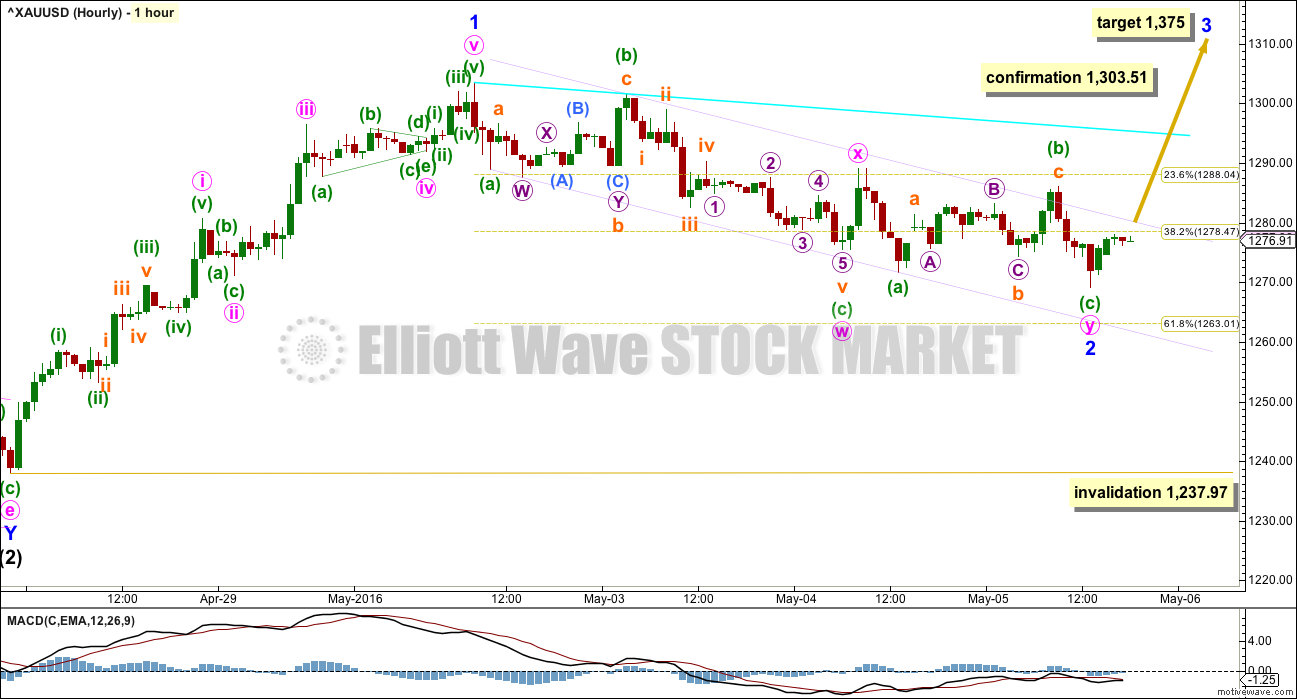
This is the best labelling I can see for minor wave 2 so far. It may be a complete double zigzag.
Within the first zigzag labelled minute wave w, minuette wave (c) is 2.41 longer than 1.618 the length of minuette wave (a).
The double is joined by a three in the opposite direction, a quick zigzag labelled minute wave x.
Within the second zigzag labelled minute wave y, minuette wave (c) is just 0.53 short of equality in length with minuette wave (a).
The different lengths between A and C waves within the double exhibits alternation.
Minuette wave (c) may still move lower within minute wave y. The best fit channel (lilac) needs to be breached to indicate this movement is over. A new high above the start of minuette wave (c) at 1,280.21 *edit: 1,286.04 would provide some price indication that downwards movement is most likely over. At that stage, upwards movement could not be a second wave correction within minuette wave (c), so at that stage minuette wave (c) would have to be over.
While there is no trend channel or price indication that downwards movement is over, the risk that price could move lower must be accepted.
A new high above 1,303.51 would invalidate the alternate daily wave count below and provide confirmation of this main wave count.
Any members entering long here are reminded to manage their risk carefully. It is the single most important aspect of trading, so it bears repeating. Do not invest more than 3-5% of your equity on any one trade. Always use a stop loss to close the trade if the market moves against you. Even a high probability set up like this one can go wrong; the risk of a loss to your long position must be accepted and must be managed.
ALTERNATE DAILY ELLIOTT WAVE COUNT
Click chart to enlarge.
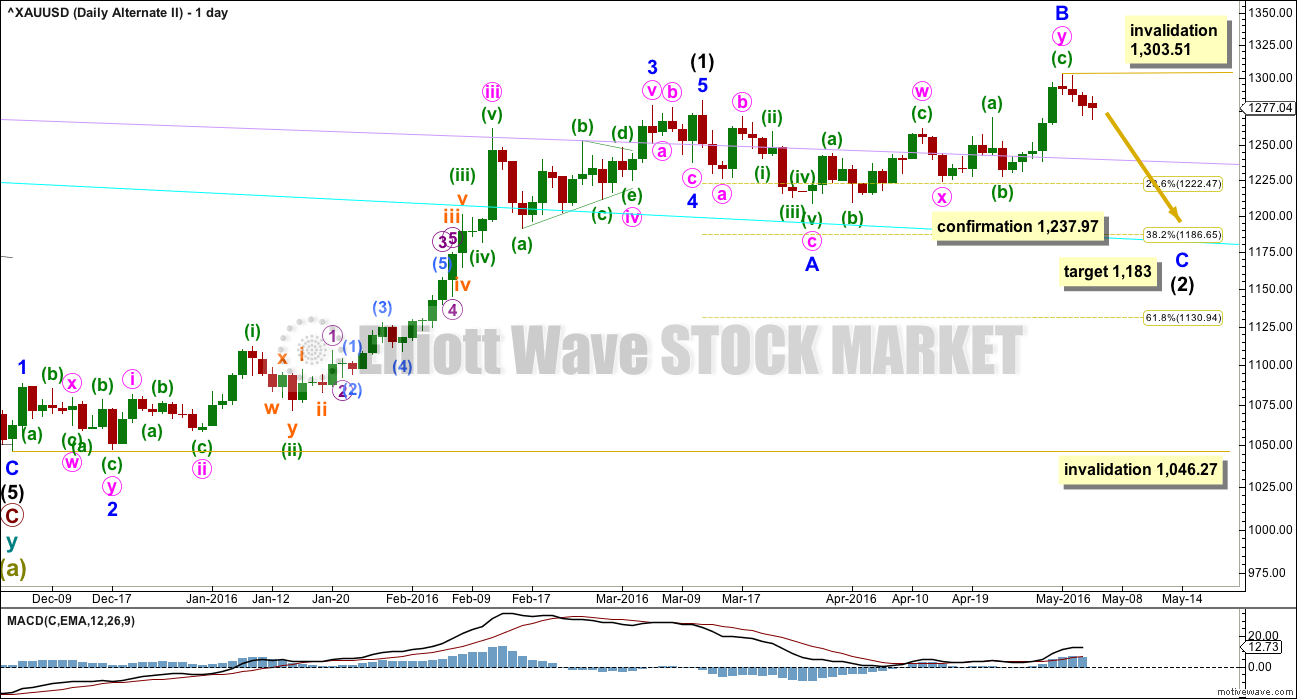
It is still possible that intermediate wave (2) is not over.
Normally, the first large second wave correction within a new trend is very deep, often deeper than the 0.618 Fibonacci ratio. The main wave count sees intermediate wave (2) as very shallow at only 0.19 of intermediate wave (1). This is unusual. And so this alternate must be considered.
If any members have long positions on Gold already it is essential that stops are used in case this alternate unfolds. I have moved my stop to just below 1,237.97 to give the market room to move, and my position is only about 2% of my equity. If the main wave count is right, then I will not have a profit. If this alternate is right, then I will have a small loss and I can wait until intermediate wave (2) is over to enter long for intermediate wave (3), or possibly enter a small short position to ride down minor wave C.
Intermediate wave (2) may be an expanded flat correction. Minor wave A is a three, minor wave B is a three and a 1.28 length of minor wave A. This is within the normal range of 1 to 1.38.
At 1,183 minor wave C would reach 1.618 the length of minor wave A. This would be the most likely target. If price keeps falling through this first target, then the second target would be at 1,108 where minor wave C would reach 2.618 the length of minor wave A.
Intermediate wave (2) may not move beyond the start of intermediate wave (1) below 1,046.27.
TECHNICAL ANALYSIS
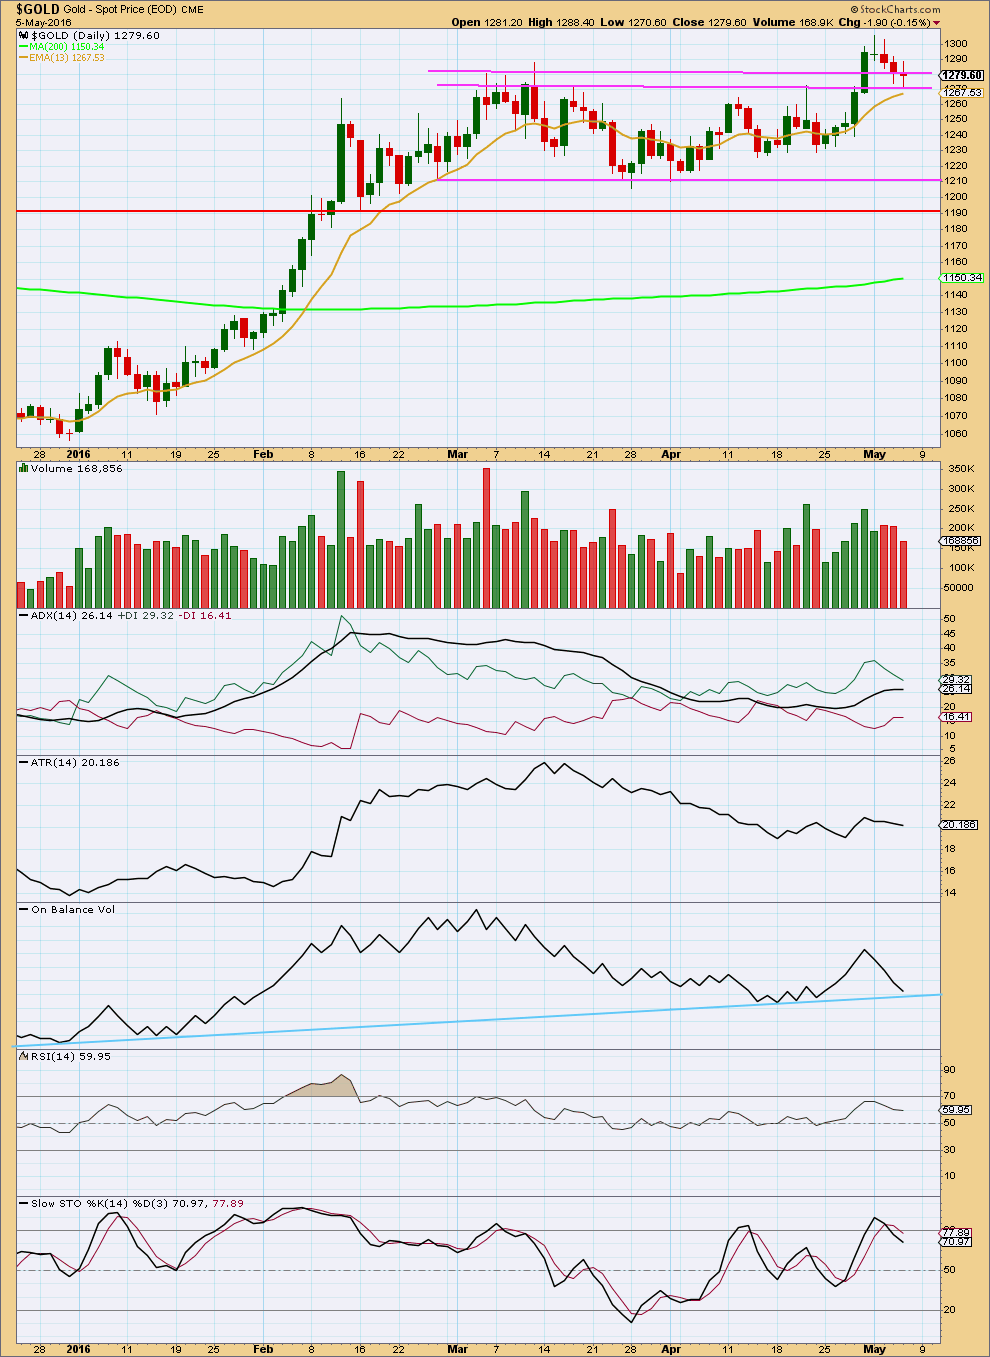
Click chart to enlarge. Chart courtesy of StockCharts.com.
The last five days’ price action looks like a classic breakout from consolidation, followed by a back test to support which was previously resistance. This is my favourite high probability trade set up. Entering long here still has the risk that price may reenter the consolidation as sometimes happens.
Volume increased as price moved higher to the last high. The rise in price was supported by volume. Now as price moves lower volume and range decrease. The fall in price is not supported by volume, and the decrease in range makes this small downwards movement look corrective.
ADX is still slightly increasing. The +DX line is above the -DX line, so ADX indicates an upwards trend is in place.
ATR is slightly declining, indicating the market is not currently trending. Some ambiguity between these two indicators may be expected in the early stages of a trend.
On Balance Volume has come down to find support at the long held blue line. Because this line is not steep, is long held and repeatedly tested it has good technical significance. This trend line on OBV may serve to hold up price here.
RSI is not extreme, so there is room for price to rise.
Stochastics is not extreme, so there is room for price to rise. But this oscillator may remain extreme for reasonable periods of time in a trending market. Its best use in a trending market is for divergence to indicate trend weakness.
While the trend remains intact, downwards corrections may be expected to find support about the 13 day moving average. Price today is almost at this average. If price moves any lower, it may not be by much.
This analysis is published @ 07:55 p.m. EST.
There’s a morning doji star pattern on the daily chart now.
But it hasn’t come after a long period of decline, so according to Nison it shouldn’t be given much if any weight.
Volume will be a good guide today.
StockCharts don’t finalise volume data until after 6:30pm EST. But I have COMEX data already, and that shows lighter volume.
That is very concerning for the bullish wave count.
If members have long positions then be aware there is a very real risk that the alternate wave count may be correct. Volume and COT indicate the possibility of some strong downwards movement. Reduce risk. Move stops to breakeven or close to it.
For more confidence in the bullish wave count we need a new high above 1,303.51.
StockCharts data is finalised now and shows heavy volume. That supports a bullish wave count.
I’m going to stick with StockCharts volume data. COMEX is Chicago only (I am assuming, as it’s from the Chicago exchange) and Gold is a global market.
But I’ll give the alternate an hourly chart.
Gold COTs:
Commercials long 116,644 commercials short 411,545
Change long 199 short 54,992
this is one of the most bearish COTs in a while, …
Cots up a huge 40k short…..highest I’ve seen..
Almost 300k net short……gold may be going lower than we think
I think the COT people will lose their shirt over trying to short gold.
IKR
I keep looking at COT and expecting Gold to go strongly lower… and so far it just won’t do it.
That’s a big reason why I have the alternate daily chart. And until that’s invalidated I’m going to give a little weight to it and the COT reports.
My position is again positive and so I’m again moving my stop to break even.
If the commercials are right (and they are more often right than wrong) and the alternate is right I don’t want to bear the loss. I want to reduce my risk to zero as soon as reasonable.
Lara how deep may this 4th wave correction go today or could it end Monday?
I missed getting into GDX and may today or Monday?
Firstly: I don’t think it’s done yet. On the five min chart it looks like an impulse down, so maybe that’s the A wave of a zigzag.
I would expect most likely it to be about 1,285 or above so that it’s relatively shallow.
Take a look at how minor 3 began for the first wave up on the daily chart, from the lows.
It didn’t begin strongly immediately.
Minute i was short, lasting only two days. Minute ii was again deep, lasting 7 days!
Now this does not mean that this current minor 3 must begin in the same manner. But the probability is high it will have similarities.
So far my experience with analysing Gold says it begins impulses slowly, and ends them fast and strong with the fifth wave. This seems to be particularly true for Gold’s third waves, and we may now be entering a third wave at two degrees.
And so corrections present an opportunity to join the trend. Position yourself early in the trend, once it gathers steam it gets harder to enter. At the end it can be explosive.
I’ll be looking for a few things to exit, one or more of these points:
1. Targets reached should trigger the trade closed. Targets will be adjusted at the end to try and be as accurate as possible.
2. A trend line breached to the downside would indicate the trend is over.
3. A typical blowoff top may indicate the end to the fifth wave.
Lara, I’m not following your comment.
Minor 3 doesn’t show started on the daily. Now on the hourly I see its start but even here neither minute i nor ii is labeled. Can you clarify? Do I have the wrong charts?
I was meaning within intermediate (1).
From the low in December 2015.
Look at the end of minor 2 on 17th December, that’s where minor 3 began.
We are in a similar position now.
I’ll go over this in todays video to make it clear.
thanks. Really appreciating your steady hand atm. I’m overdue for luch. Cookies don’t cut it!
I just figured you out. Your talking about the minor 3 in intermediate 1.
Cancel the prior confusion. Must be from lack of caffeine!
🙂 Cookies without coffee? Does that even work?
Since 12:45 pm Gold and GDX have been dropping. It doesn’t look good.
Perhaps this is a big 4th wave correction down?
Also another buying point or may this be a pullback to support and opportunity to buy at support?
US Dollar gained strength this afternoon and the Dow, Nasdaq, and S&P 500 have pared their losses and now are at session highs. I was really hoping that the markets would begin to roll over helping gold climb. I read one of the early comments indicating that the markets would fall and thought that today was going to be the day.
Lara – Just a quick note to thank you for staying up late and your guidance. I hope you rested well and have a chance to get some tea before providing us one more post before market close 😉
Since at 1 pm the US dollar went up and gold down.
US dollar now at high of the week, which is strange and not good for gold.
Tea in hand now 🙂
Back on the coffee next Thursday. I had to give it up for 6 weeks 🙁
I think it’s just a fourth wave correction Richard.
So far it looks like minor 2 is over.
Gold finally made a new day high at 12:42 pm and hit 1295.63 at 12:46 pm so far.
Any idea how high gold might get up to before the close today if you don’t want to hold any position over the weekend?
This already happened at 8:30 am when US Non Farm payroll news released and strong for gold, which pushed way above 1,286.04 to 1,294.67 at 8:32 am day high.
A new high above the start of minuette wave (c) at 1,280.21 *edit: 1,286.04 would provide some price indication that downwards movement is most likely over. At that stage, upwards movement could not be a second wave correction within minuette wave (c), so at that stage minuette wave (c) would have to be over.
GDX and Gold are now bullish Buy at MACD and SMA/EMA all time frames 1 minute to 195 minute.
Although that can change.
A complete turnaround from Wednesday’s lows.
I agree.
By my reckoning, we are now in Minor 3 minute 1 minuette 5 subminuette 3, now finishing up micro 2.
My target for Minute 1 is ideally 1313.42, but the subwaves currently point towards 1305 to 1308 range although that will certainly change when more structure comes into play. I will be holding on to my quite respectable gains in NUGT until then. I expect to hit 122.96.
Awesome, that would be a 43% increase for NUGT from Wednesday’s low of 86.20 up to 122.96.
Hi Alan and congrats on your profitability. I just entered today. Have a question for you..
can the upward movement of today/yesterday be structure into the alternate daily chart? Its invalidation is 1303.51 so I’m just thinking ‘what if’ today’s subminuette 5 wave is short of 1303.51 and then minuette ii starts turning downward? We wouldn’t have confirmation yet. What do you think?
In other words, Does the start of a minor 3 up necessitate looking different than a corrective wave within a minor C down?
Hi dsprospering. From my experience, C waves are very strong, acting like 3rd waves. If price moves up close to the invalidation point, then it may not have the “right look”. Not to say that it won’t; in trading all things are possible.
However, I don’t worry about such things when I day-trade. I just trade price, a simple trading system, I don’t use news and indicators, just price movement. But I don’t advise others to do the same unless they are quite sure of the Elliott wave structure to guide them. I am wrong about the wave structure at times but if the batting average is good, then I am fine.
9:31am Fed hike off the table for June given step back in job growth
http://www.marketwatch.com/story/fed-hike-off-the-table-for-june-given-step-back-in-job-growth-2016-05-06
8:30 am EST Bad US Jobs Report – The smallest gain in seven months, in a sign that a slower economy may have crimped job creation.
http://www.marketwatch.com/story/us-creates-160000-jobs-in-april-unemployment-5-2016-05-06
8:32am June gold soars after jobs report, up $21.80, or 1.7%, to $1,294/oz.
Intial move looking bullish gla
Finally Gold has broken above the trend channel. It’s my bedtime so I’m adding to my long position here. Stop just below invalidation. Target 1,477.
I expect NFP will see Gold whipsaw, mostly up. Lets see how it looks in the morning.
Gold still can’t break out of the channel it’s in.
I’m just not prepared to add to my long while it keeps finding resistance there.
Not yet…. a little more patience.
Yes still in the 1 hour price channel now since May 2nd
http://www.pmbull.com/gold-price/
This should break gold out of it’s channel.
FRIDAY, MAY 6th – 8:30 am EST -US Nonfarm payrolls
This is usually big news.
Yes, that’ll move it one way or the other.
I may have to stay up late…. 8:30am EST is 12:30am my time. That’s well past my bedtime!
The US Dollar has been getting stronger since 4 am Tuesday morning so it’s harder for gold to break out up out of the down channel.
Gold went up all last week and the US dollar went down the whole week.
http://www.investing.com/quotes/us-dollar-index-streaming-chart
Gold And Gold Stocks – Is The Correction Finally Beginning?
May 6, 2016 1:02 AM ET
http://seekingalpha.com/article/3972175-gold-gold-stocks-correction-finally-beginning?auth_param=f1b50:1bio9di:56beca1716035eeeb60015d9dafe2dba&uprof=44
FRIDAY, MAY 6th – 8:30 am EST -US Nonfarm payrolls
Gold just moved above $1,280.21 at 10:32 pm EST to $1,280.32 and higher a few minutes later.
“A new high above the start of minuette wave (c) at 1,280.21 would provide some price indication that downwards movement is most likely over. At that stage, upwards movement could not be a second wave correction within minuette wave (c), so at that stage minuette wave (c) would have to be over.”
The start of minuette (c) is around 1286.5, so the 1280.21 must be a typo.
Johno, thank you. You are right minuette (c) started at $1,286.54 at 9:08 am Thursday as per pmbull.com. So NO price indication that downward movement is most likely over.
Yes, I am so sorry everybody! I read the low not the high of that candle.
It should be 1,286.04
The Silver count calls for more down and the correction in GDX doesn’t look like a 3 on the daily chart yet. Therefore, I’m concerned that the correction in gold may not be over yet. Here’s a possible look at GDX.
Just a note about Silver is due to much lower volume with Silver verses Gold, EW is not as accurate with Silver as with Gold. So If in any doubt I just follow EW for Gold. Lara has mentioned that and the volume with gold is high enough that EW with gold is textbook as per EW.
I’m not confident of my Silver wave count at this time.
I am more confident of my Gold count.
It is possible for the second daily count of Silver that minor 2 is over. They could both go up in a third of a third wave together.
Great to hear, there is more clarity in gold’s direction.
Sounds much more clear than Silver.
Yes. Silver has been very difficult. Gold has been easier.
That makes sense as miners are wilder than gold positive and negative and silver is wilder than gold positive and negative for more extremes so if gold can be difficult then silver can be very difficult to forecast and add in the reduced volume and even more difficult to forecast.