
Elliott wave and traditional technical analysis of NZDUSD.
New updates to this analysis are in bold.
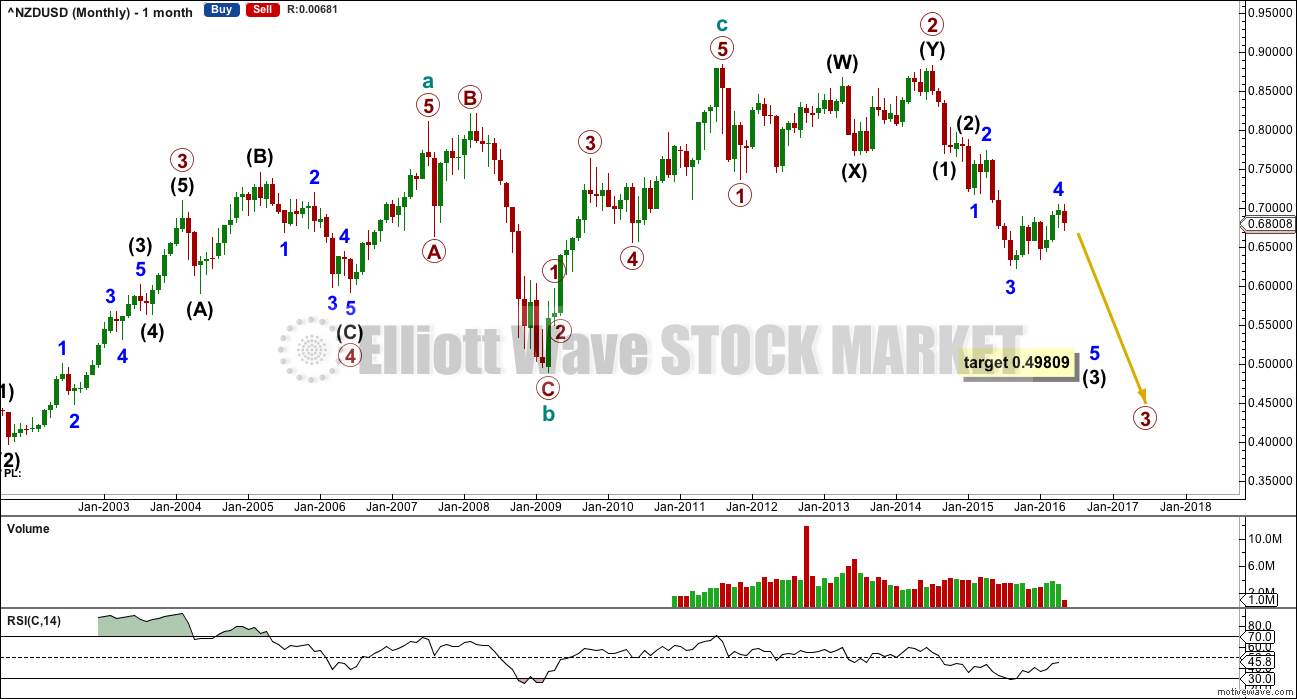
Summary: NZDUSD may be beginning a new downwards trend. The target is 0.49809. Risk is at 0.70532.
ELLIOTT WAVE COUNT
Click chart to enlarge.
Primary 3 should end when RSI indicates oversold and most likely not before. Currently RSI has returned just above oversold.
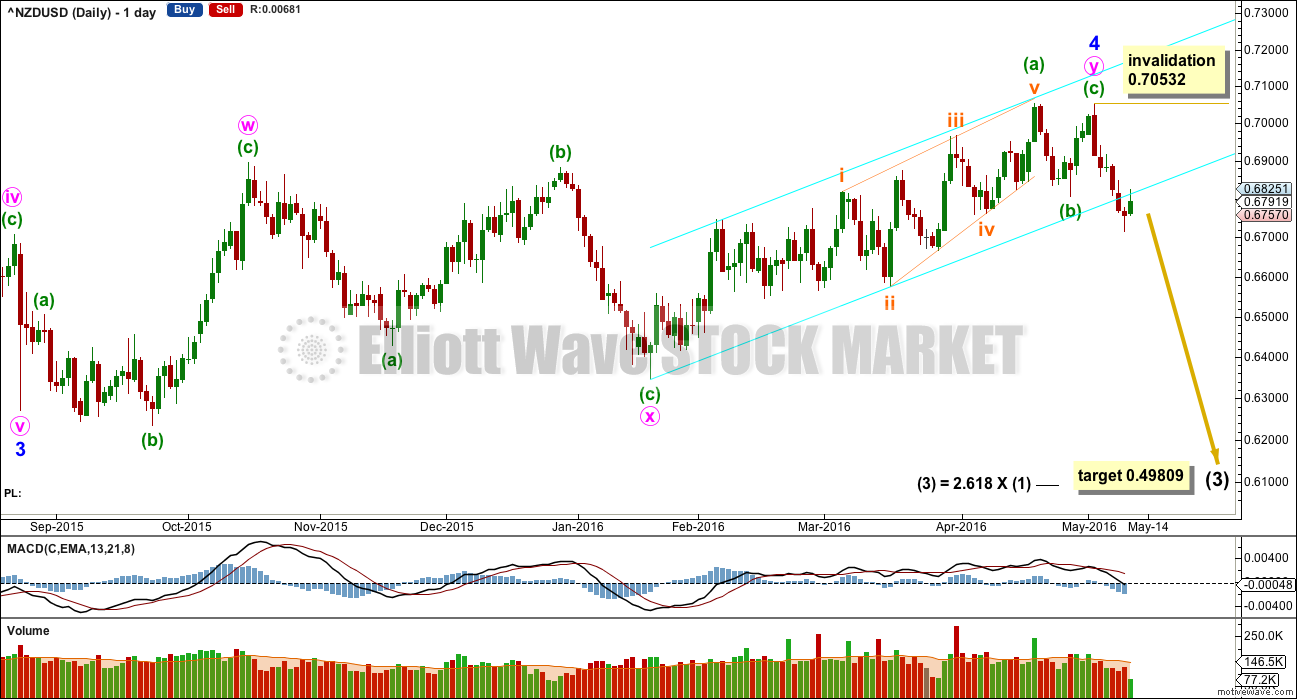
Primary 3 would reach 2.618 the length of primary 1 at 0.49809. The structure of primary 3 is incomplete.
The volume profile is no longer clear. During minor wave 3 down, the trend was clearly down and supported by volume. During minor wave 4 upwards, the rise in price was supported by volume but the last upwards month of April shows a decline in volume.
Click chart to enlarge.
Minor wave 4 may be complete as a double combination: flat – X – zigzag.
The best fit channel about minute wave y is breached and now price is throwing back to the lower trend line. Price may bounce off this line and move lower.
Within minor wave 5, no second wave correction may move beyond the start of its first wave above 0.70532.
TECHNICAL ANALYSIS
Click chart to enlarge.
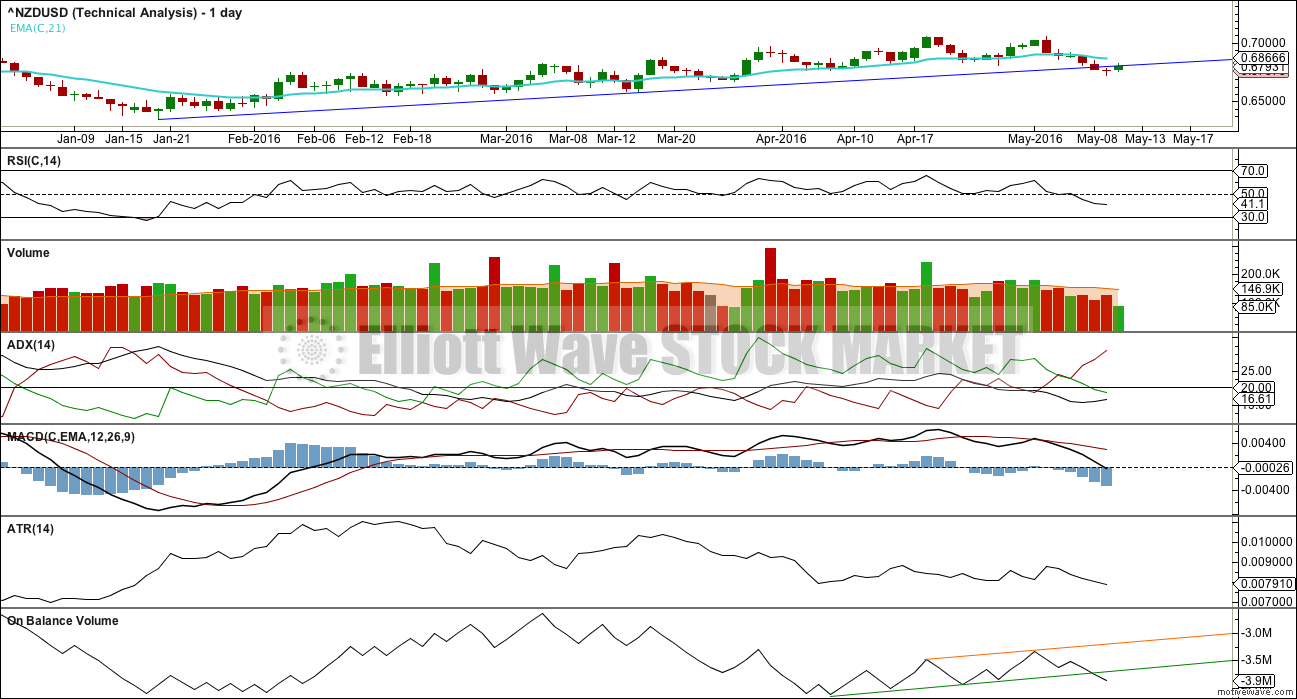
Price has breached a support line which has been tested at least three times and is long held. Price is turning up to test resistance at the line. It is likely that price would move lower from here.
From the last high on 3rd May as price falls volume rises. The fall in price is supported by volume so far, so it supports a downwards trend.
ADX indicates a downwards trend may be beginning. ATR does not yet agree; it is declining.
On Balance Volume is giving a strong bearish signal with a break below the green line.
Overall, the classic technical analysis picture supports the Elliott wave count.
This analysis is published @ 04:16 a.m. EST on 11th May, 2016.