
Last week’s analysis expected upwards movement, which is not what happened.
Summary: A correction is incomplete. More downwards movement to 16.297 is expected to complete it.
New updates to this analysis are in bold.
WEEKLY WAVE COUNT
Click chart to enlarge.
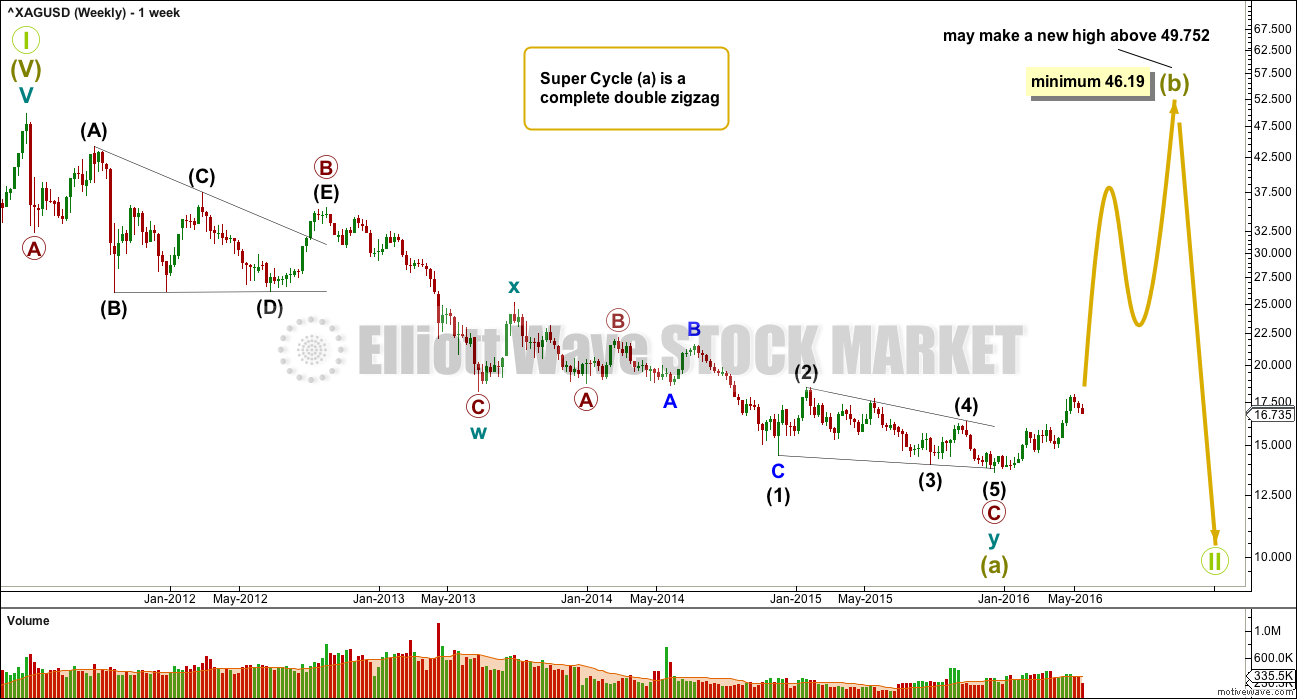
If super cycle wave (a) is a double zigzag, then within the second zigzag of the double labelled cycle wave y the structure may be complete.
Primary wave C is an ending contracting diagonal within the zigzag of cycle wave y. All subwaves subdivide as zigzags. The third wave is shorter than the first, the fifth wave is shorter than the third, and the fourth wave is shorter than the second. The trend lines converge.
There is a small overshoot of the (1)-(3) trend line at the end. This indicates the contracting diagonal structure is very likely to be complete.
If this wave count is correct, then super cycle wave (a) has subdivided as a three wave structure. That indicates Grand Super Cycle wave II may be a flat correction.
If this correction at Grand Super Cycle is a second wave (as opposed to a fourth wave), then a triangle may be eliminated.
A combination may also be eliminated because the first wave is a multiple. Combinations may only consist of a maximum of three corrective structures, so within each of W, Y and Z they may only subdivide into simple A-B-C structures (or A-B-C-D-E in the case of triangles). To label multiples within multiples increases the maximum beyond three, violating the rule.
Super Cycle wave (b) must retrace a minimum 90% of super cycle wave (a) at 46.19. Super cycle wave (b) may make a new price extreme beyond that seen for super cycle wave (a) above 49.752 as in an expanded flat.
Super cycle wave (b) may be any one of 23 possible corrective structures. It is impossible to predict at this early stage which one it will be, only to say it is unlikely to be a rare structure such as a running flat, expanding triangle or triple combination. That still leaves multiple structural possibilities. The most likely structure which would be able to meet the minimum price requirement at 23.945 is a zigzag.
The first movement up for a wave of this large degree must subdivide as a clear five at the daily chart level, and probably at the weekly chart level also.
MAIN DAILY WAVE COUNT
Click chart to enlarge.
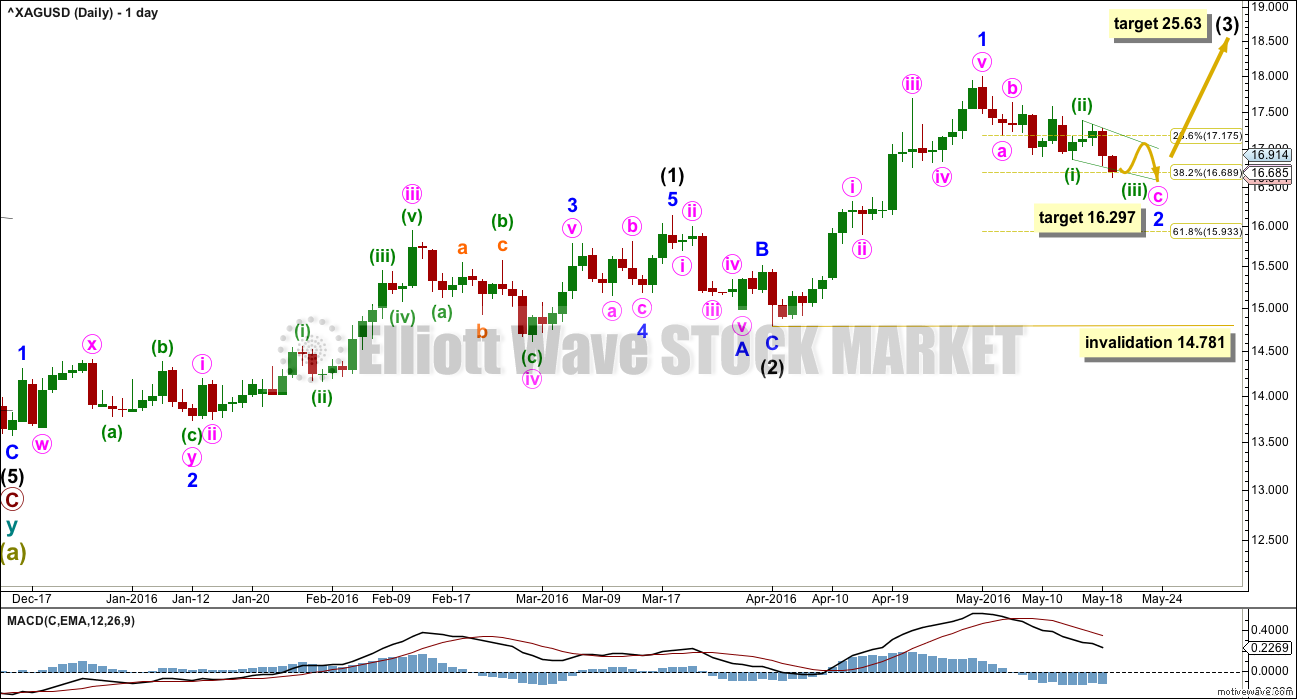
Minor wave 2 has continued lower and now the structure is incomplete. A zigzag looks like it is unfolding lower. The structure for minute wave c fits so far as an ending diagonal.
At 16,297 minute wave c would reach 1.618 the length of minute wave a.
When downwards movement is a complete corrective movement, then a trend change should be expected. The upwards trend should resume.
At 25.63 intermediate wave (3) would reach 4.236 the length of intermediate wave (1).
Minor wave 2 may not move below the start of minor wave 1 at 14.781.
So far downwards movement fits neatly into a small channel. When the channel is breached by upwards movement, that shall provide trend channel confirmation of a trend change.
SECOND DAILY WAVE COUNT
Click chart to enlarge.
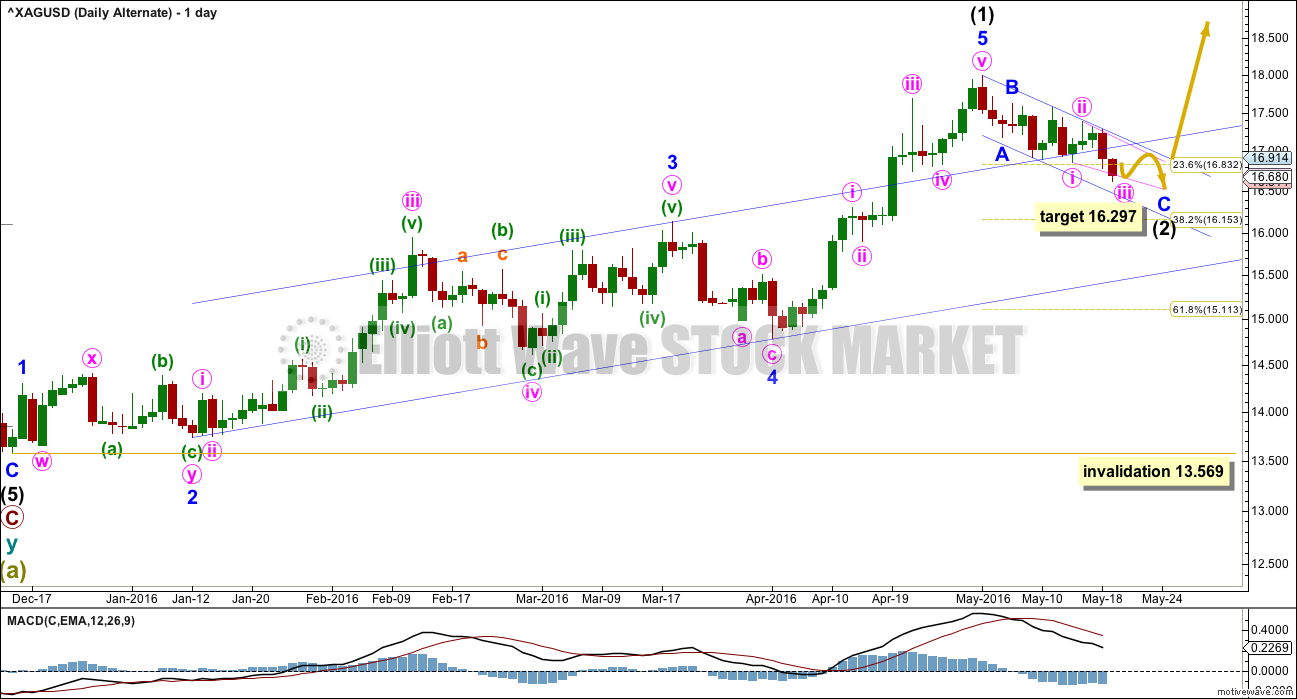
The structure for the downwards correction is the same for both wave counts. The target is the same.
If this correction is intermediate wave (2), then the invalidation point is lower. Intermediate wave (2) may not move beyond the start of intermediate wave (1) below 13.569.
Use the channel in the same way.
Price may not provide clarity between these two wave counts if the target is correct. Momentum and structure in coming weeks may indicate which wave count is correct.
TECHNICAL ANALYSIS
DAILY CHART
Click chart to enlarge. Chart courtesy of StockCharts.com.
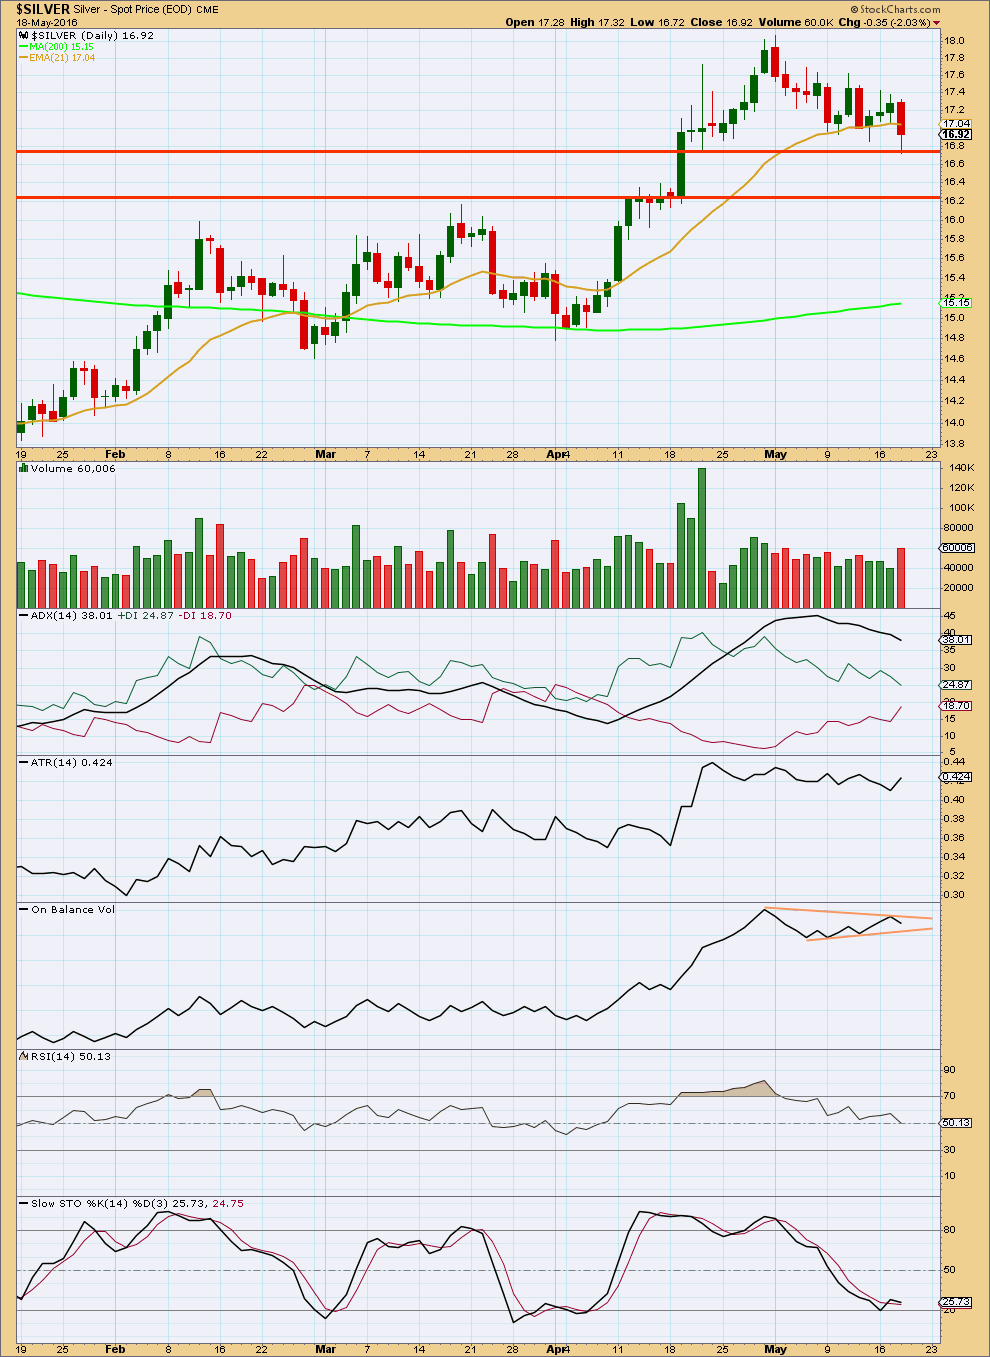
Despite downwards movement coming on overall declining volume up to 18th of May, price keeps falling. This market is falling of its own weight up to 18th May. On this date there was support from volume as it was higher while price fell.
Price may find some support about the horizontal trend line at 16.75.
ADX is declining indicating the market is not currently trending. ATR remains overall flat in agreement with ADX.
On Balance Volume is constrained between two small converging lines. A break out by OBV may precede the direction for price.
The hidden bullish divergence between price and RSI up to last week disappeared, and it was not followed by any upwards movement from price as was suggested.
RSI is neutral. There is room for price to rise or fall.
Stochastics is nearing oversold. This downwards swing from price may end when price finds support and Stochastics reaches oversold at the same time. This indicates that downwards movement from price may stop here or soon.
This analysis is published @ 04:42 a.m. EST on 19th May, 2016.
looks like it held the line so far. Buying?
Not yet. For silver I don’t think the structure is complete.
This market is very difficult to analyse and trade. It’s EW structures just don’t look clear very often, in contrast to Gold.
For Silver I’d always be waiting for trend channel confirmation. I’d only buy on a breach of the small pink channel (main daily chart) to the upside.