
A new high above 44.49 confirmed more upwards movement. The target remains the same.
There is only one Elliott wave count this week for Oil.
Summary: Expect that the trend remains the same, up, while price remains within the dark blue channel. The target remains at 51.09. The structure is incomplete. One more small fourth wave correction along the way up should remain above 42.42.
New updates to this analysis are in bold
MONTHLY ELLIOTT WAVE COUNT
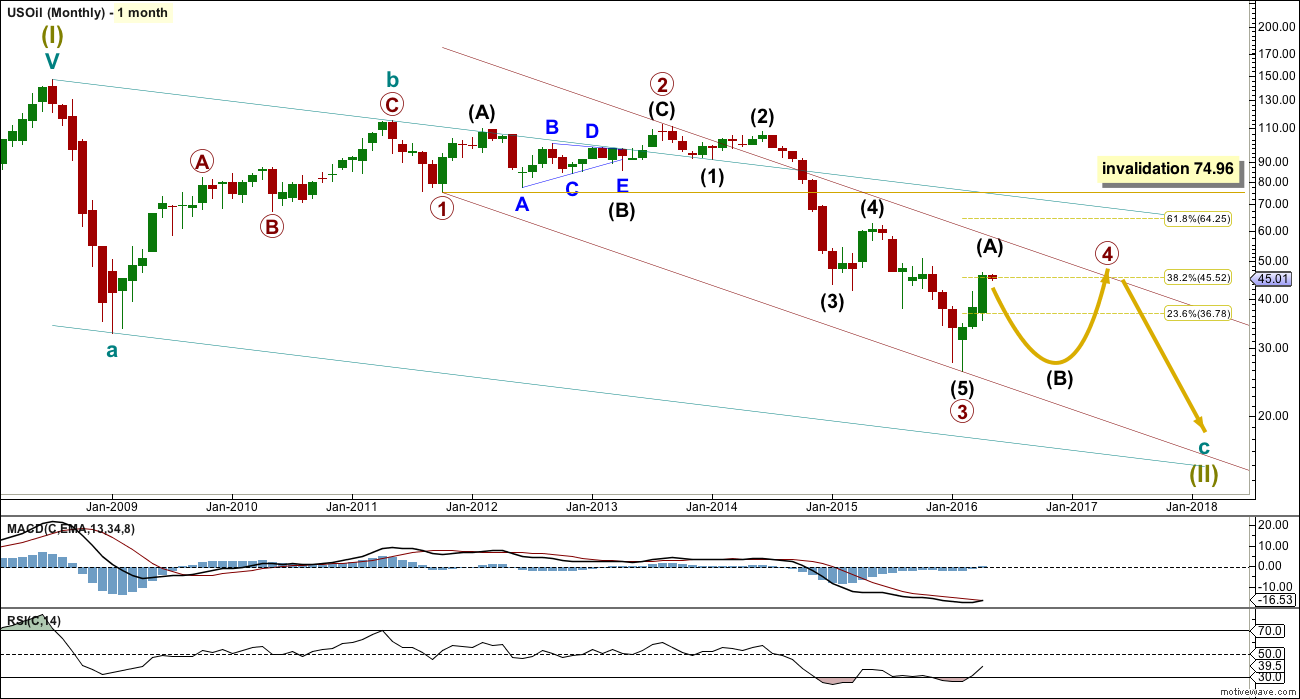
Click chart to enlarge.
Within the bear market, cycle wave b is seen as ending earlier, in May 2011. Thereafter, a five wave structure downwards for cycle wave c begins.
Primary wave 1 is a short impulse lasting five months. Primary wave 2 is a very deep 0.94 zigzag lasting 22 months. Primary wave 3 is a complete impulse with no Fibonacci ratio to primary wave 1. It lasted 30 months.
Primary wave 4 is likely to exhibit alternation with primary wave 2. Primary wave 4 is most likely to be a flat, combination or triangle. Within all of these types of structures, the first movement subdivides as a three.
Primary wave 4 is likely to end within the price territory of the fourth wave of one lesser degree; intermediate wave (4) has its range from 42.03 to 62.58.
Primary wave 4 may end if price comes up to touch the upper edge of the maroon channel.
Primary wave 4 is most likely to be shallow to exhibit alternation in depth with primary wave 2. The 0.382 Fibonacci ratio at 45.52 is within the price range of intermediate wave (4), so this is the most likely target.
Primary wave 4 may not move into primary wave 1 price territory above 74.96.
DAILY ELLIOTT WAVE COUNT
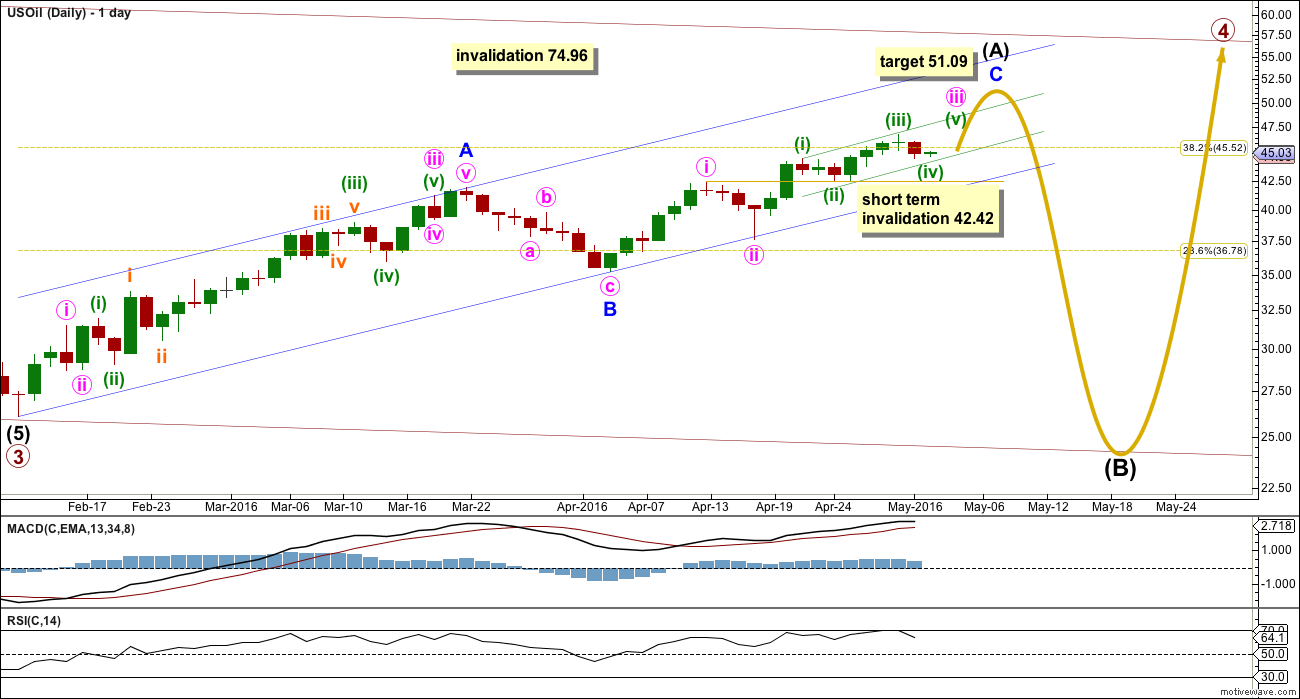
Click chart to enlarge.
Intermediate wave (A) is incomplete. It looks like it is unfolding as a zigzag.
At 51.09 minor wave C would reach equality in length with minor wave A.
Minor wave C must be a five wave structure. At this stage, it looks like it may be unfolding as an impulse.
Within minor wave C, minute wave iii is extending. It needs a final fifth wave up for minuette wave (v) to complete. The following correction for minute wave iv may not move into minute wave i price territory below 42.42.
When minute waves iv and v are complete, then the target may be calculated at minute degree also. At that stage, the target may change or widen to a small zone.
When intermediate wave (A) is a complete zigzag, then intermediate wave (B) downwards should be expected. It may be very deep. If it is over 0.9 the length of intermediate wave (A), then primary wave 4 may be a flat correction. Intermediate wave (B) of an expanded flat or running triangle may make a new low below the start of intermediate wave (A) at 26.06. There is no lower invalidation point at that stage for this wave count because there is no rule stating the limit for the length of a B wave within a flat or triangle, nor an X wave within a combination.
TECHNICAL ANALYSIS
MONTHLY CHART
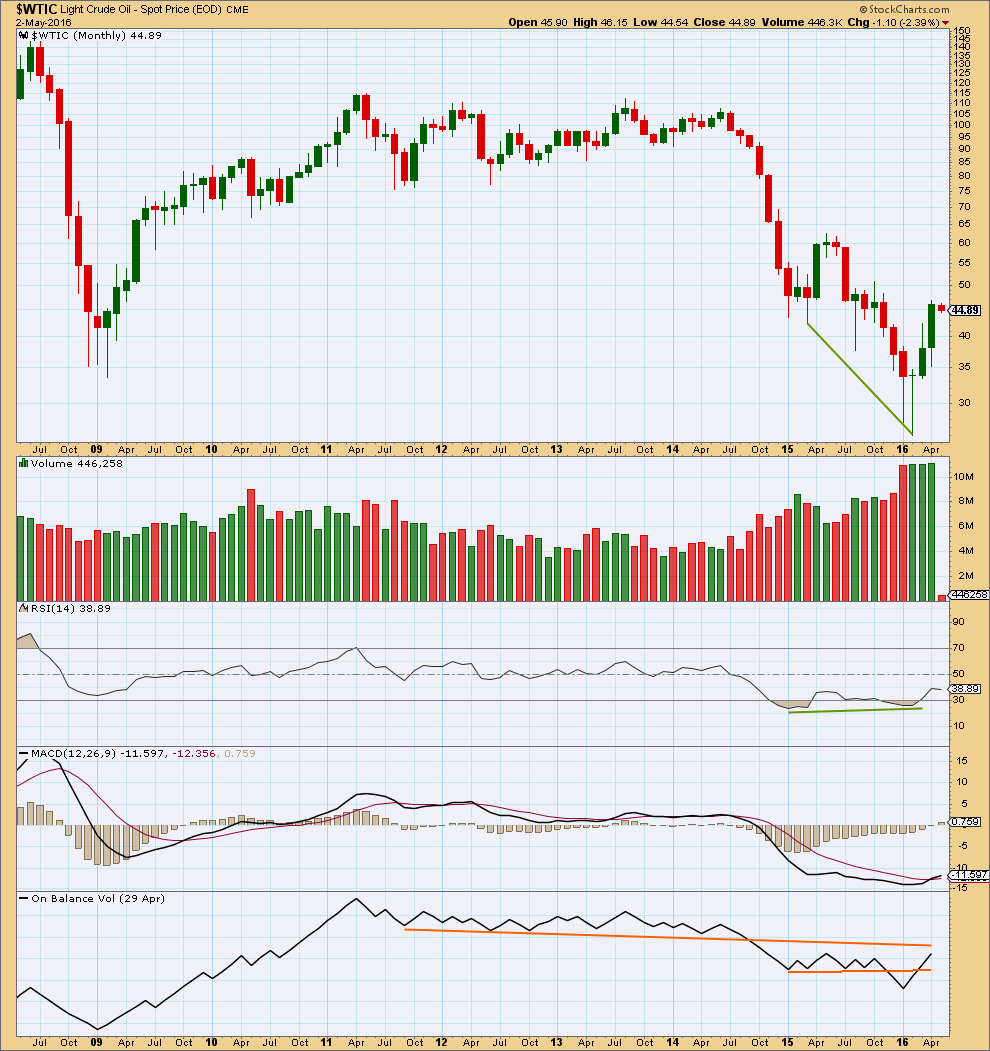
Click chart to enlarge. Chart courtesy of StockCharts.com.
Price shows divergence with RSI as price moved lower.
The fall in price was supported by volume. The rise in price from the low in February is supported by volume. This favours a bullish outlook.
The three monthly candlesticks for January, February and March create a Morning Doji Star reversal pattern. However, this is a warning of a trend change and not definitive. There is an example of a stronger candlestick reversal pattern on this monthly chart for March and April 2015. April 2015 completed a bullish engulfing candlestick pattern; this is the strongest reversal pattern and this example was particularly strong. Yet it only translated to one more month of slight new highs in May before the downwards trend resumed.
On Balance Volume has broken below two trend lines. OBV is beginning to break above the lower line. If the month of April can close with OBV above the lower orange line, that would be a reasonably strong bullish signal in support of the main Elliott wave count.
DAILY CHART
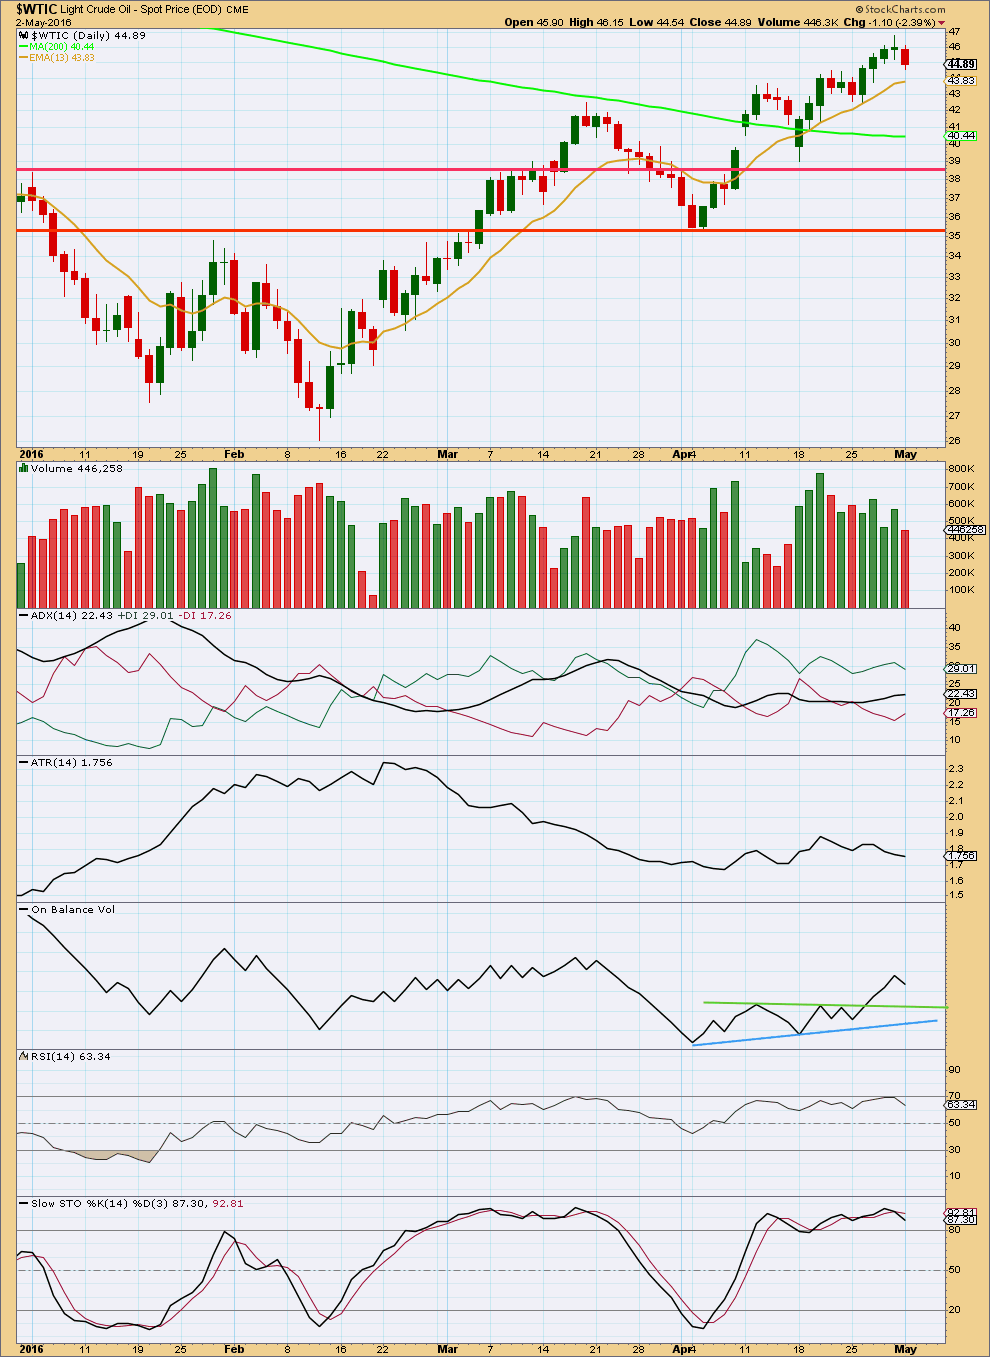
Click chart to enlarge. Chart courtesy of StockCharts.com.
For the last week volume is now decreasing as price rises. The rise in price is not supported well by volume. It looks like this upwards movement is running out of steam; a reversal or consolidation should be expected soon.
Price is finding support about the 13 day moving average. This should be expected to continue while the trend remains up.
ADX is increasing indicating there is an upwards trend. ATR disagrees because it is flat to declining which is not normal for a trend. This indicates caution; the trend may be weakening and close to ending. This fits with the Elliott wave count at this stage.
RSI is not extreme. There is still room for price to rise.
Stochastics is extreme, but this can remain so for reasonable periods of time during a trending market.
This analysis is published @ 01:41 a.m. EST on 3rd May, 2016.
Lara what does oil suggests…
Is it breaking..??
Or it have legs to walk towards 51$
Williams idea from just below.
Price has broken out of the small channel which I had on the daily chart (in analysis above). It looks like minor C may be over. A new low below 42.42 and below the blue channel would provide confirmation.
Intermediate (B) may make a new low below intermediate (A) as in an expanded flat or running triangle. This B wave may be expected to be deep and to last over 10 weeks.
Lara, Would this be an acceptable alternate wave count for OIL?
Definitely, yes. It meets all rules.
If price breaks below 42.42 then this is the wave count which should be used.
The zigzag would most likely be over, and a B wave down would most likely have begun.
I’m confused with Oil at the moment. This correction seems a little steep for the latter stages of minor C up.
Anyone with a clearer view on things?
Maybe the reversal in the US dollar Tuesday at 4 am from down since April 22nd it moved up Tuesday.
The correction Minor C seems reasonable to me with C=A. Yesterday, the market may have completed minuette 4 of minute 3 at 43.30, and is currently on its way to completing minute 3. (I’m using FXCM data feed). I envisage minute 3 to complete at 47.49 (minuette 5 = minuette 3) or 47.50 (minute 3 = 1.382 X minute 1). We are on the way to Lara’s Minor C target @ 51.09.
Apologies. I cannot furnish a chart as I mentioned before that I cannot find any free annotation software — don’t want to pay unnecessary expenses for one as I am fine without one. I crunch numbers.
Thanks Richard, but the USD is a fundamental factor with variable relevance. I’m more interested in the validity of the current Elliott count.
Thanks Alan.
Williams chart above looks good.